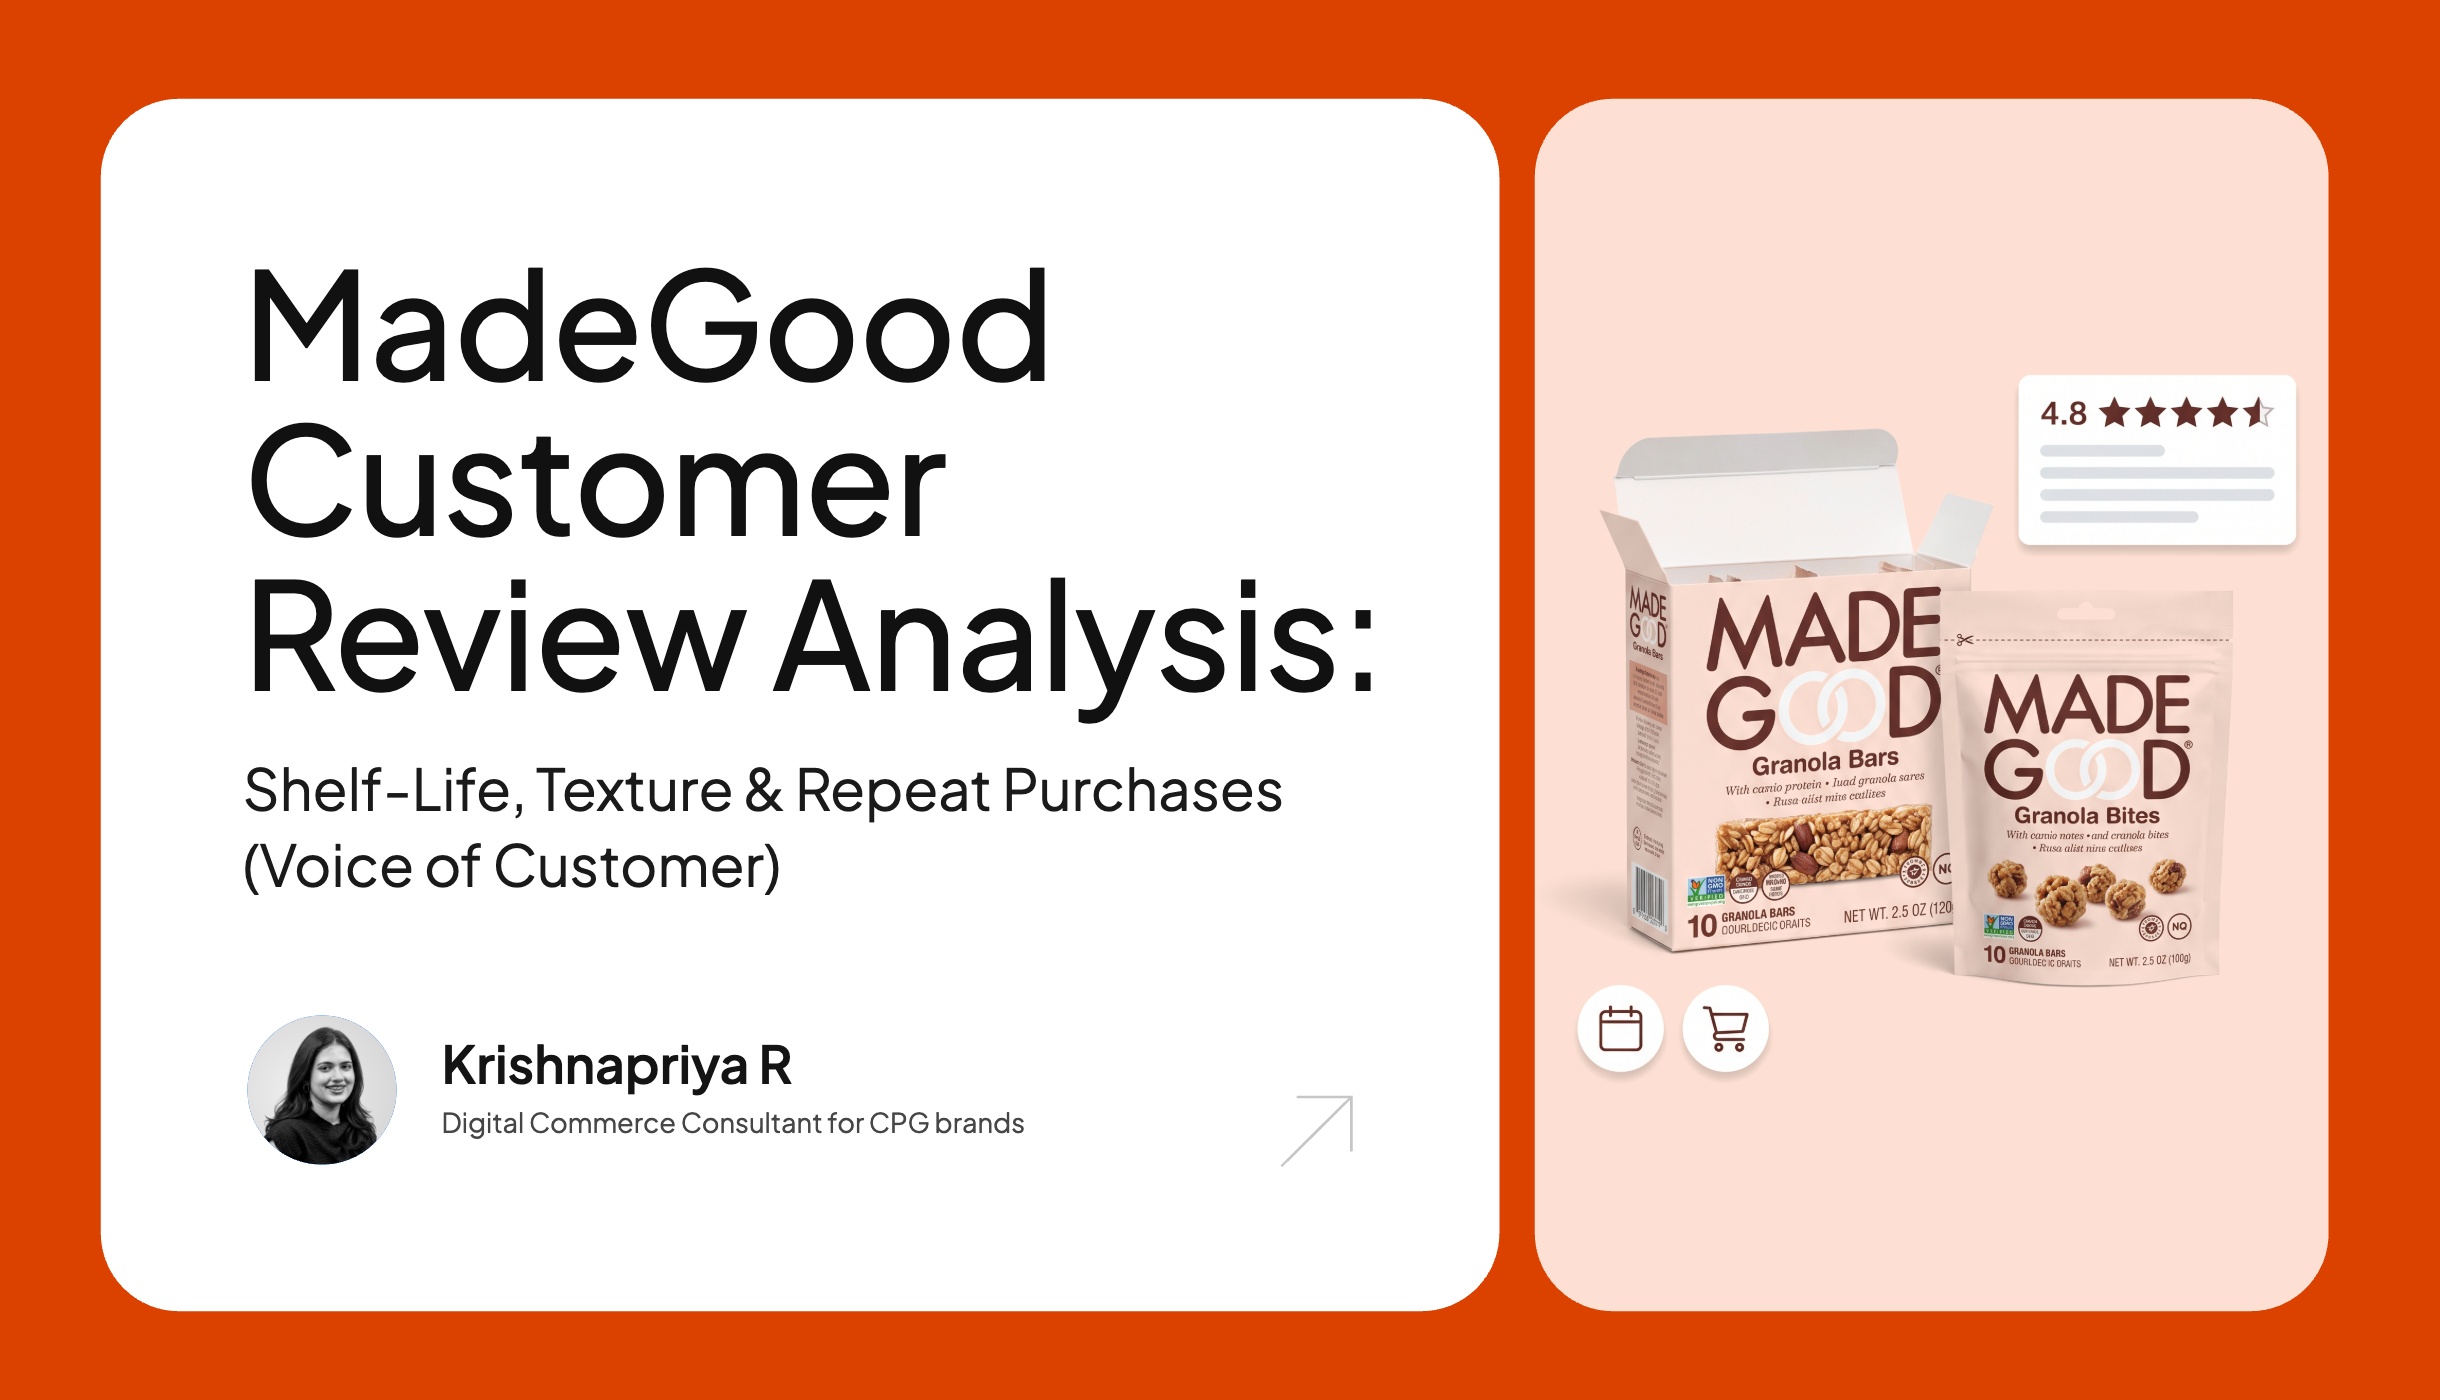
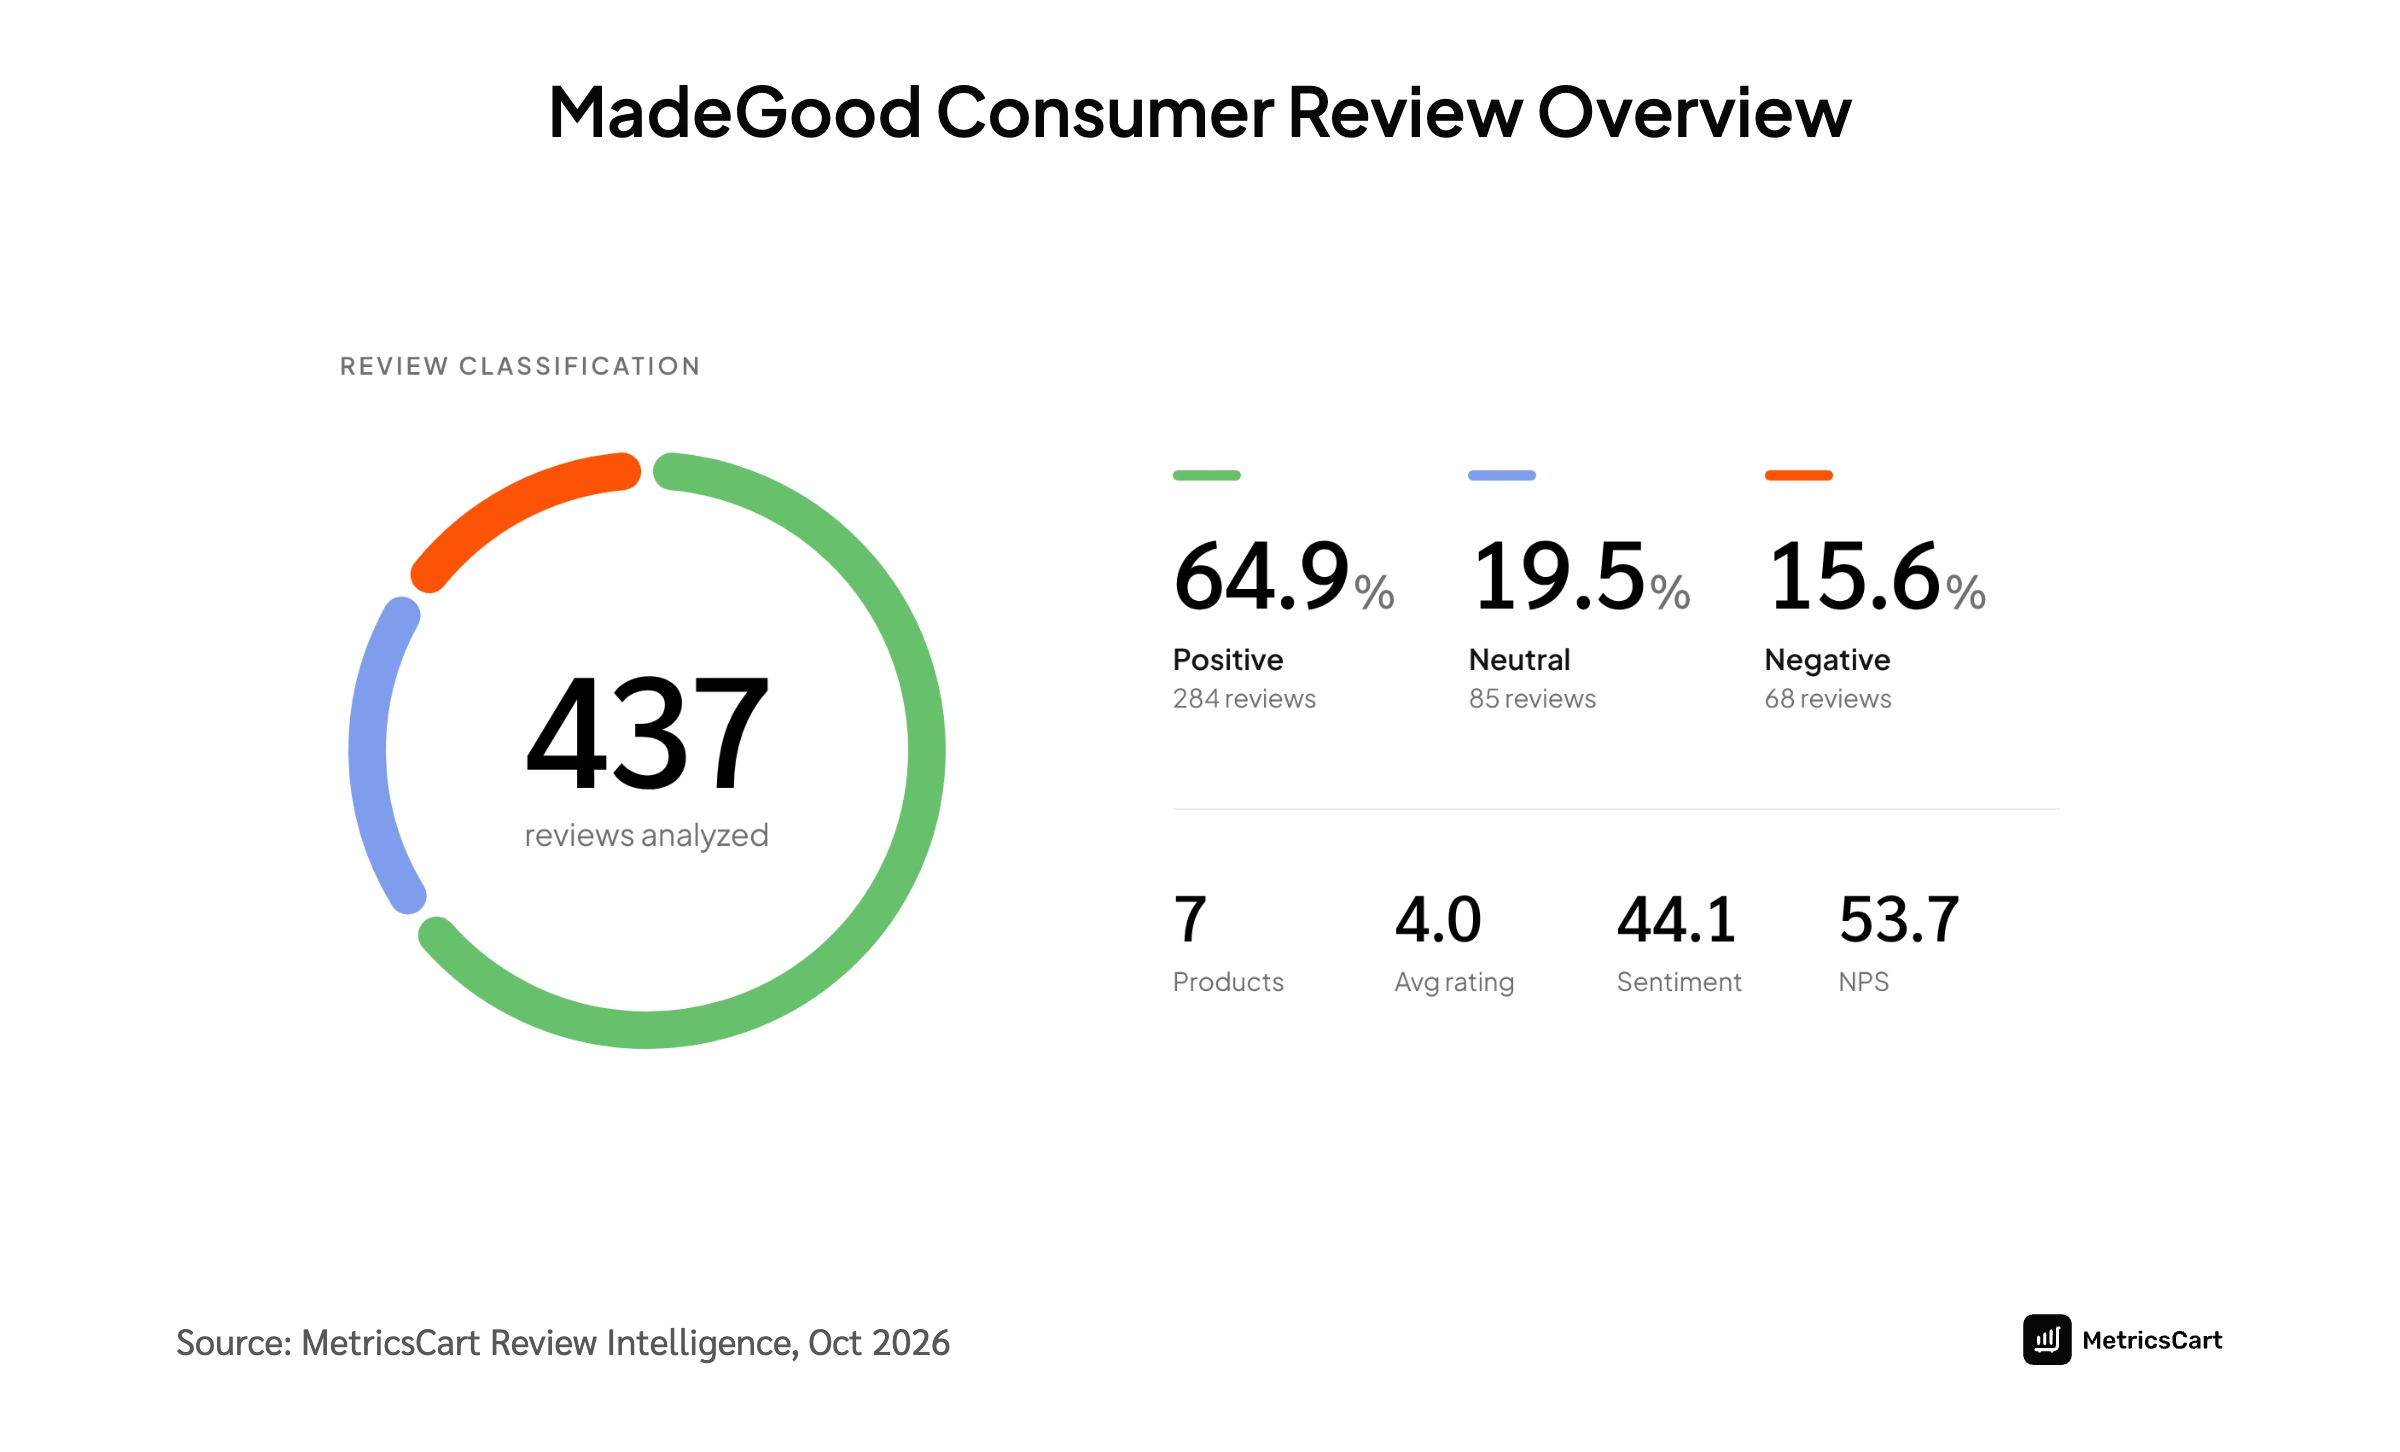
When managing client growth across omnichannel retail, aggregate star ratings are often the most misleading metric on an executive dashboard. On paper, MadeGood holds a steady 4.0-star average across major North American marketplaces. For many category managers, that looks like a healthy, stable product line.
Looking underneath that surface number across Amazon US, Amazon Canada, and Walmart through the MetricsCart Review Monitoring Platform, the granular consumer sentiment tells a far more nuanced operational story.
While 64.9% of shopper reviews celebrate the brand’s clean-label formulation and lunchbox convenience, an expanding 15.6% negative sentiment pocket reveals emerging supply chain, packaging, and retailer-specific freshness risks that brand operators cannot afford to ignore.
Here is my breakdown of what the voice of the customer analytics is telling us across marketplaces, and what I recommend brand and merchandising teams prioritize next.
Customer Sentiment Analysis: A Warning Signal in the 2026 Run Rate
Tracking review sentiment year-over-year reveals that MadeGood is navigating its second major sentiment volatility phase in four years.
After recovering from a steep negative drop in 2023 (where net customer sentiment dipped to -0.80 amid formulation and seal adjustments), the brand enjoyed an exceptional bounce in 2024 at +0.85. Over the past eighteen months, that momentum has softened noticeably: net sentiment slipped to +0.67 in 2025, and currently sits at +0.30 in 2026.
- Erosion of Repeat Purchase Rates & Customer LTV: As packaging seals and product texture fail to consistently meet expectations across batch runs, initial trial buyers fail to convert into subscription/repeat buyers.
- Depressed Organic Search Rank & Conversion Rates: Retailer search algorithms (such as Amazon’s A10 and Walmart’s search engine) factor review velocity and net sentiment into organic rankings. Softening sentiment throttles PDP conversion rates and lowers organic search visibility.
- Inflated Customer Acquisition Cost (CAC) & Reduced ROAS: Driving sponsored product ads to Product Detail Pages (PDPs) with declining sentiment scores leads to lower click-to-purchase conversion, burning retail media budget without delivering expected yield.
- Retailer Category Review Risk: Category managers at major retailers closely monitor digital marketplace review health during line reviews. Unaddressed negative sentiment pockets around packaging or freshness weaken brand leverage during shelf space negotiations.
In my experience reviewing category trajectories and from conversations with digital commerce teams, this pattern often happens when a brand successfully scales volume and broadens its catalog mix, moving from core granola bites into softer baked goods like mini cookies and oat cups, without upgrading moisture-barrier packaging or retailer inventory rotation to match.
What 65% of Positive Reviews Get Right?
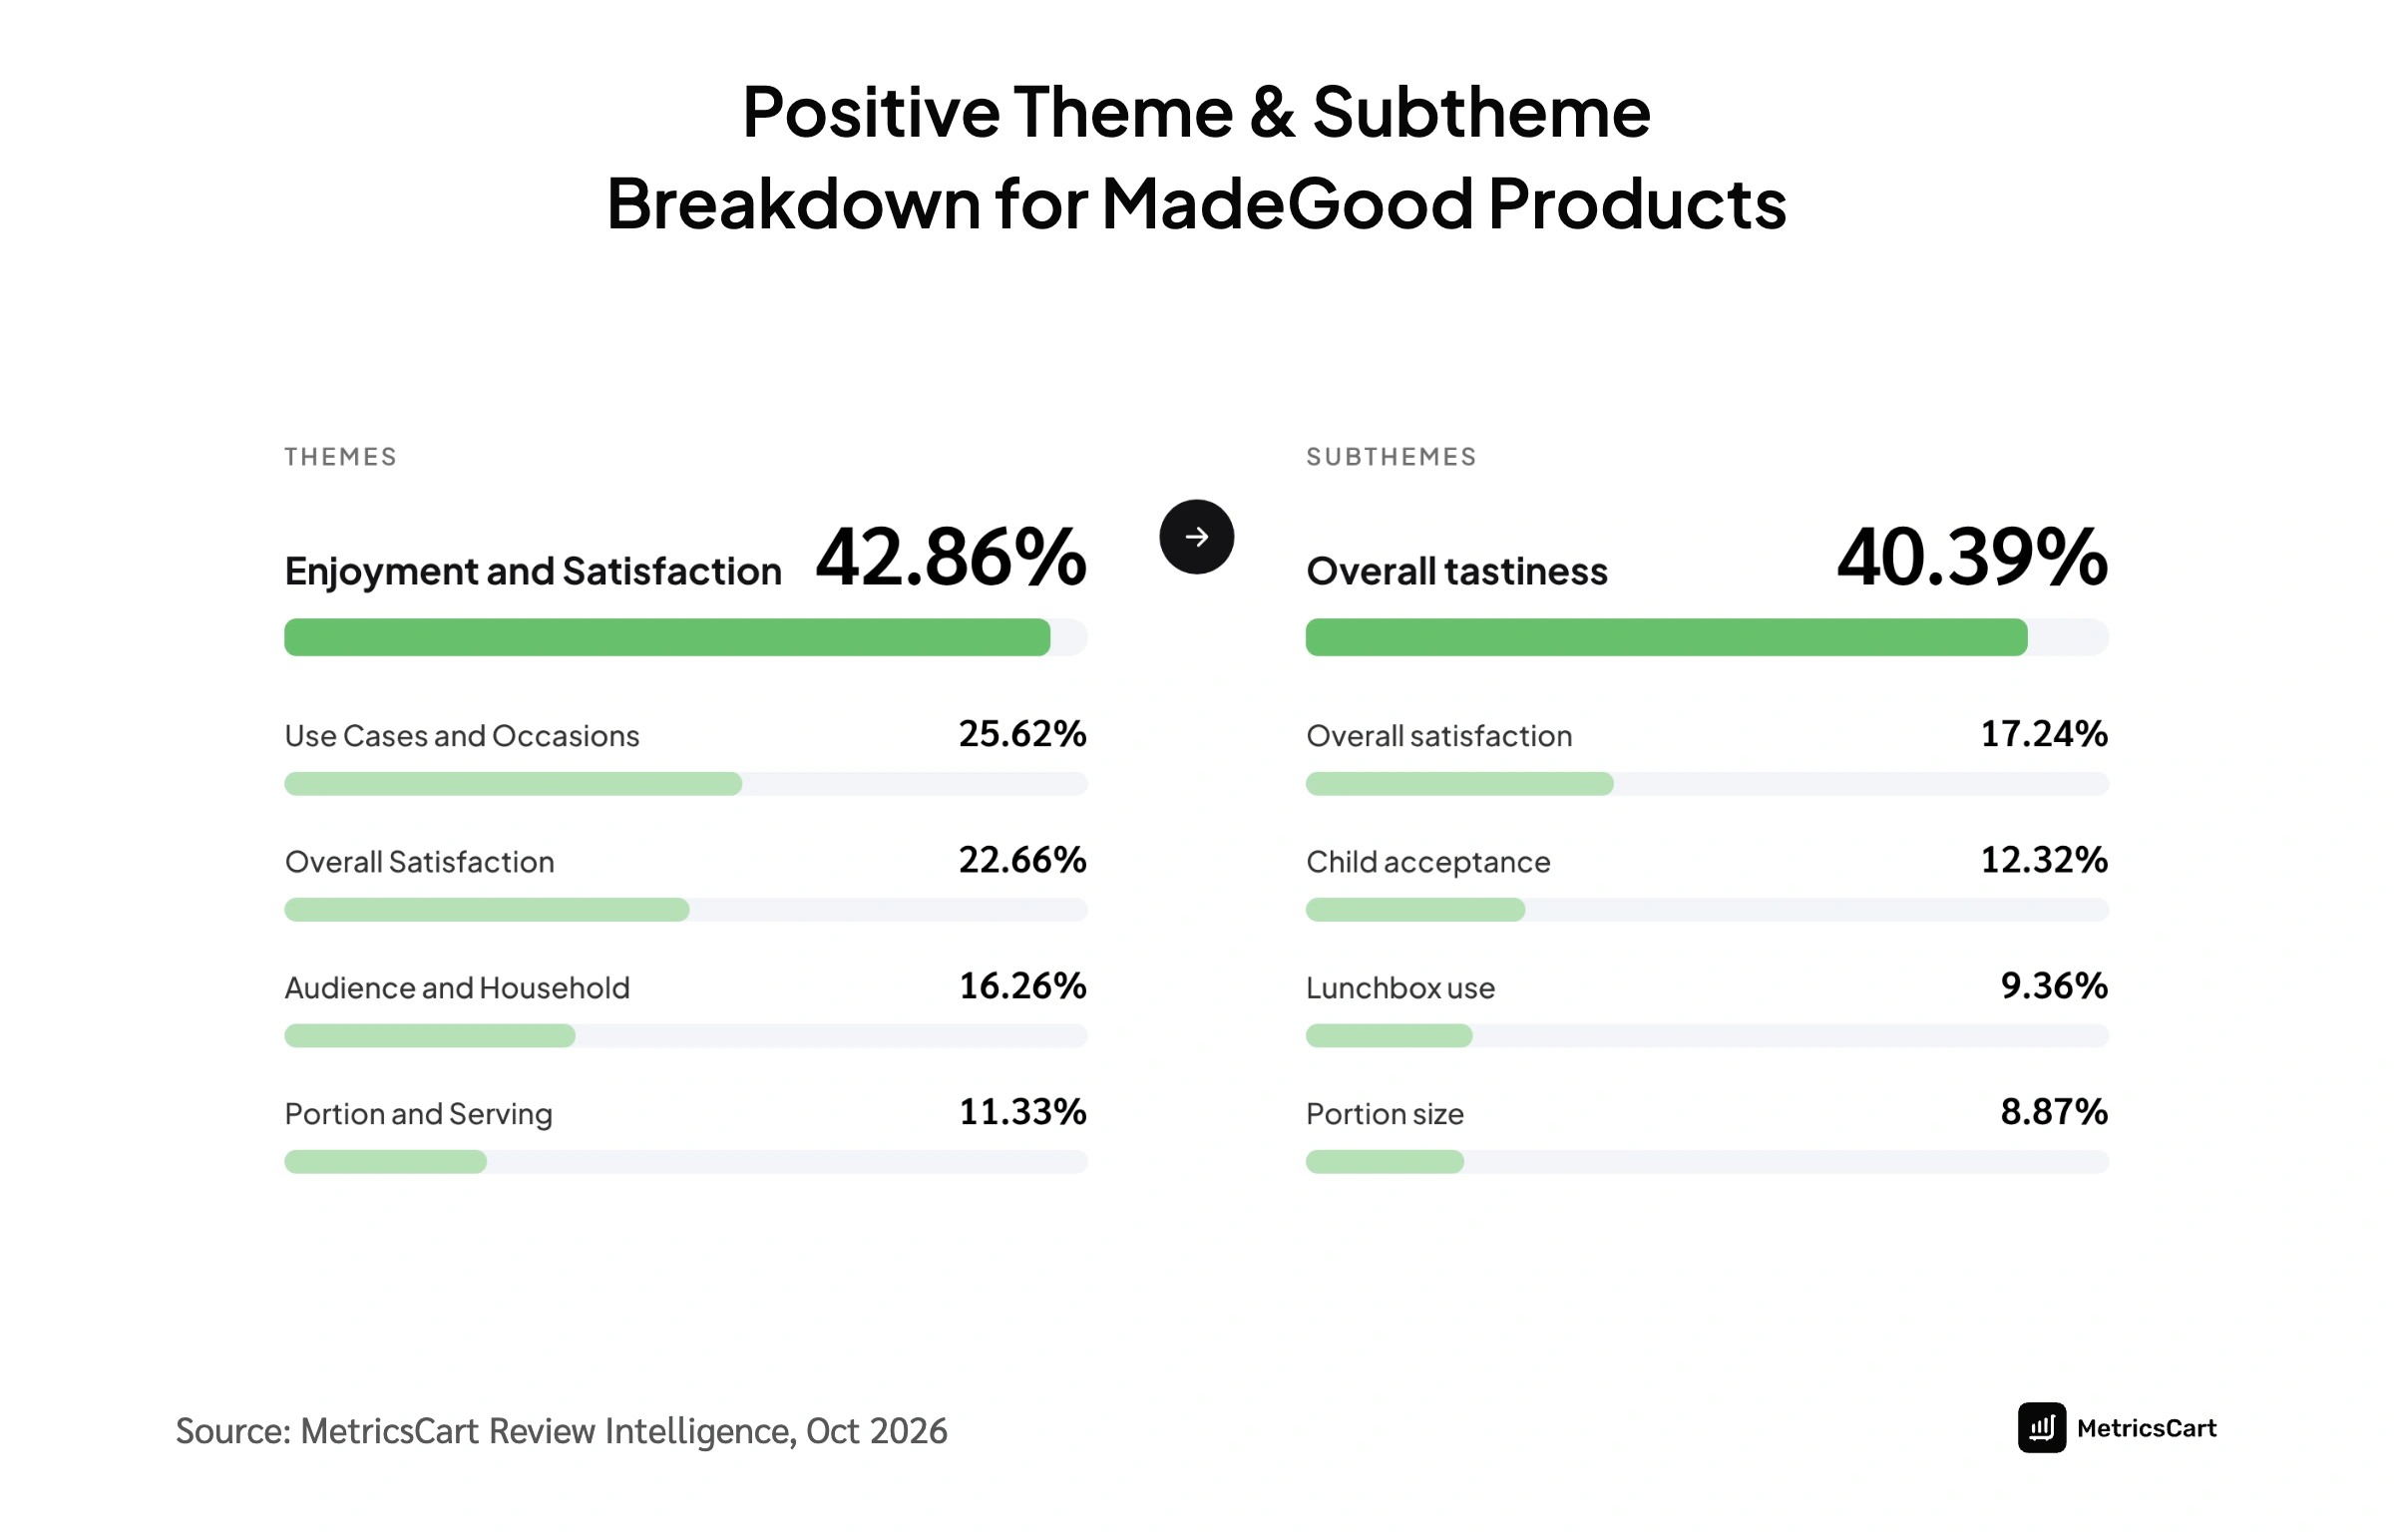
When filtering the positive review cohort across Eating Experience, Usability, Contextual Fit, and Comparative Satisfaction, the insights show that MadeGood’s brand equity remains robust. In allergen-conscious categories, brands often sacrifice taste and mouthfeel to achieve free-from certifications. MadeGood has cracked this balance, turning functional dietary compliance into everyday snacking indulgence.
1. Multi-Generational Household Penetration
While primary packaging and marketing focus heavily on school-aged children, customer verbatims highlight substantial organic adoption across adult and senior demographics looking for clean, low-sugar indulgence:
“These are healthy snacks that are tasty and taste really good with a glass of milk. They’d be great for a kids snack. I’m in my 70’s and always looking for a snack that’s conducive to my heath.”
— Verified Shopper, Walmart.com (5/5 Stars)
“Delicious for any age. They’re delicious and great for any age for anyone that cannot eat gluten”
— Verified Shopper, Amazon.com (5/5 Stars)
This dynamic expands customer lifetime value beyond the primary school years. Shoppers regularly describe MadeGood as an all-family staple rather than just a lunchbox item.
2. High-Fidelity Flavor Delivery
Overall Tastiness represents the single largest positive subtheme, capturing 41.2% of positive discussions. Parents consistently point out that MadeGood avoids the chalky, overly dense texture common in allergen-free baked goods:
“This is a great organic snack for kids and adults. It is healthy and very tasty and minimal sugar. Great to eat alone or add to a cup of yogurt!”
— Verified Shopper, Amazon.com (5/5 Stars)
“Great taste- protein and filling. My go to for snacks and keeping healthy”
— Verified Shopper, Walmart.com (5/5 Stars)
With Child Acceptance at 24.1%, parents celebrate that their children actively request these snacks without feeling like they are eating a dietary substitute.
3. Portion Control and Form-Factor Utility
Pre-portioned packaging solves an everyday friction point for busy households. The individual 6-cookie pouch or granola bite pouch format provides built-in calorie control and on-the-go portability:
“Organic great tasting soft mini cookies; perfect sized snack. Was browsing soft chocolate chip cookies one evening. Love the idea they come in individual packages of six cookies; very tasty, great snack.”
— Verified Shopper, Amazon.com (5/5 Stars)
“Yummy. I love these! They are the perfect bite size. I’m very pleased with the taste and will keep buying them. Yum!”
— Verified Shopper, Amazon.com (5/5 Stars)
Which product attributes drive positive customer reviews for MadeGood snacks across online retailers?
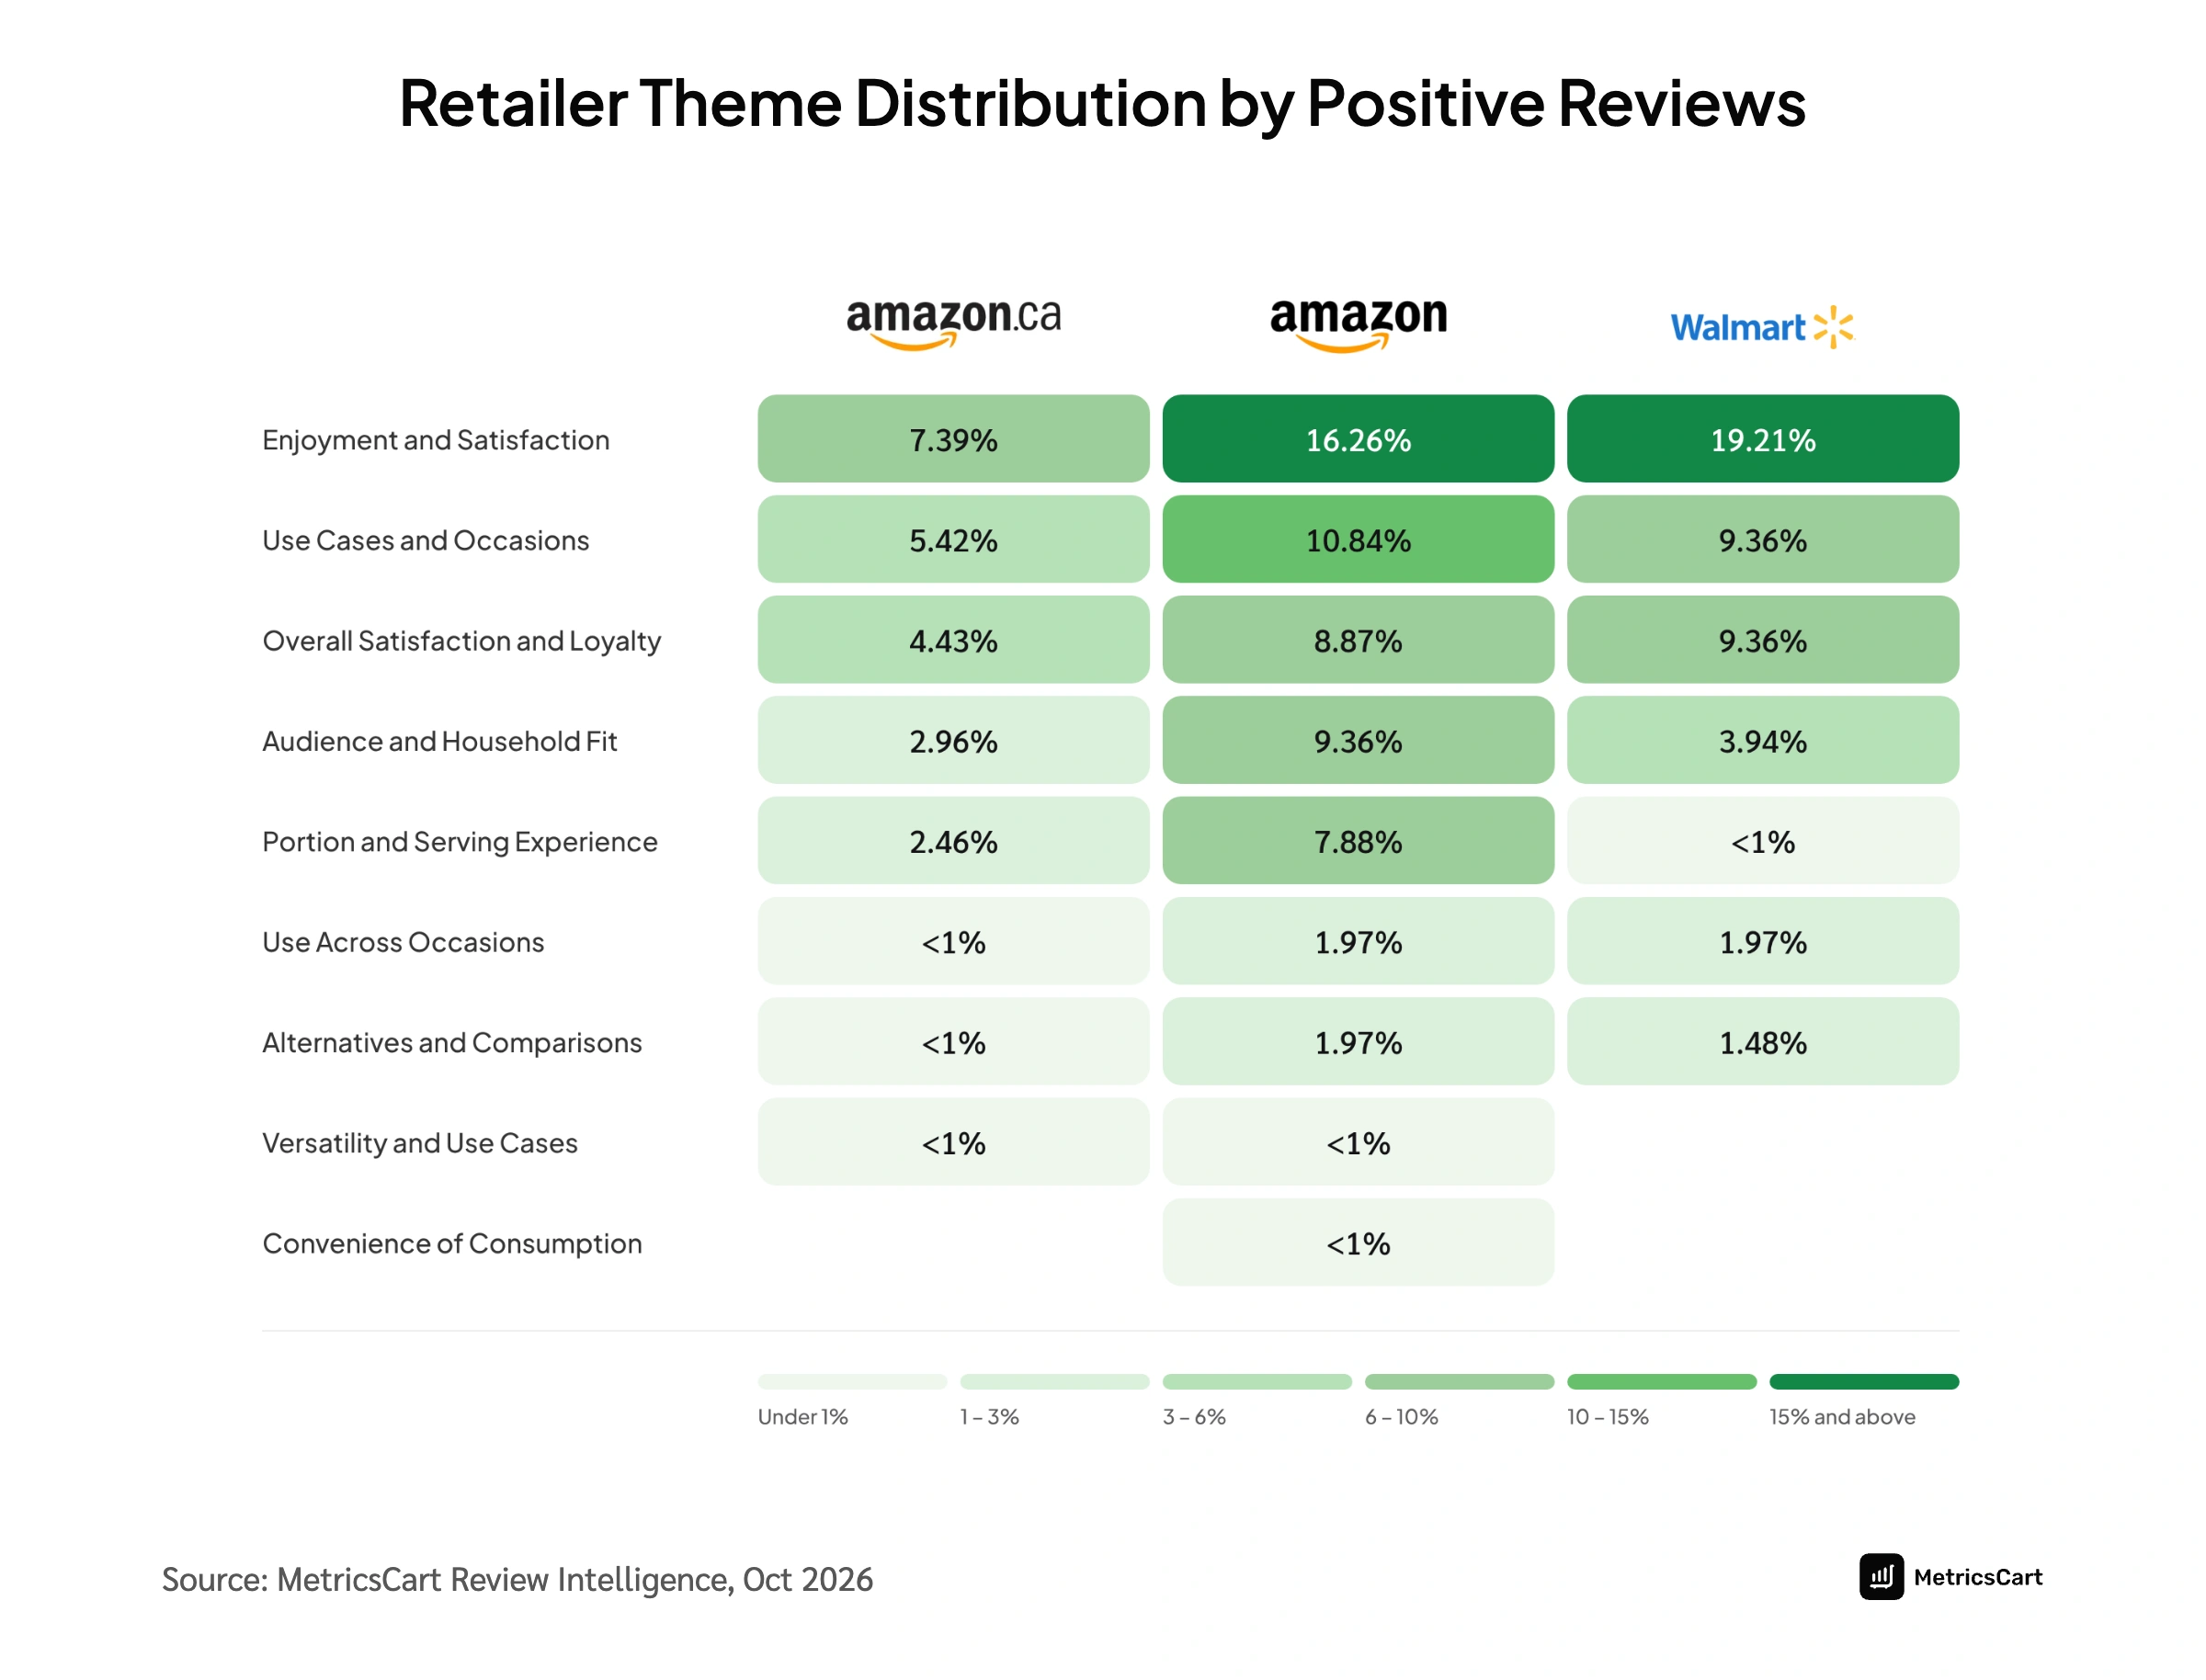
Customer delight for MadeGood is overwhelmingly anchored in taste satisfaction and lifestyle utility rather than pure price or dietary features alone:
- Enjoyment and Satisfaction (Leading Driver): Represents the highest concentration of positive sentiment across all three channels, peaking on Walmart (19.21%) and Amazon US (16.26%), with Amazon CA following at 7.39%. High flavor fidelity and texture satisfaction consistently convert first-time buyers into brand advocates.
- Use Cases & Occasions: Serves as the second largest driver on Amazon US (10.84%) and Walmart (9.36%), driven by school lunchbox convenience and on-the-go snacking utility.
- Overall Satisfaction & Loyalty: Drives significant positive commentary across Walmart (9.36%) and Amazon US (8.87%), highlighting a loyal core customer base that views the product as a household staple.
- Audience & Household Fit: Strongest on Amazon US (9.36%), where multi-pack purchases cater to multi-generational households, allergy-conscious families, and school-aged children alike.
- Portion & Serving Experience: Generates noticeable positive sentiment on Amazon US (7.88%), where pre-portioned single-serve pouches are praised for calorie control and snack portion management.
While allergen-free certifications earn initial consideration, flavor, eating experience, and portion convenience are the core attributes driving 5-star reviews and repeat digital purchases across channels.
Deconstructing the 15.6% Negative Reviews
Understanding why a customer leaves 1 or 2 stars provides direct operational guidance. When isolating the negative review cohort across Eating Experience, Usability, Contextual Fit, and Comparative Satisfaction, the review insights show that negative reviews are rarely about customer service—they are driven by packaging fill, texture degradation, and price-to-volume expectations.
Negative Thematic Drivers (Filtered Cohort Share)
| Theme / Defect Area | Negative Share (%) | Core Failure Mode |
|---|---|---|
| Portion and Serving Experience | ~38.5% | Bag fill volume, crushed crumbs |
| Overall Dissatisfaction / Loyalty | ~31.8% | Repeat intent broken by bad batch |
| Enjoyment and Satisfaction | ~17.1% | Dryness, off-flavors, mouthfeel |
| Audience and Household Fit | ~12.3% | Satiety failure, kid rejection |
| Dietary Experience | ~7.1% | Ingredient aftertaste, sweetness |
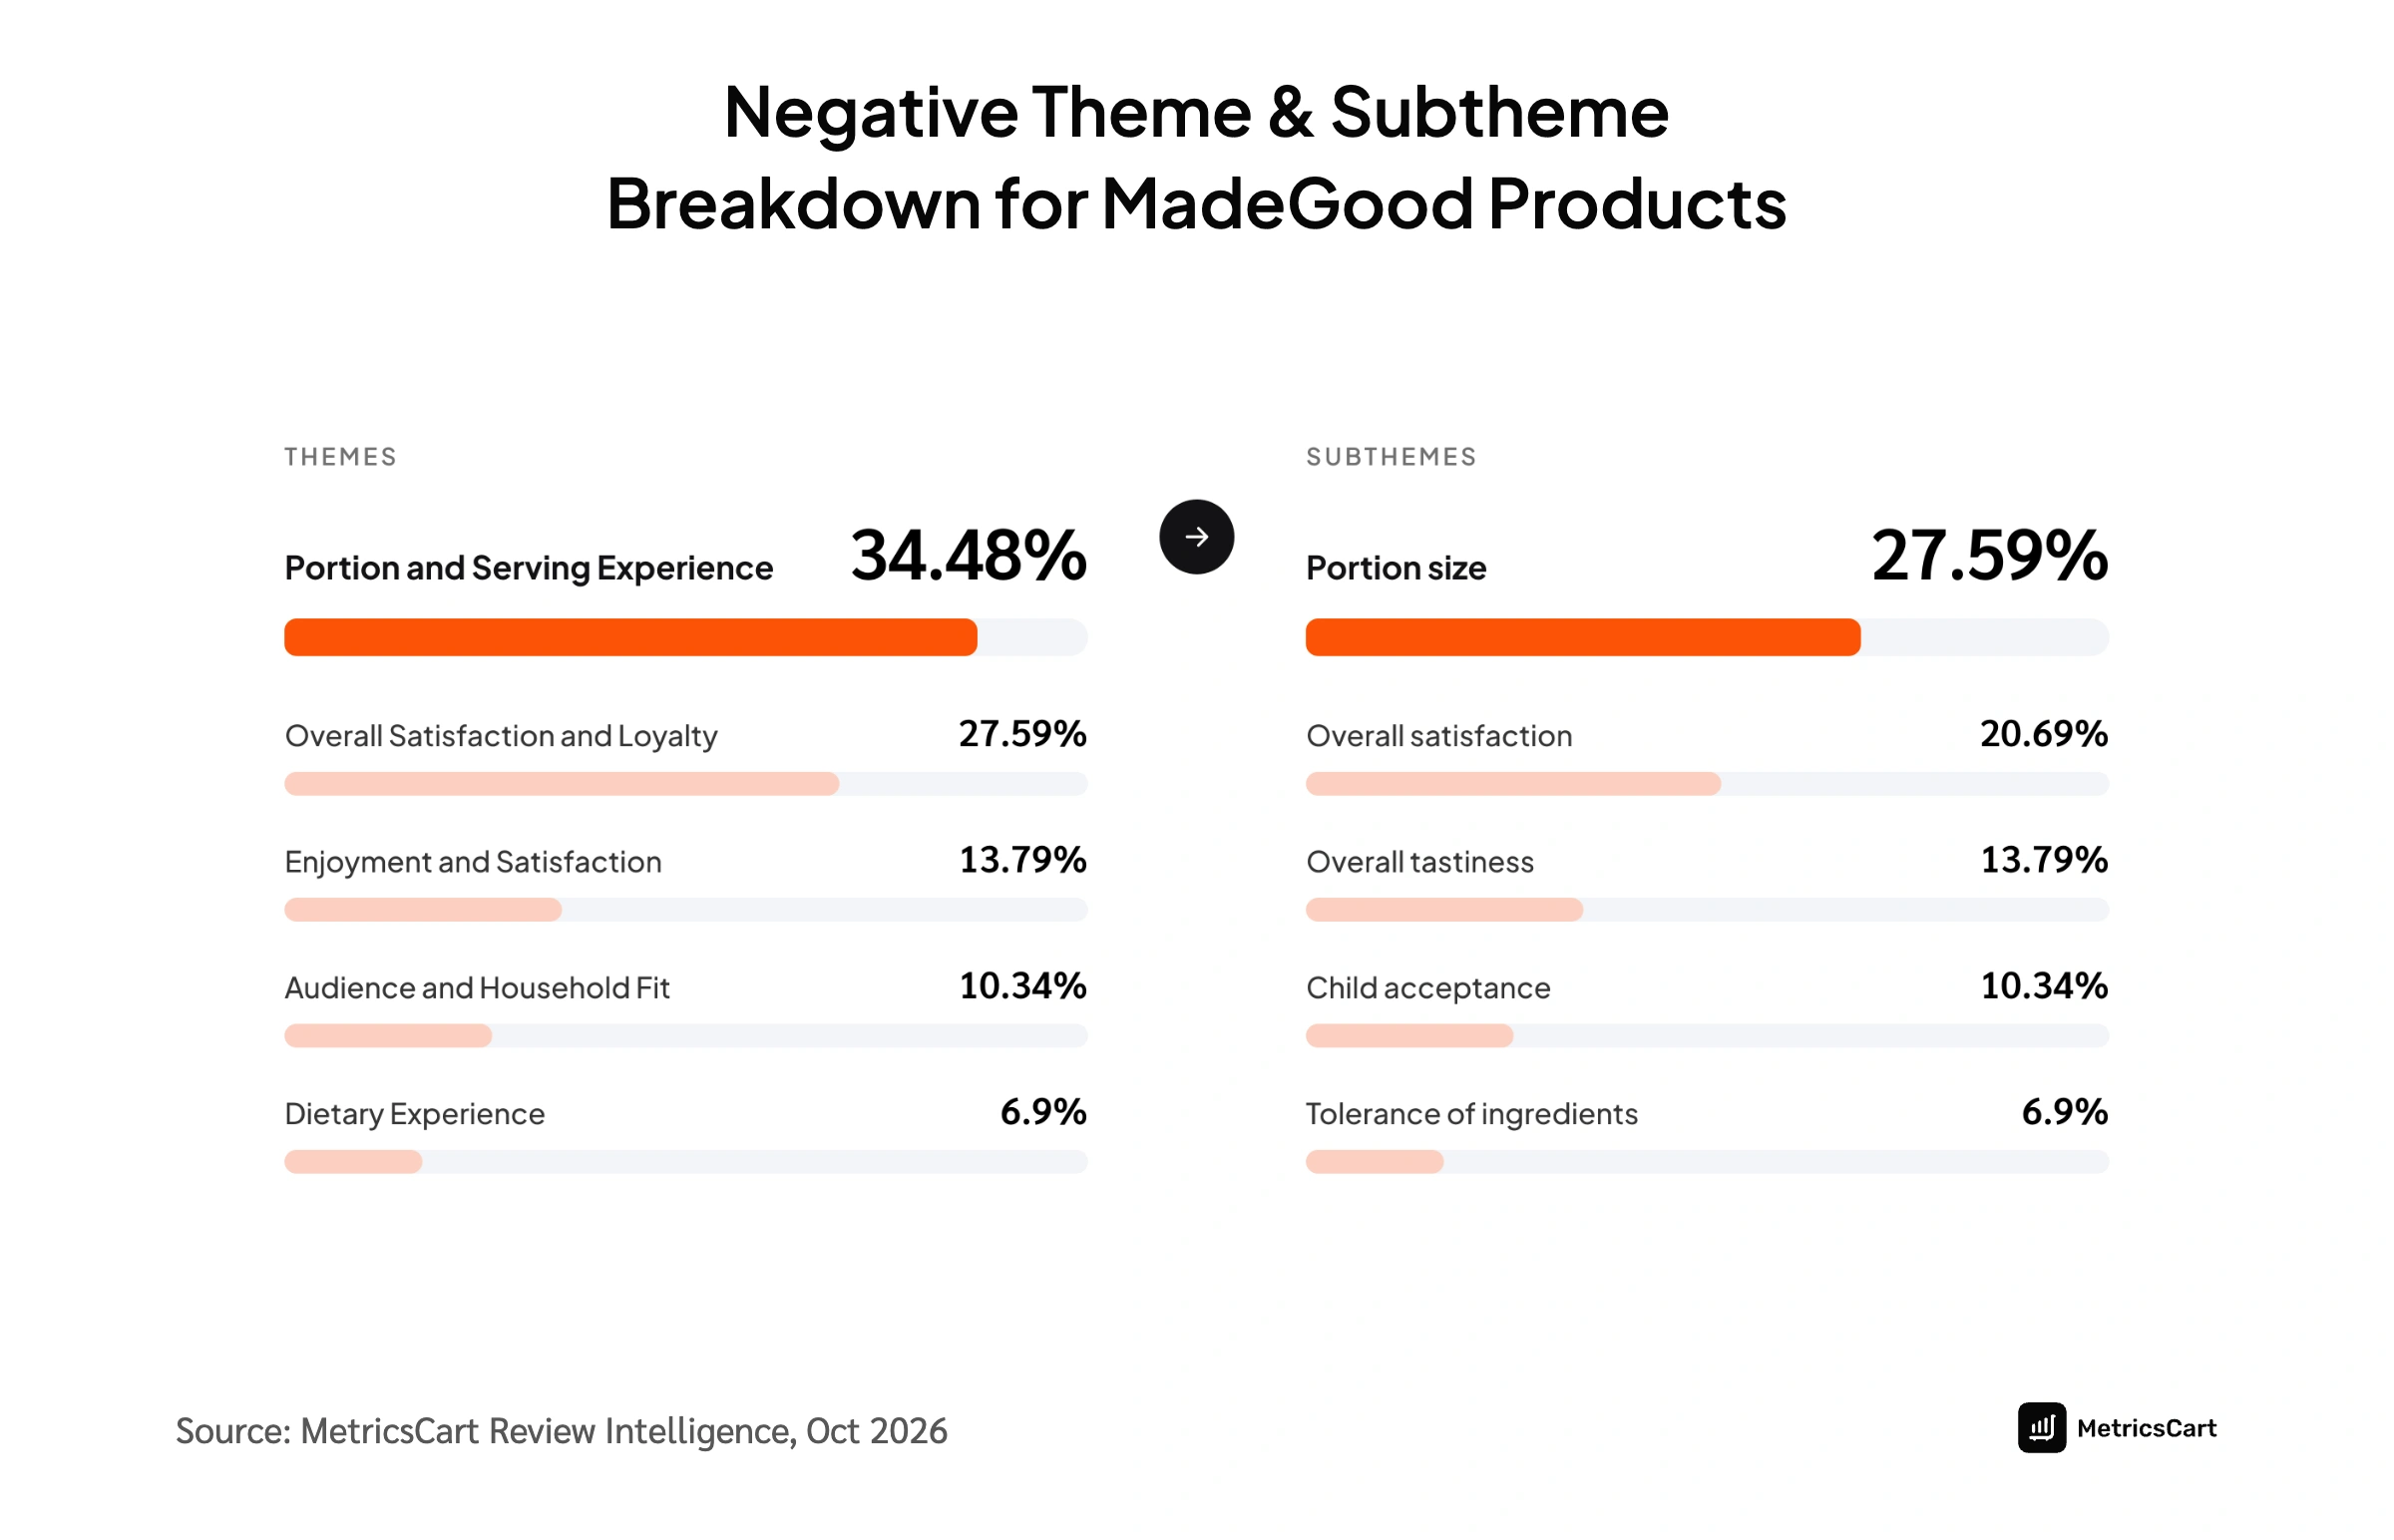
1. The Portion-to-Price Disconnect
Accounting for 34.5% of all negative subtheme commentary, portion size and package fill represent MadeGood’s most acute consumer vulnerability. While shoppers are willing to pay a premium for organic, non-GMO, allergy-safe ingredients, opening a pouch that feels mostly filled with nitrogen air immediately triggers value resentment:
“A little pricey but yummy so good.”
— Verified Shopper, Walmart.com
. If the product arrives intact and fresh, the consumer forgives the price; if there is any defect in texture or transit handling, the rating drops straight from 5 stars to 1 or 2 stars.
2. Physical Crumbling & Transit Breakage
The second major operational failure mode centers on Inconvenience and Crumbling Mess (5.3%) and Softness vs. Hardness Defects (8.6%). Granola bites and mini cookies that lack sufficient structural binder or protective outer corrugate break down during courier handling. Reviewers report opening pouches to find pulverized crumbs rather than intact bites, destroying the utility of clean lunchbox or car snacking.
3. Satiety and Caloric Density
Accounting for 17.8% of negative subtheme commentary, Lack of Satiety is a rising critique among adult snackers. While a 90-to-100 calorie pack is ideal for a toddler or small child, adults using the product as a mid-day work snack or workout supplement find the serving size insufficient to curb hunger, creating friction around everyday utility.
Omnichannel Channel Differences: Amazon US vs. Walmart vs. Amazon CA
Every retailer ecosystem stresses a brand’s fulfillment operations differently. The customer feedback analysis segmentation reveals channel-specific operational priorities:
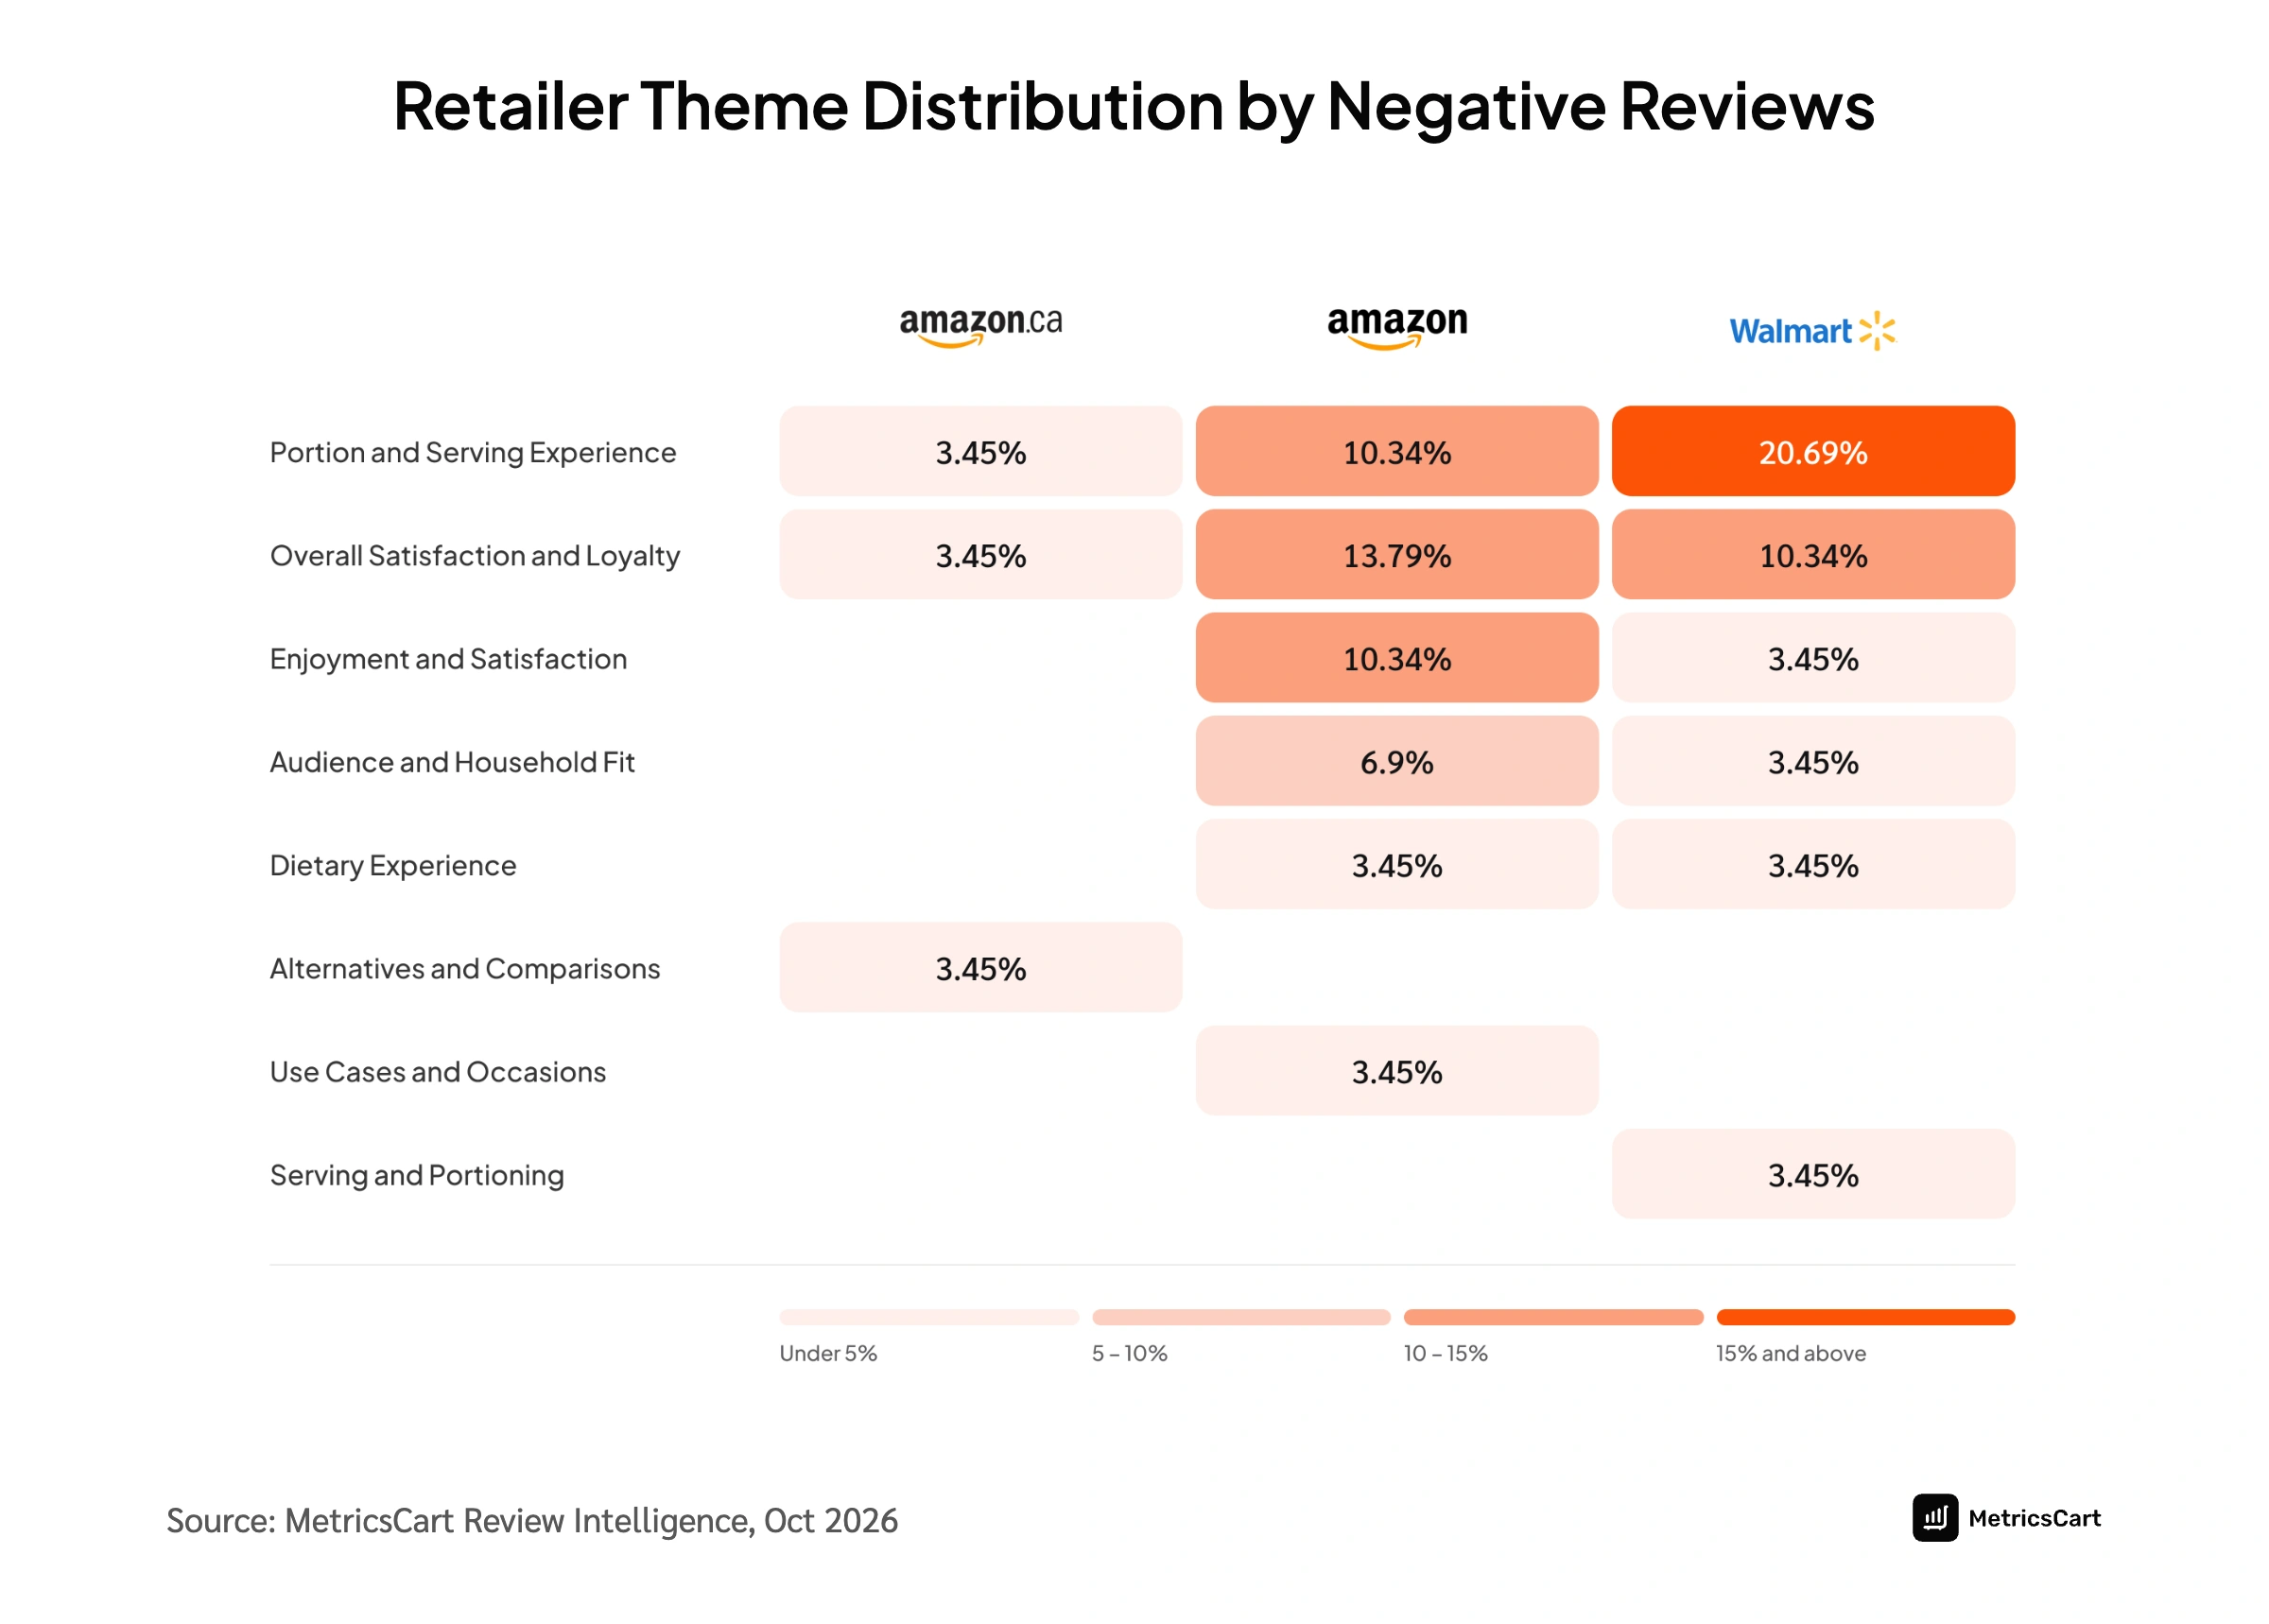
1. Walmart: Freshness Inconsistency and On-Shelf Availability
Scrolling through Walmart review insights, Walmart accounts for the highest single concentration of Portion and Serving Experience negatives (20.69%) and elevated texture complaints. Reviewers frequently flag inconsistent product quality between local store pickup and direct delivery, indicating older stock lingering on regional store shelves.
Crucially, multiple ratings are pulled down purely by inventory stockouts rather than product performance:
“I only gave 4 stars because it’s rarely in stock at the store by us. They are delicious and filling for the mornings!!”
— Verified Shopper, Walmart.com (4/5 Stars)
When out-of-stock friction occurs at the regional store level, it depresses organic search rank and penalizes overall review health.
2. Amazon US: Transit Packaging and Secondary Corrugate
Amazon US reviews accounts for elevated Overall Dissatisfaction (13.79%) and Portion/Serving negatives (10.34%). Multi-pack boxes shipped via FBA show higher rates of crushed interior pouches, pointing to a need for sturdier secondary corrugate and SIOC (Ships in Own Container) testing to withstand conveyor handling.
3. Amazon CA: Stable Quality, Pack Size Demands
The product review analysis on Amazon Canada shows the lowest negative review rates across the portfolio (~3.03% negative share). The primary friction point in the Canadian market centers on assortment variety and bundle size, with consumers asking for higher-count value boxes to offset shipping costs.
Action Plan: What do MadeGood reviews reveal about portion sizes, package fill, and perceived value for money?
If I were sitting down with MadeGood’s brand and digital shelf leads this quarter, here are three operational levers I would pull immediately:
1. Audit Packaging Barrier Integrity on Soft-Baked SKUs
With moisture loss and crumb degradation contributing heavily to negative reviews, barrier film performance requires an engineering review. Evaluating nitrogen-flush levels and seal heat calibrations will protect product integrity during extended warehouse dwell times.
2. Tie Retail Media Spend Directly to Regional In-Stock Rates
With shoppers explicitly citing regional store stockouts at Walmart, running unhedged sponsored product campaigns risks burning ad spend on unfulfillable demand. Implementing automated ad-stock syncing ensures paid retail media automatically pauses when regional fulfillment drops below target thresholds, protecting return on ad spend (ROAS).
3. Calibrate PDP Copy to Manage Expectations
Shoppers expecting a dense, chewy homemade cookie react negatively when receiving a lighter oat bite. Clarifying sensory attributes directly on PDP bullet points, infographics, and A+ content aligns shopper expectations with reality, mitigating negative reviews before purchase.
Monitoring customer reviews is not just about tallying star ratings—it serves as an early-warning radar for formulation, packaging, and supply chain health. For brands scaling across major retail platforms, listening closely to these signals is what protects customer lifetime value and retail shelf dominance over the long term.
These findings were generated using MetricsCart’s Review Monitoring and Voice of Customer (VoC) analytics platform, tracking multi-retailer sentiment, keyword velocity, and rating health across North American e-commerce platforms.