Best Ninja products on Amazon Australia in December 2025
In December 2025, Ninja appeared on Amazon Australia's bestseller lists with 19 unique products across 3 categories. These products appeared in categories including Home, Garden, and Kitchen & Dining. The brand's products on the bestseller lists were priced between $50.00 and $699.99, with an average price of $266.11. These bestselling products maintained an average rating of 4.6 based on 16K total ratings from customers who purchased products that appeared on the bestseller lists.
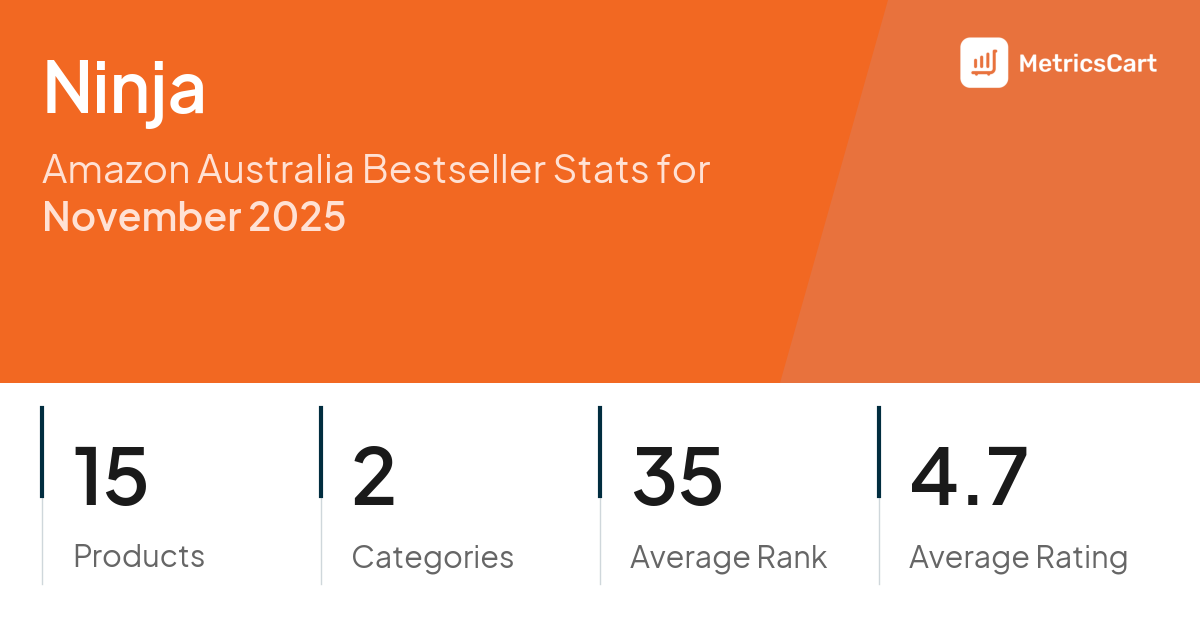
Products
Categories
Average Price
Average Rank
Category Performance
Detailed metrics by category-product count, rank, price, and ratings-offer a quick view of how brands stack up on the Amazon Australia digital shelf.
Considering the data across product categories, the Home category is notable for both its broad product range (15 listings) and excellent customer satisfaction, indicated by an average rating of 4.6 stars. The category with the highest average price is Kitchen & Dining at $637.20.
| Category | Products | Average Rank | Average Price | Rating |
|---|---|---|---|---|
HO | 15 | 46.6 1 — 99 | $224.48 $50 — $479 | 4.6 (16,414 ratings) |
GA | 2 | 44.5 25 — 72 | $484.17 $419 — $589 | 4.5 (36 ratings) |
2 | 62.6 44 — 84 | $637.2 $569 — $699.99 | 4.4 (18 ratings) |
Top Products
The highest-rated product has 4.9 stars, while the lowest has 4.2 stars. In terms of pricing, the most expensive product is $699.99, and the least expensive is $50.00.
Top-ranked products from this brand are shown below, based on performance, pricing, and customer feedback. These Amazon Australia standouts highlight shopper preferences and offer insight into what's driving the brand's success on the digital shelf. The highest average rank is 21.2, and the lowest is 62.8. The highest-rated product has 4.9 stars, while the lowest is 4.3 stars. In terms of pricing, the highest is $452.17, and the lowest is $66.55.
| Product | Average Rank | Average Price | Rating | |
|---|---|---|---|---|
35.6 11 — 77 | $310.38 $299 — $317 | 4.4 (142 ratings) | ||
25.6 1 — 95 | $107 $99 — $115 | 4.7 (301 ratings) | ||
21.2 8 — 47 | $96.5 $89 — $99 | 4.7 (64 ratings) | ||
56.5 12 — 99 | $452.17 $334.99 — $479 | 4.6 (104 ratings) | ||
49 26 — 91 | $144.36 $144 — $149 | 4.9 (84 ratings) | ||
59.4 4 — 94 | $172 | 4.7 (528 ratings) | ||
44.6 25 — 72 | $431.75 $419 — $436 | 4.7 (29 ratings) | ||
62.8 32 — 99 | $66.55 $50 — $79 | 4.3 (345 ratings) | ||
34.3 19 — 58 | $279 | 4.6 (6 ratings) | ||
30 17 — 43 | 4.3 (544 ratings) |
Methodology & Data Attribution
This monthly Amazon Australia Bestseller report is prepared by MetricsCart, a global provider of Digital Shelf Analytics solutions and e-commerce market research. The insights presented are derived from proprietary datasets synthesized from publicly available information across major retail platforms, including Amazon and Walmart. MetricsCart utilizes advanced data modeling to track market trends, price positioning, product listing content gaps, and SERP visibility, providing consumer brands with an objective analysis of their digital performance. This data is intended for informational purposes to help brands optimize their presence on the digital shelf.
Insights in this report were compiled by MetricsCart's data science team to provide transparency into the digital shelf performance of Ninja on amazon.com.au.
Disclaimer: Data on this page is based on publicly available amazon.com.au information and compiled using proprietary analysis. All trademarks and brand names belong to their owners. This report is for informational purposes only and is not endorsed by Amazon Australia or featured brands.
What If You're Missing Something That's Costing You Sales?
With MetricsCart, track and analyze:
- Price movements
- Keyword trends
- MAP violations
- Product listing content
- Customer sentiment
Access everything across Amazon, Walmart, and every other marketplace in one unified view.
See what's powering your category or slowing your brand down and where you're losing revenue.