Best Amazon Brand - Symbol products on Amazon India in February 2026
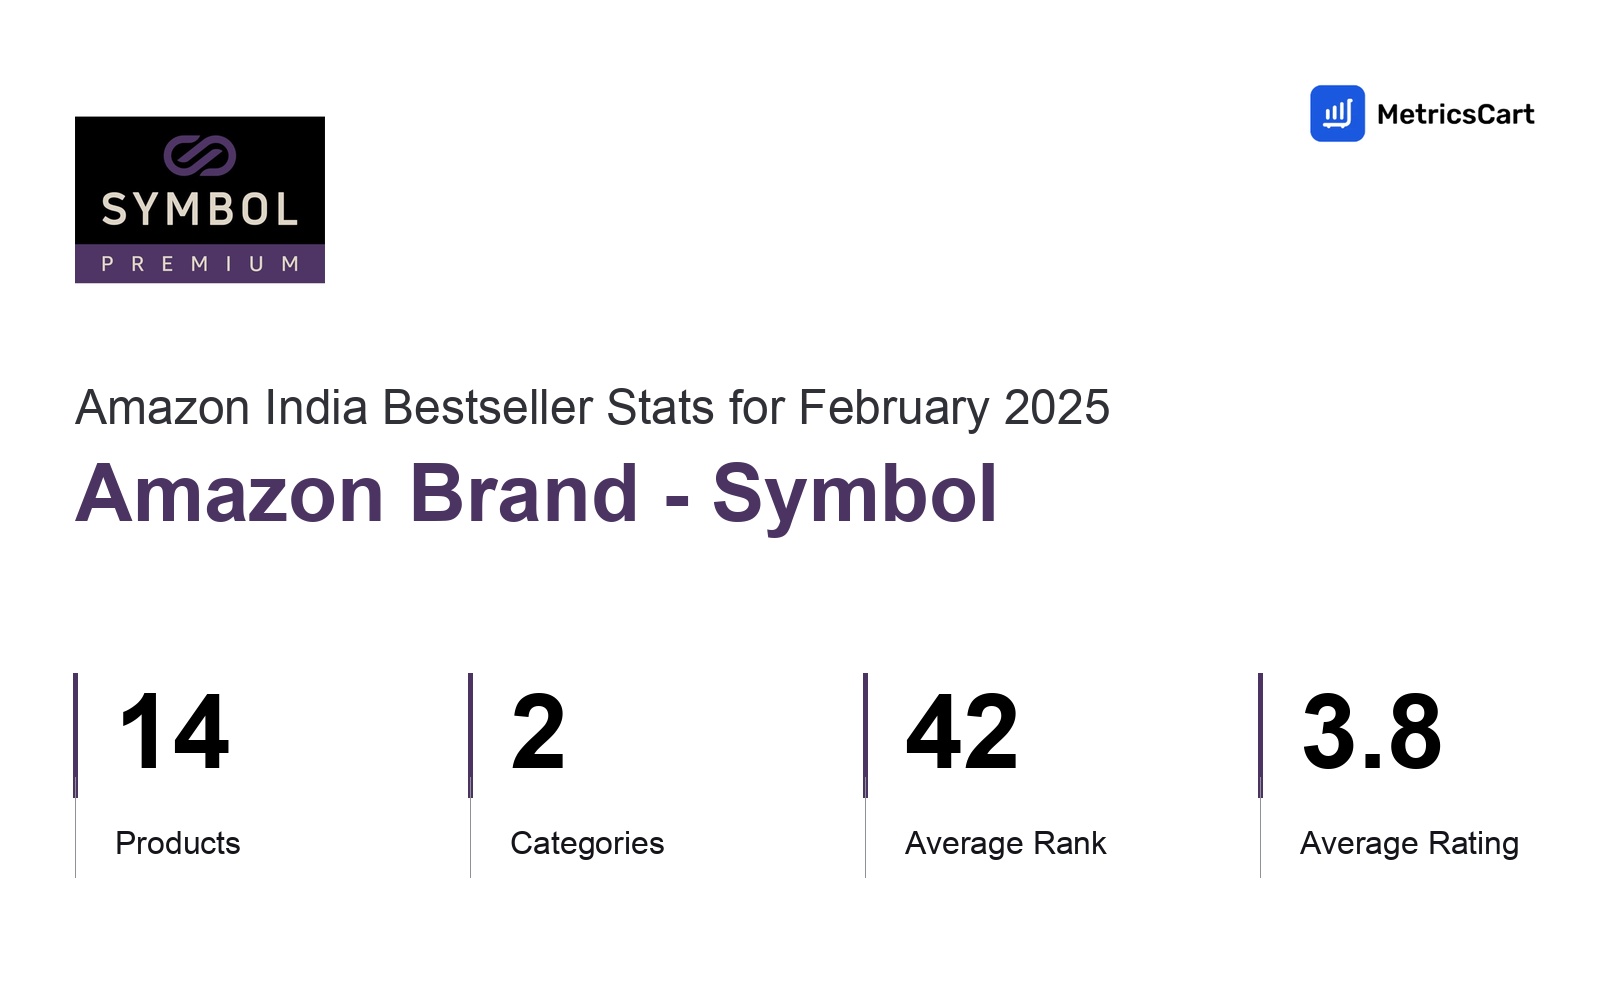
In February 2026, Amazon Brand - Symbol appeared on Amazon India's bestseller lists with 12 unique products across 1 category. These products appeared in the category Clothing & Accessories. The brand's products on the bestseller lists were priced between ₹319.00 and ₹799.00, with an average price of ₹526.97. These bestselling products maintained an average rating of 3.9 based on 204K total ratings from customers who purchased products that appeared on the bestseller lists.
Products
Categories
Average Price
Average Rank
Category Performance
Category metrics such as product count, average rank, price, and customer rating are detailed here. Useful for assessing brand performance on the Amazon India digital shelf.
Considering the data across product categories, the Clothing & Accessories category is a clear leader, exhibiting the highest product volume (12 listings), the highest average price (₹526.97), and the strongest customer ratings (3.9 stars).
| Category | Products | Average Rank | Average Price | Rating |
|---|---|---|---|---|
12 | 53.2 4 — 100 | ₹527 ₹319 — ₹799 | 3.9 (203,769 ratings) |
Top Products
The highest-rated product has 4.0 stars, while the lowest has 3.8 stars. In terms of pricing, the most expensive product is ₹799.00, and the least expensive is ₹319.00.
Overall, the following are the highest-ranked products from this brand, measured by performance, pricing, and customer feedback. As top Amazon India performers, they show what resonates with shoppers and help the brand spot what's working on the digital shelf. The highest average rank is 7.3, and the lowest is 95.9. The highest-rated product has 4.0 stars, while the lowest is 3.8 stars. In terms of pricing, the highest is ₹799.00, and the lowest is ₹319.00.
| Product | Average Rank | Average Price | Rating | |
|---|---|---|---|---|
7.3 4 — 9 | ₹399 | 3.9 (37,976 ratings) | ||
7.4 5 — 9 | ₹399 | 3.9 (37,955 ratings) | ||
53 36 — 76 | ₹549 | 4.0 (10,419 ratings) | ||
55.8 44 — 67 | ₹549 | 4.0 (10,411 ratings) | ||
83.4 68 — 97 | ₹549 | 3.8 (8,389 ratings) | ||
90 74 — 100 | ₹799 | 3.8 (15,748 ratings) | ||
95.9 91 — 99 | ₹319 | 4.0 (19,028 ratings) | ||
78 71 — 86 | ₹799 | 3.8 (15,733 ratings) | ||
95.3 93 — 98 | ₹799 | 3.8 (15,677 ratings) | ||
92 89 — 95 | ₹799 | 3.8 (15,668 ratings) |
About Amazon India Best Seller Category Reports
Our Amazon India Bestseller Brand Monthly Reports track key changes in product performance on the Amazon digital shelf, giving e-commerce teams a clear view of market shifts. Using our machine learning model, we analyze your brand's performance on the Amazon digital shelf, helping you stay ahead. Brands already relying on this information are better equipped to optimize their strategies and improve their competitive positioning.
Disclaimer: Data on this page is based on publicly available amazon.in information and compiled using proprietary analysis. All trademarks and brand names belong to their owners. This report is for informational purposes only and is not endorsed by Amazon India or featured brands.
What If You're Missing Something That's Costing You Sales?
With MetricsCart, track and analyze:
- Price movements
- Keyword trends
- MAP violations
- Product listing content
- Customer sentiment
Access everything across Amazon, Walmart, and every other marketplace in one unified view.
See what's powering your category or slowing your brand down and where you're losing revenue.