Bestselling Amazon Devices & Accessories brands on Amazon Saudi Arabia in September 2026
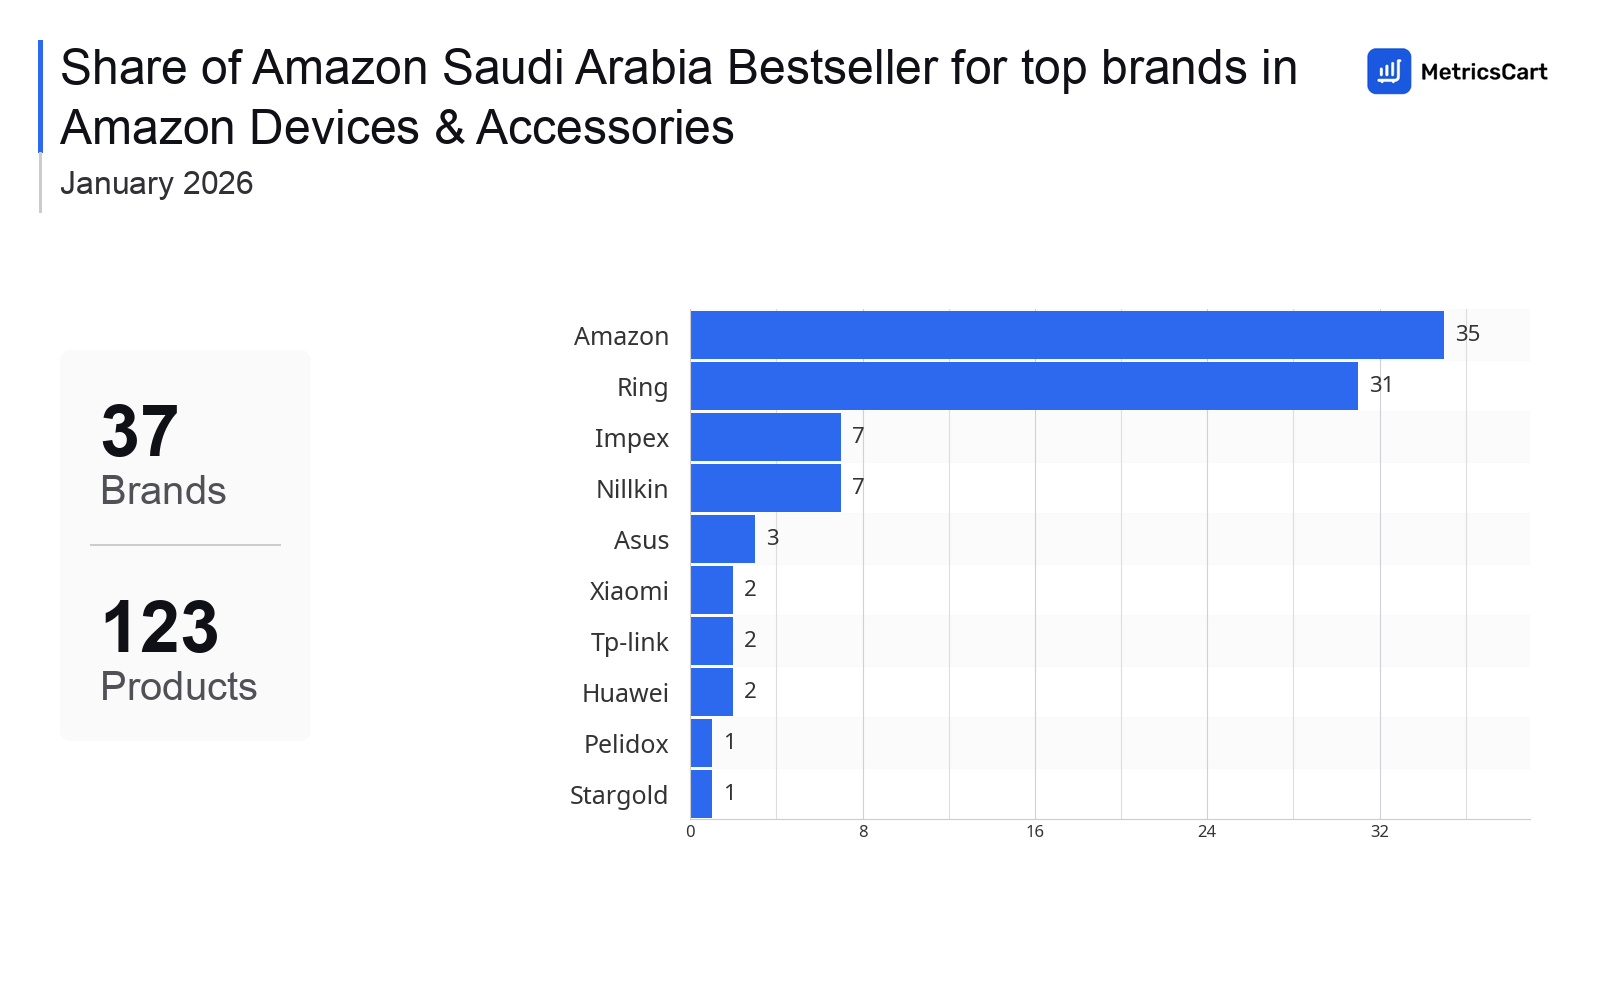
In September 2026, Amazon Saudi Arabia's bestseller list for the Amazon Devices & Accessories category showcased 88 unique products from 9 different brands. Top brands among the bestsellers included Amazon (41 products, 46.6% share), Ring (39 products, 44.3% share), and Aobocam (1 product, 1.1% share). The prices of these bestselling products ranged from SAR 59.00 to SAR 4,048.79, with an average price of SAR 438.47. Most bestsellers were priced in the SAR 59.00-SAR 400.00 range.
Products
Brands
Average Price
Top Brands
Key insights into the top-performing brands include Amazon, featuring 41 unique products, offered bestsellers priced from SAR 79.00 to SAR 1,249.00, with an average price of SAR 370.41. It held a 46.6% share of the bestseller list and garnered an average rating of 4.4 stars from 121K reviews. With a selection of 39 unique products, Ring's bestsellers ranged in price from SAR 59.00 to SAR 1,299.00, averaging SAR 434.68. The brand's share of the bestseller list was 44.3%, with an average rating of 4.1 stars based on 20K reviews. Aobocam captured a 1.1% share of the bestseller list with 1 unique product. Its bestsellers had prices ranging from SAR 170.00 to SAR 170.00, with an average of SAR 170.00, and an average rating of 3.9 stars from 852 reviews.
Top Products
The highest-rated product has 5.0 stars, while the lowest has 1.0 stars. In terms of pricing, the most expensive product is SAR 4,048.79, and the least expensive is SAR 59.00.
Overall, the following are the highest-ranked products in the category, measured by performance, pricing, and customer feedback. As top Amazon Saudi Arabia bestsellers, they show what resonates with shoppers and help brands spot what's working on the digital shelf. The highest average rank is 1.2, and the lowest is 10.9. The highest-rated product has 4.7 stars, while the lowest is 3.4 stars. In terms of pricing, the highest is SAR 1,194.99, and the lowest is SAR 114.00.
| Product | Average Rank | Average Price | Rating | |
|---|---|---|---|---|
1.2 1 — 3 | SAR 299 | 4.6 (31,694 ratings) | ||
1.8 1 — 3 | SAR 384.99 | 4.6 (3,262 ratings) | ||
3.8 3 — 5 | SAR 749 SAR 549 — SAR 949 | 4.6 (14,830 ratings) | ||
4.2 2 — 7 | SAR 114 SAR 79 — SAR 149 | 3.9 (256 ratings) | ||
5.3 2 — 12 | SAR 999 SAR 749 — SAR 1,249 | 4.5 (3,883 ratings) | ||
7.7 5 — 11 | SAR 524.99 | 4.4 (407 ratings) | ||
9.3 5 — 15 | SAR 159 | 4.7 (15,365 ratings) | ||
9.3 5 — 15 | SAR 249 SAR 199 — SAR 299 | 4.1 (66 ratings) | ||
10.9 6 — 17 | SAR 574.99 | 3.4 (43 ratings) | ||
6.5 4 — 10 | SAR 1,194.99 | 4.2 (70 ratings) |
Methodology & Data Attribution
This monthly Amazon Saudi Arabia Bestseller report is prepared by MetricsCart, a global provider of Digital Shelf Analytics solutions and e-commerce market research. The insights presented are derived from proprietary datasets synthesized from publicly available information across major retail platforms, including Amazon and Walmart. MetricsCart utilizes advanced data modeling to track market trends, price positioning, product listing content gaps, and SERP visibility, providing consumer brands with an objective analysis of their digital performance. This data is intended for informational purposes to help brands optimize their presence on the digital shelf.
Insights in this report were compiled by MetricsCart's data science team to provide transparency into the digital shelf performance of Amazon Devices & Accessories category on amazon.sa.
Disclaimer: Data on this page is based on publicly available amazon.sa information and compiled using proprietary analysis. All trademarks and brand names belong to their owners. This report is for informational purposes only and is not endorsed by Amazon Saudi Arabia or featured brands.
What If You're Missing Something That's Costing You Sales?
With MetricsCart, track and analyze:
- Price movements
- Keyword trends
- MAP violations
- Product listing content
- Customer sentiment
Access everything across Amazon, Walmart, and every other marketplace in one unified view.
See what's powering your category or slowing your brand down and where you're losing revenue.