Best Ozark Trail products on Walmart in February 2026
In February 2026, Ozark Trail appeared on Walmart's bestseller lists with 61 unique products across 3 categories. These products appeared in categories including Sports & Outdoors, Toys, and Fashion. The brand's products on the bestseller lists were priced between $0.54 and $398.00, with an average price of $40.45. These bestselling products maintained an average rating of 4.4 based on 119K total ratings from customers who purchased products that appeared on the bestseller lists.
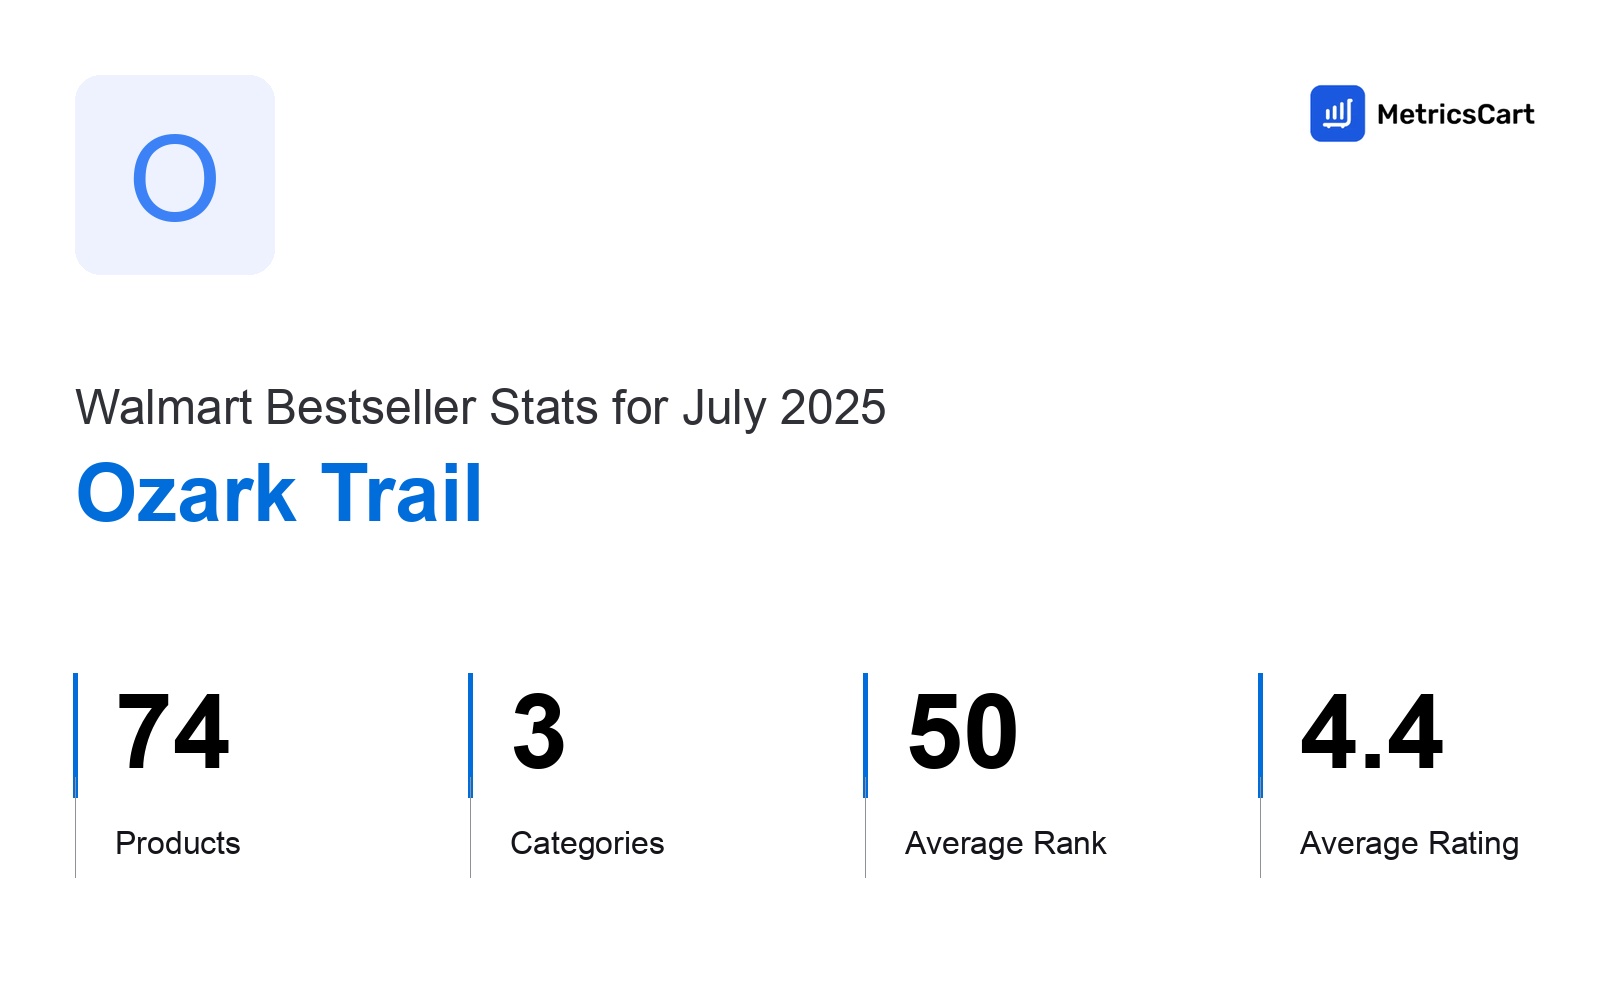
Products
Categories
Average Price
Average Rank
Category Performance
Category metrics such as product count, average rank, price, and customer rating are detailed here. Useful for assessing brand performance on the Walmart digital shelf.
From a category performance analysis, while the Sports & Outdoors category offers the largest variety of products (57 listings), the Toys category demonstrates superior performance in both average pricing ($281.68) and customer ratings (4.5 stars).
| Category | Products | Average Rank | Average Price | Rating |
|---|---|---|---|---|
57 | 49.9 1 — 100 | $30.82 $0.54 — $245 | 4.4 (115,957 ratings) | |
FA | 1 | 52.7 30 — 83 | $24.99 | 4.4 (1,658 ratings) |
TO | 3 | 72.2 41 — 93 | $281.68 $19.96 — $398 | 4.5 (958 ratings) |
Top Products
The highest-rated product has 4.9 stars, while the lowest has 3.9 stars. In terms of pricing, the most expensive product is $398.00, and the least expensive is $0.54.
Top-ranked products from this brand are shown below, based on performance, pricing, and customer feedback. These Walmart standouts highlight shopper preferences and offer insight into what's driving the brand's success on the digital shelf. The highest average rank is 28.5, and the lowest is 51.7. The highest-rated product has 4.6 stars, while the lowest is 4.0 stars. In terms of pricing, the highest is $162.50, and the lowest is $1.97.
| Product | Average Rank | Average Price | Rating | |
|---|---|---|---|---|
33.2 2 — 89 | $22.44 | 4.4 (4,063 ratings) | ||
28.5 17 — 55 | $9.97 | 4.5 (22,171 ratings) | ||
38.5 2 — 92 | $10.39 $10.32 — $10.68 | 4.6 (9,573 ratings) | ||
37.2 23 — 51 | $19.44 | 4.0 (4,350 ratings) | ||
46.6 7 — 86 | $10.88 | 4.6 (2,322 ratings) | ||
46 5 — 96 | $1.98 | 4.4 (1,227 ratings) | ||
51.7 1 — 99 | $1.97 | |||
50.6 3 — 93 | $48.76 | 4.6 (2,400 ratings) | ||
46.3 2 — 93 | $1.97 | 4.6 (2,587 ratings) | ||
40.9 19 — 69 | $162.5 $150 — $175 | 4.2 (1,769 ratings) |
About Walmart Best Seller Category Reports
Our Walmart Bestseller Brand Monthly Reports track key changes in product performance on the Walmart digital shelf, giving e-commerce teams a clear view of market shifts. Using our machine learning model, we analyze your brand's performance on the Walmart digital shelf, helping you stay ahead. Brands already relying on this information are better equipped to optimize their strategies and improve their competitive positioning.
Disclaimer: Data on this page is based on publicly available walmart.com information and compiled using proprietary analysis. All trademarks and brand names belong to their owners. This report is for informational purposes only and is not endorsed by Walmart or featured brands.
What If You're Missing Something That's Costing You Sales?
With MetricsCart, track and analyze:
- Price movements
- Keyword trends
- MAP violations
- Product listing content
- Customer sentiment
Access everything across Amazon, Walmart, and every other marketplace in one unified view.
See what's powering your category or slowing your brand down and where you're losing revenue.