Blinkit controls nearly half of India’s quick commerce market, holding a 44% share, making it the key battleground for CPG brands, retailers, and D2C players.
To compete effectively, brands need more than shelf presence. They need real-time visibility into market trends and a data-driven action plan. That’s where a Blinkit price tracker comes in. It helps teams track price fluctuations, discounts, and stock levels live and develop a retail strategy that aligns with the 10-minute delivery standard.
However, with multiple tools available on the market, which one should you use? And more importantly, how do you turn that data into results? This article answers it all.
3 Best Blinkit Price Tracker Tools
Blinkit price monitoring tools aren’t just about scraping numbers. The best ones offer real-time, actionable insights that help you stay competitive. Here are the three best Blinkit price tracker tools worth considering:
1. MetricsCart
![]()
MetricsCart offers a quick commerce dashboard built specifically to monitor platforms like Blinkit, Zepto, and Instamart. It goes beyond surface-level tracking and provides brand and category managers with a comprehensive view of what’s happening on the shelf in real-time.
Here’s what it offers:
- Real-Time Product-Level Pricing: Monitor live price changes across your SKUs and your competitors’. See average prices, price ranges, and SKU-specific fluctuations, updated every 10 seconds.
- Discount Patterns: Track how discounts are distributed across Blinkit. Identify top discounted products, average markdowns, and where your pricing stands in the promo landscape.
- Stock Availability: See which products are unavailable and how that impacts category performance. Prevent lost sales and act before gaps become problems.
- Category-Wide Pricing Insights: Understand average and median prices across each category. Use this to benchmark your product range and find underpriced or untapped segments.
- Brand-Level Price Insights: Compare how your brand stacks up against competitors. Analyze SKU count, average pricing, and discount strategies to identify gaps or risks.
- Historical Pricing Trends: See how prices, discounts, and stock levels have changed over time..
- City-Level Data: Hyper-local, city-specific data so you can tailor pricing, availability, and campaigns based on regional patterns.
Best for: CPG brands, D2C players, and brand manufacturers managing a large number of SKUs or selling across multiple cities on an enterprise level.

2. 42Signals
42Signals offers competitive intelligence across e-commerce and quick commerce platforms, including Blinkit. Its Blinkit module focuses on high-level analytics and brand monitoring.
Key features include:
- SKU-level price and discount tracking
- Brand and category benchmarking
- Marketplace movement insights
While useful, it may lack the hyperlocal stock data or real-time refresh rates needed for day-to-day optimization.
Best for: Brands looking for broad market trends and competitive benchmarking, but not granular SKU management.
3. GobbleCube
GobbleCube is an AI‑powered revenue and growth platform built primarily for CPG brands operating across e‑commerce and quick commerce ecosystems.
Key features include:
- Real-time SKU-level pricing and stock tracking across Blinkit and other platforms.
- Hyperlocal insights to detect issues and optimize performance city by city.
- Root-cause analytics that explain dips in sales, visibility, or share.
- Competitor benchmarking based on pricing, discounts, and SKU coverage.
Best for: CPG brands, D2C startups, and category managers who want automated, hyperlocal, and actionable insights.
How to Use Blink Price Tracker to Succeed in Quick Commerce
You may know how to track prices on Blinkit using a tracker. But to win in quick commerce, you must translate those insights into action. Here’s how you can do it.
Understand Competitive Positioning
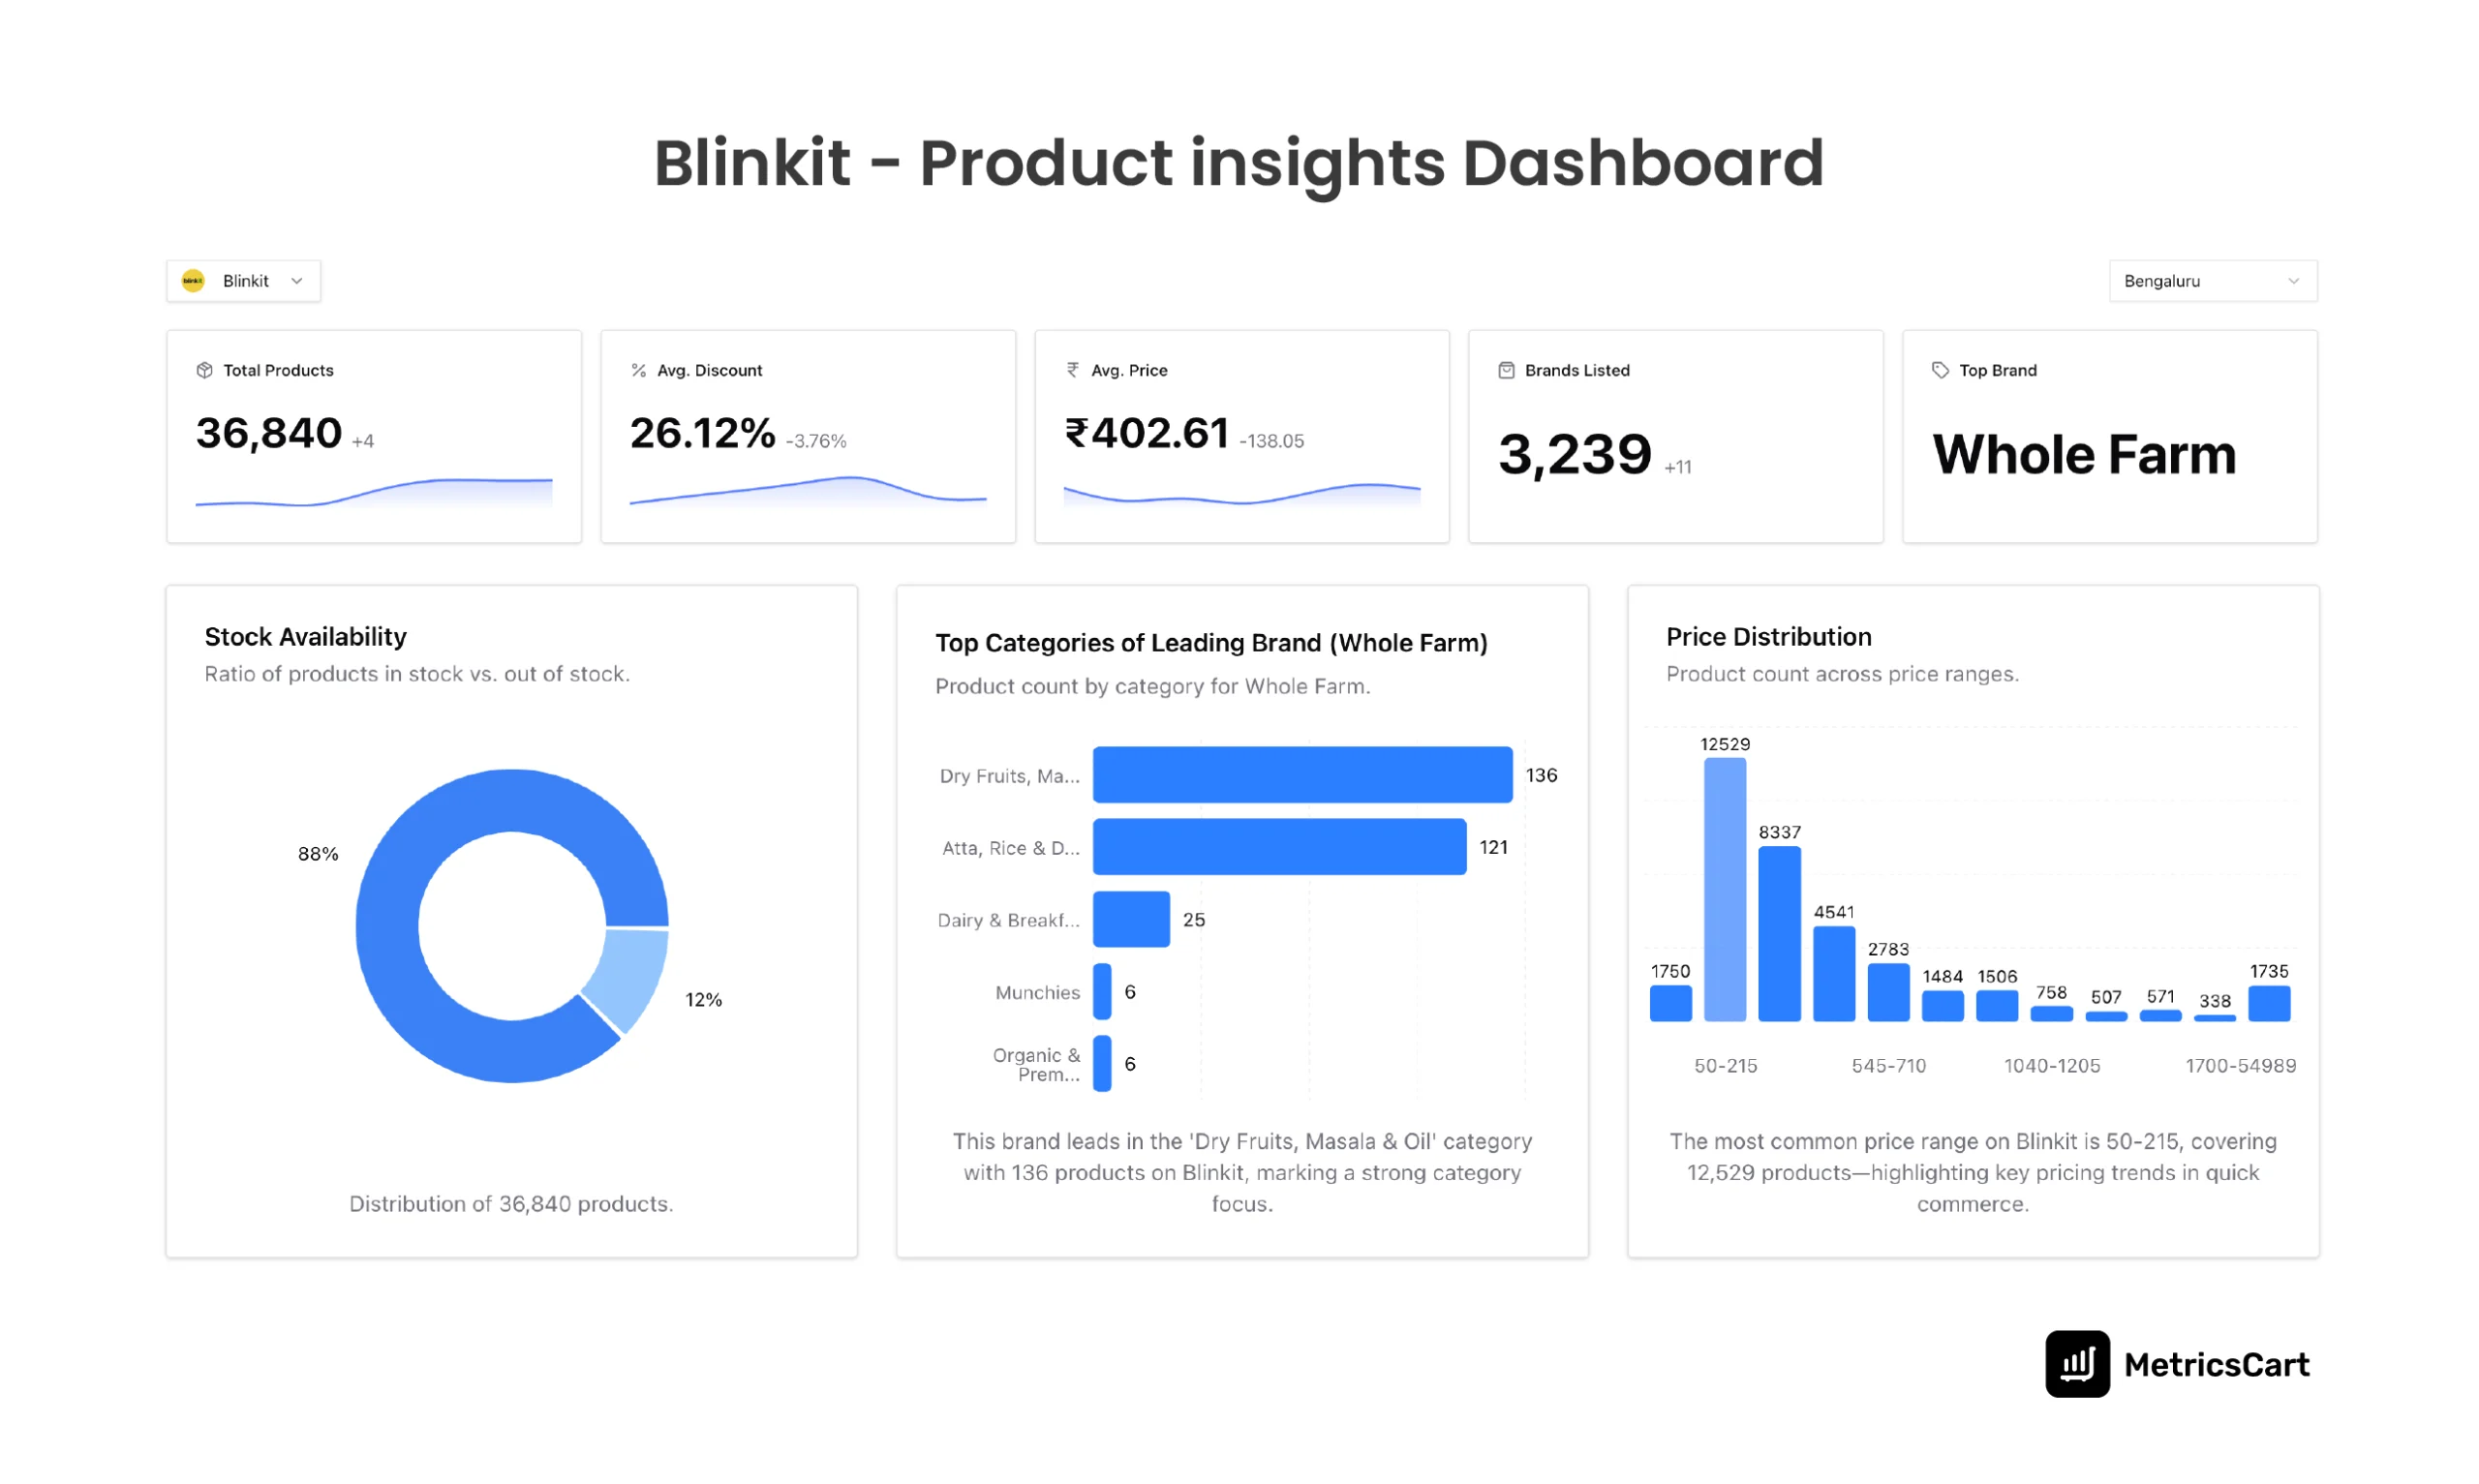
The MetricsCart Blinkit price tracker dashboard opens with high-level metrics: the total number of SKUs listed, average product price, average discount, the number of brands operating on the platform, and the top-performing brand. This data is updated every 10 seconds, giving you real-time insights into the market.
Suppose your product is priced significantly above the city’s average. In that case, you may think it reflects premium positioning. But in a market that changes daily, it may also be the reason you’re getting outperformed.
MetricsCart helps you compare your SKUs’ pricing with average category and city-level price data. Say the average price across Bengaluru is ₹440, and your SKU is listed at ₹525. If a competitor drops their price to ₹399, you’re immediately alerted.
You can choose to match the price, promote your premium benefits, or introduce a lower-tier variant to hold your spot on the shelf.
Optimize Inventory and Stock Availability
Stockouts are easy to miss until it’s too late. MetricsCart gives you a stock availability ratio and live SKU-level status by city.
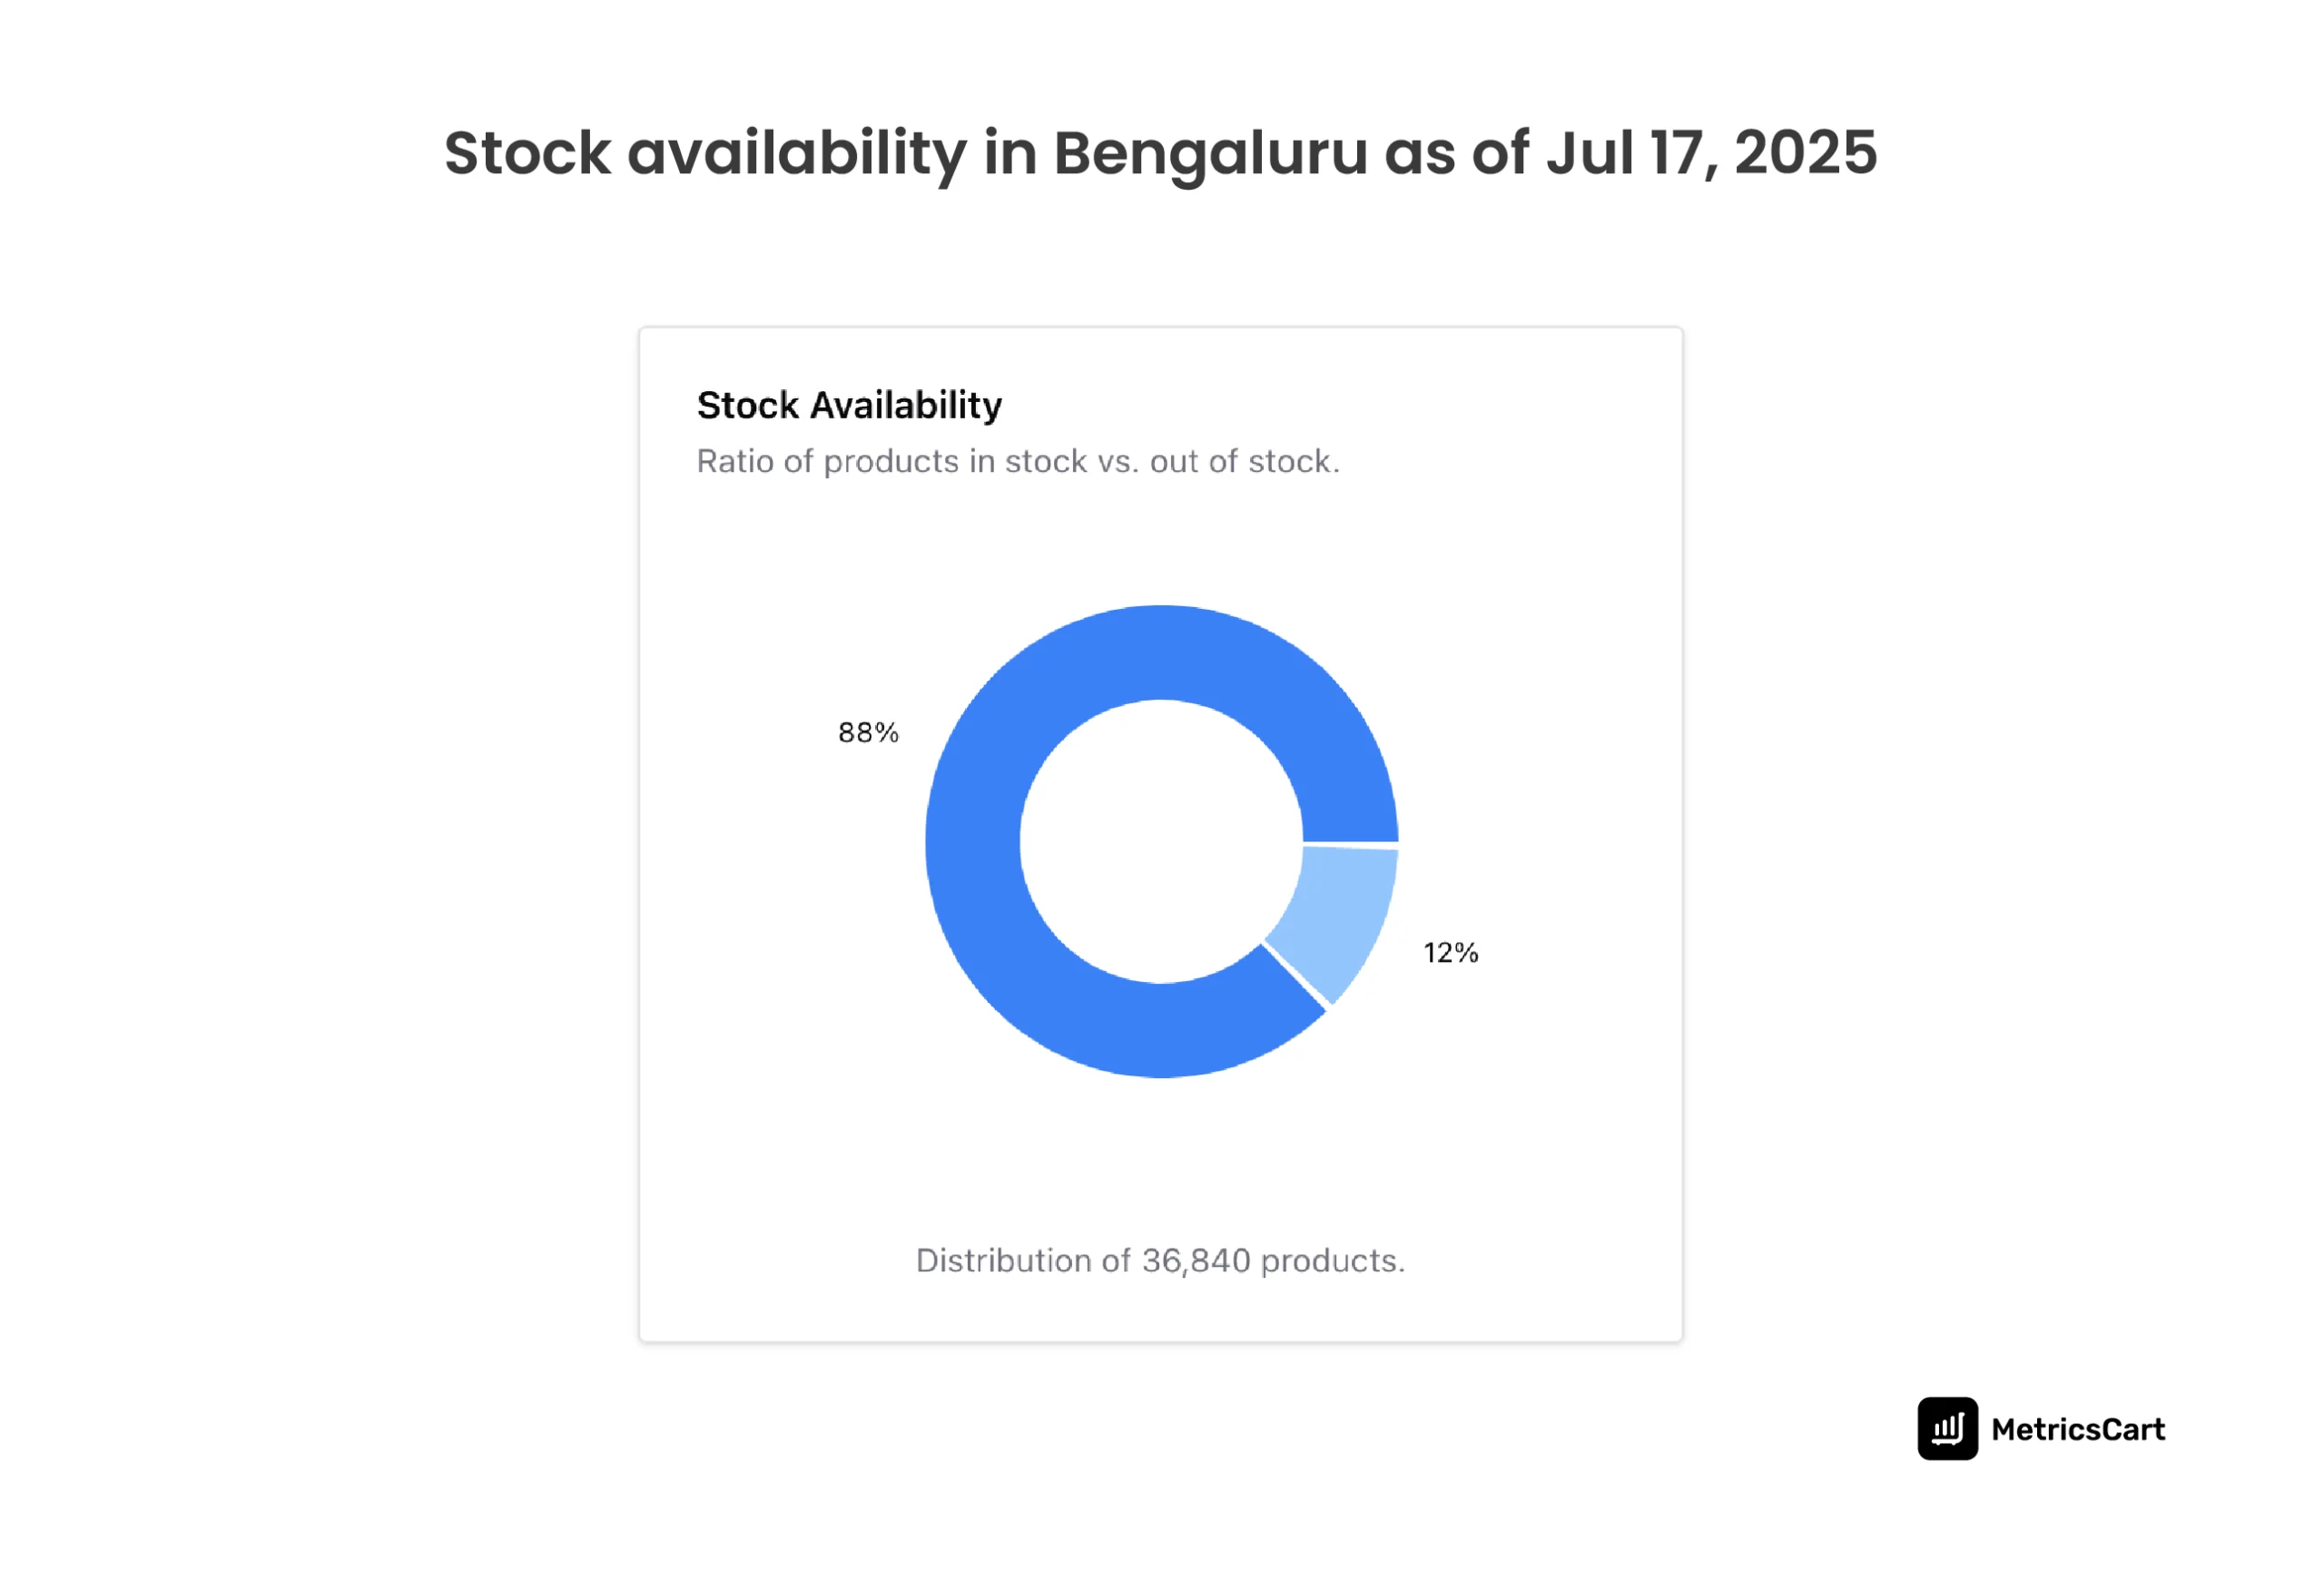
Say your bestseller is out of stock in Delhi but still available in Mumbai. MetricsCart will surface that data so your team can prioritize restocking at the exact location where you’re losing sales. This helps prevent lost revenue and keeps your brand from disappearing in Blinkit’s search results.
Track Discount Trends to Fine-Tune Promotional Tactics
Running a flat 10% off discount might feel safe, but what if your competitors are offering 25% off?
MetricsCart Blinkit price tracker helps you:
- Analyze ongoing discount ranges across your category
- Spot emerging deal patterns and flash sales
- Test and refine your promo strategy based on what’s working in real time
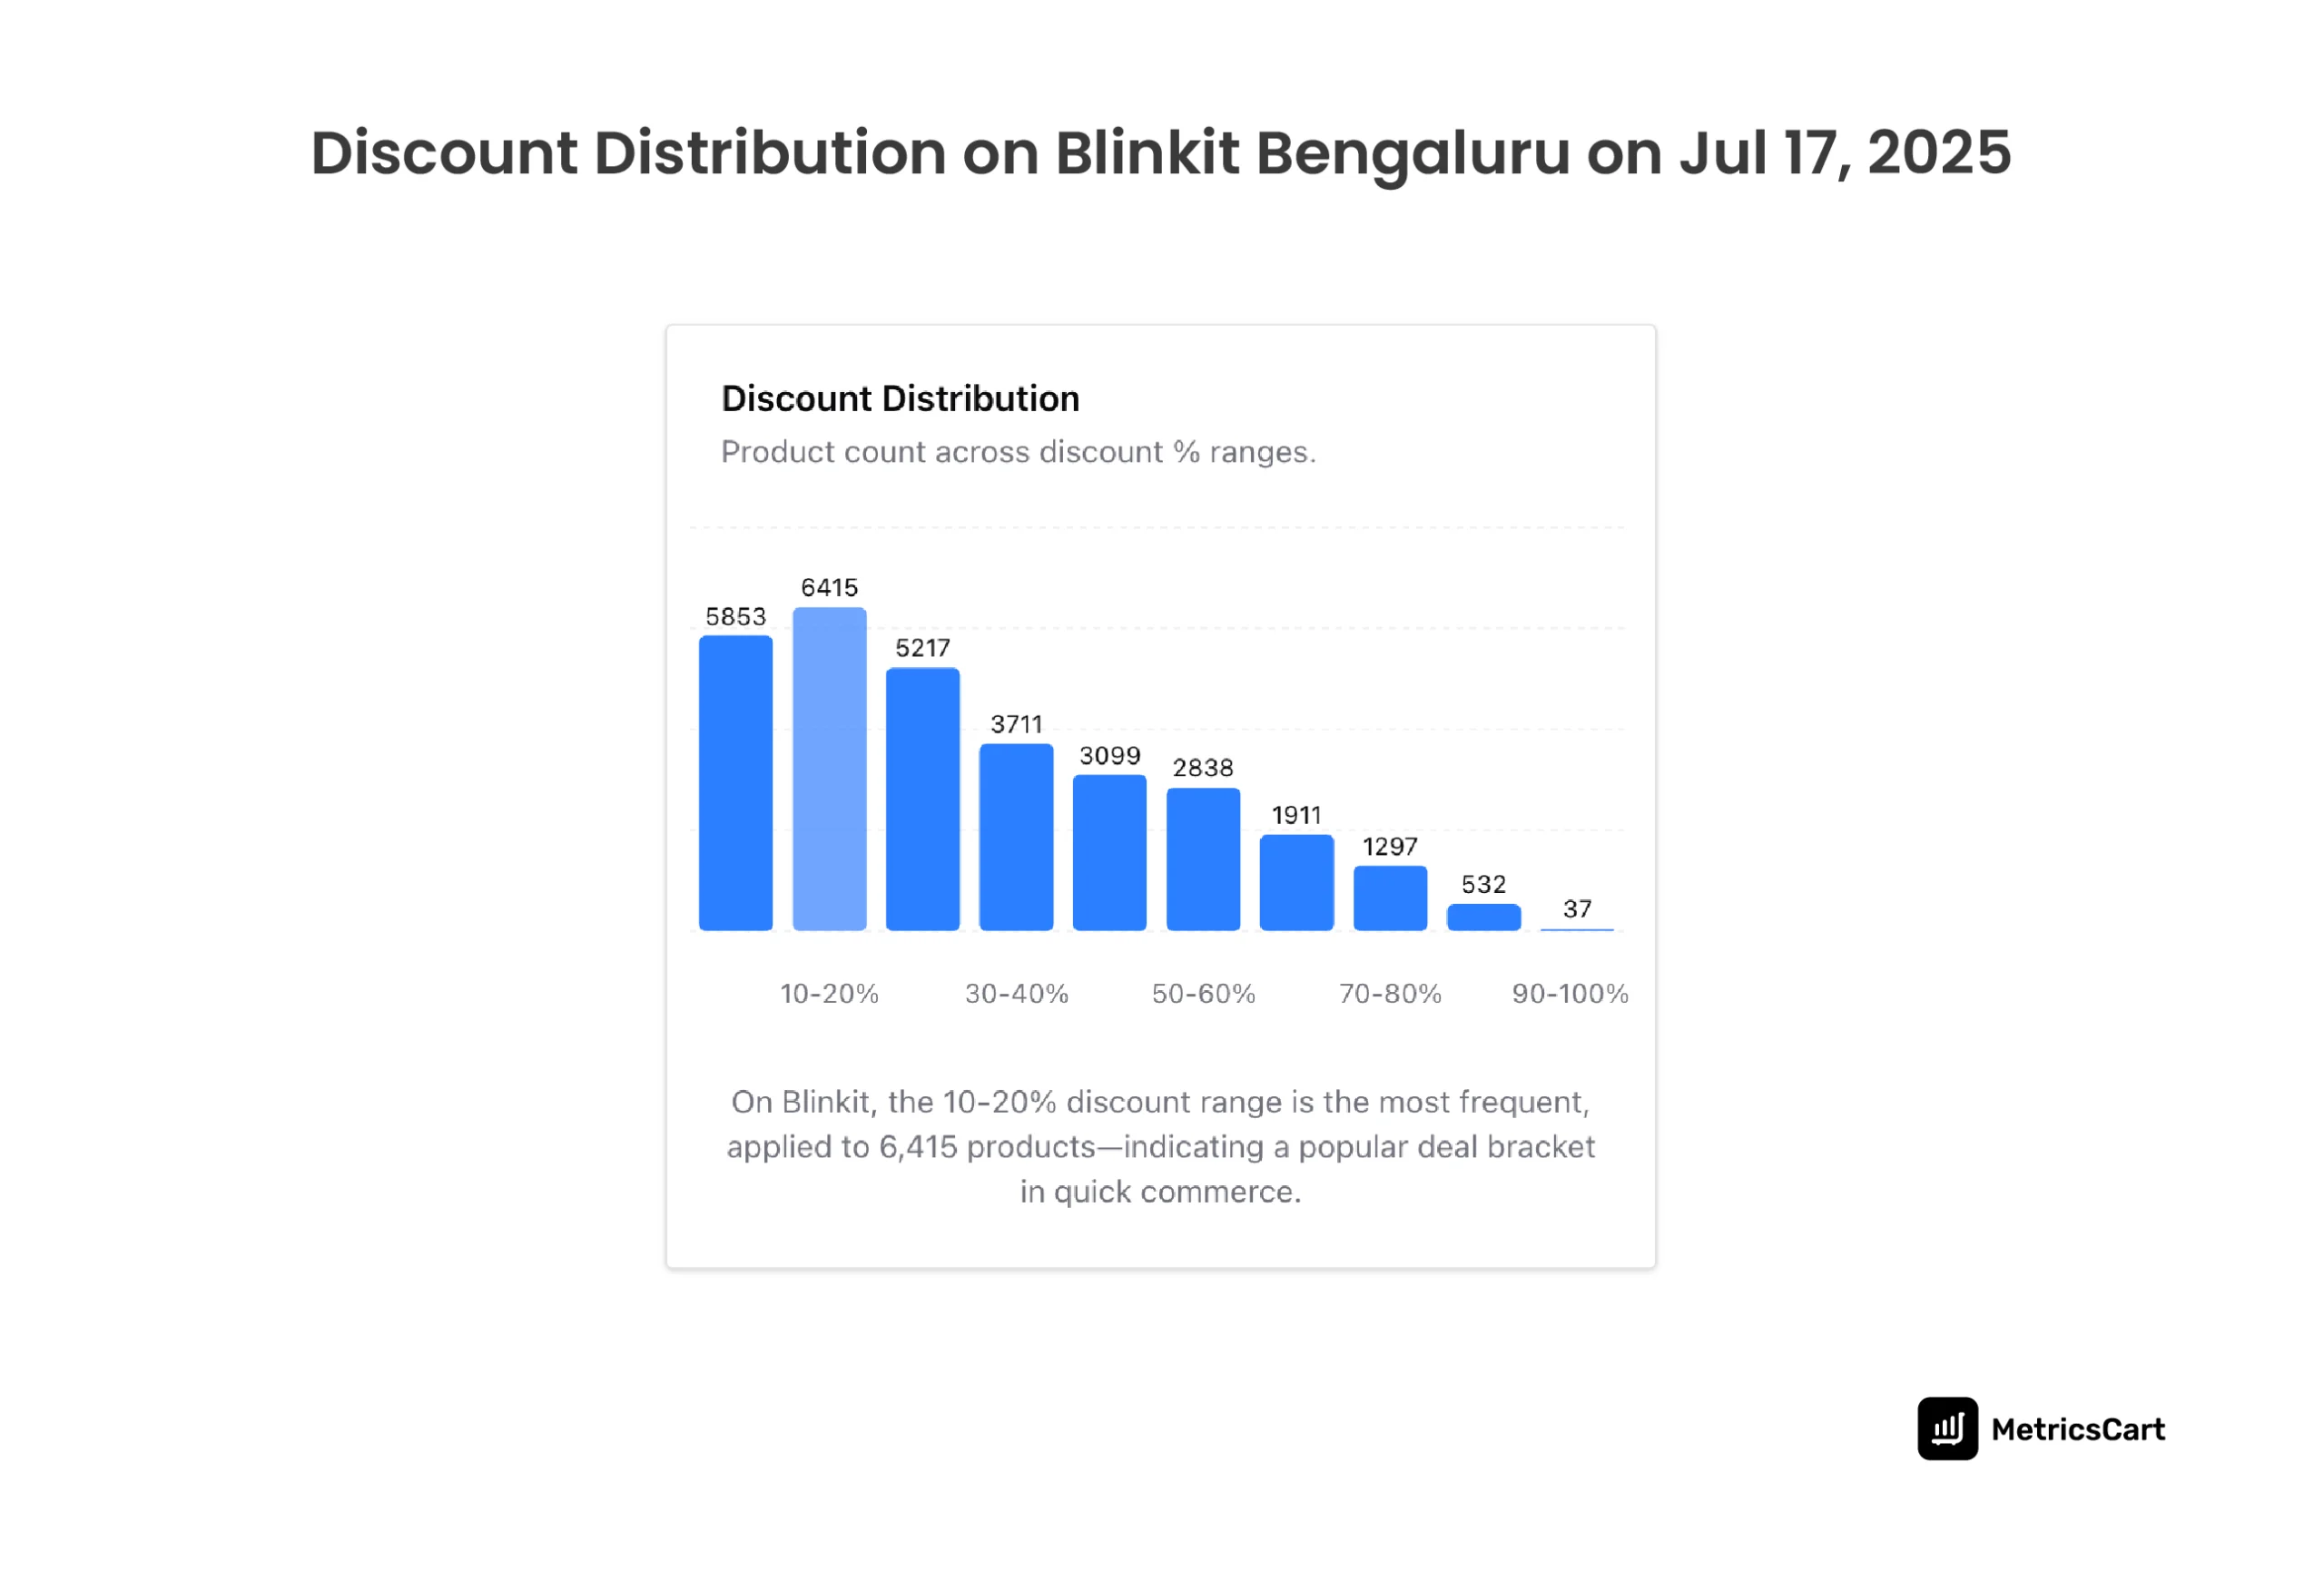
If your product has a 10% discount, but MetricsCart shows that most competitors in the category are offering 20–30%, you now know your offer won’t make the cut. You can now test new discount levels or run short-term flash deals that align with current trends.
Benchmark Performance Against Competitors on Blinkit
It’s common for brand managers to assume who their competitors are, but metrics often tell a different story. The dashboard features a breakdown of
- Top Brands by Product Count
- Top Brands by Average Price and
- Top Brands by Discount.
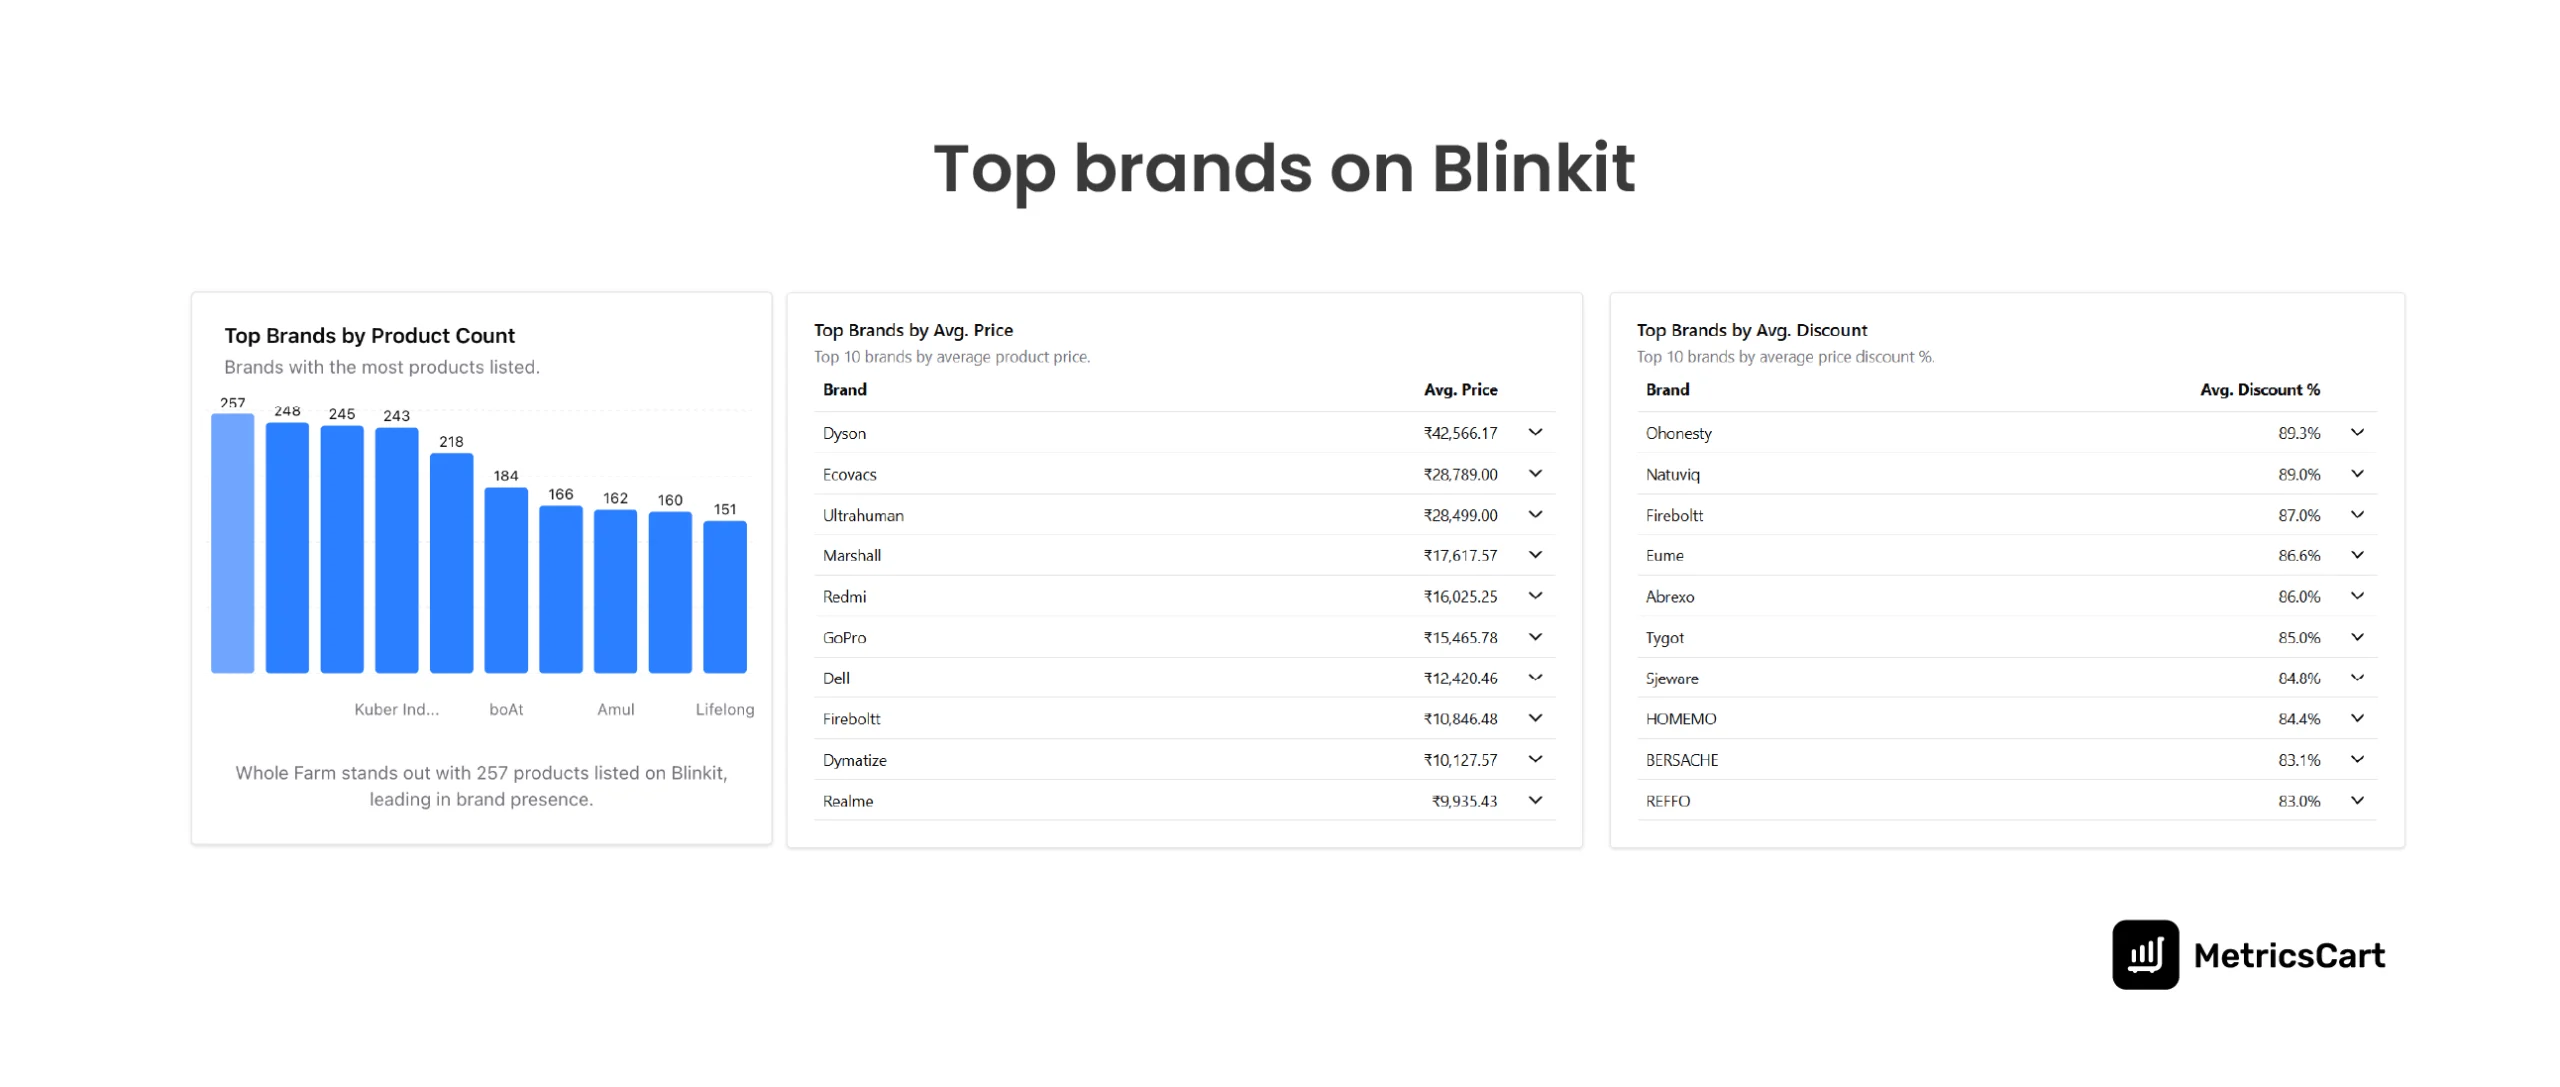
You may think you’re competing against a major FMCG player. But this data could reveal that a high-volume D2C brand is quietly dominating your price tier with aggressive discounting and broader SKU coverage. The price tracker will help you see the real competitor.
Suppose your brand offers 15 SKUs with an average price of ₹145 and a 10% discount. Meanwhile, the leader in your category lists 42 SKUs, prices them at ₹120, and applies a 20% average discount. That means they’re likely eating up search placement, shelf space, and repeated orders.
With this level of benchmarking, you know exactly what kind of share you’re losing and how to adjust. You can decide whether to add new SKUs, increase your promotional intensity, or shift toward a bundled pricing model.
Monitor Category Share
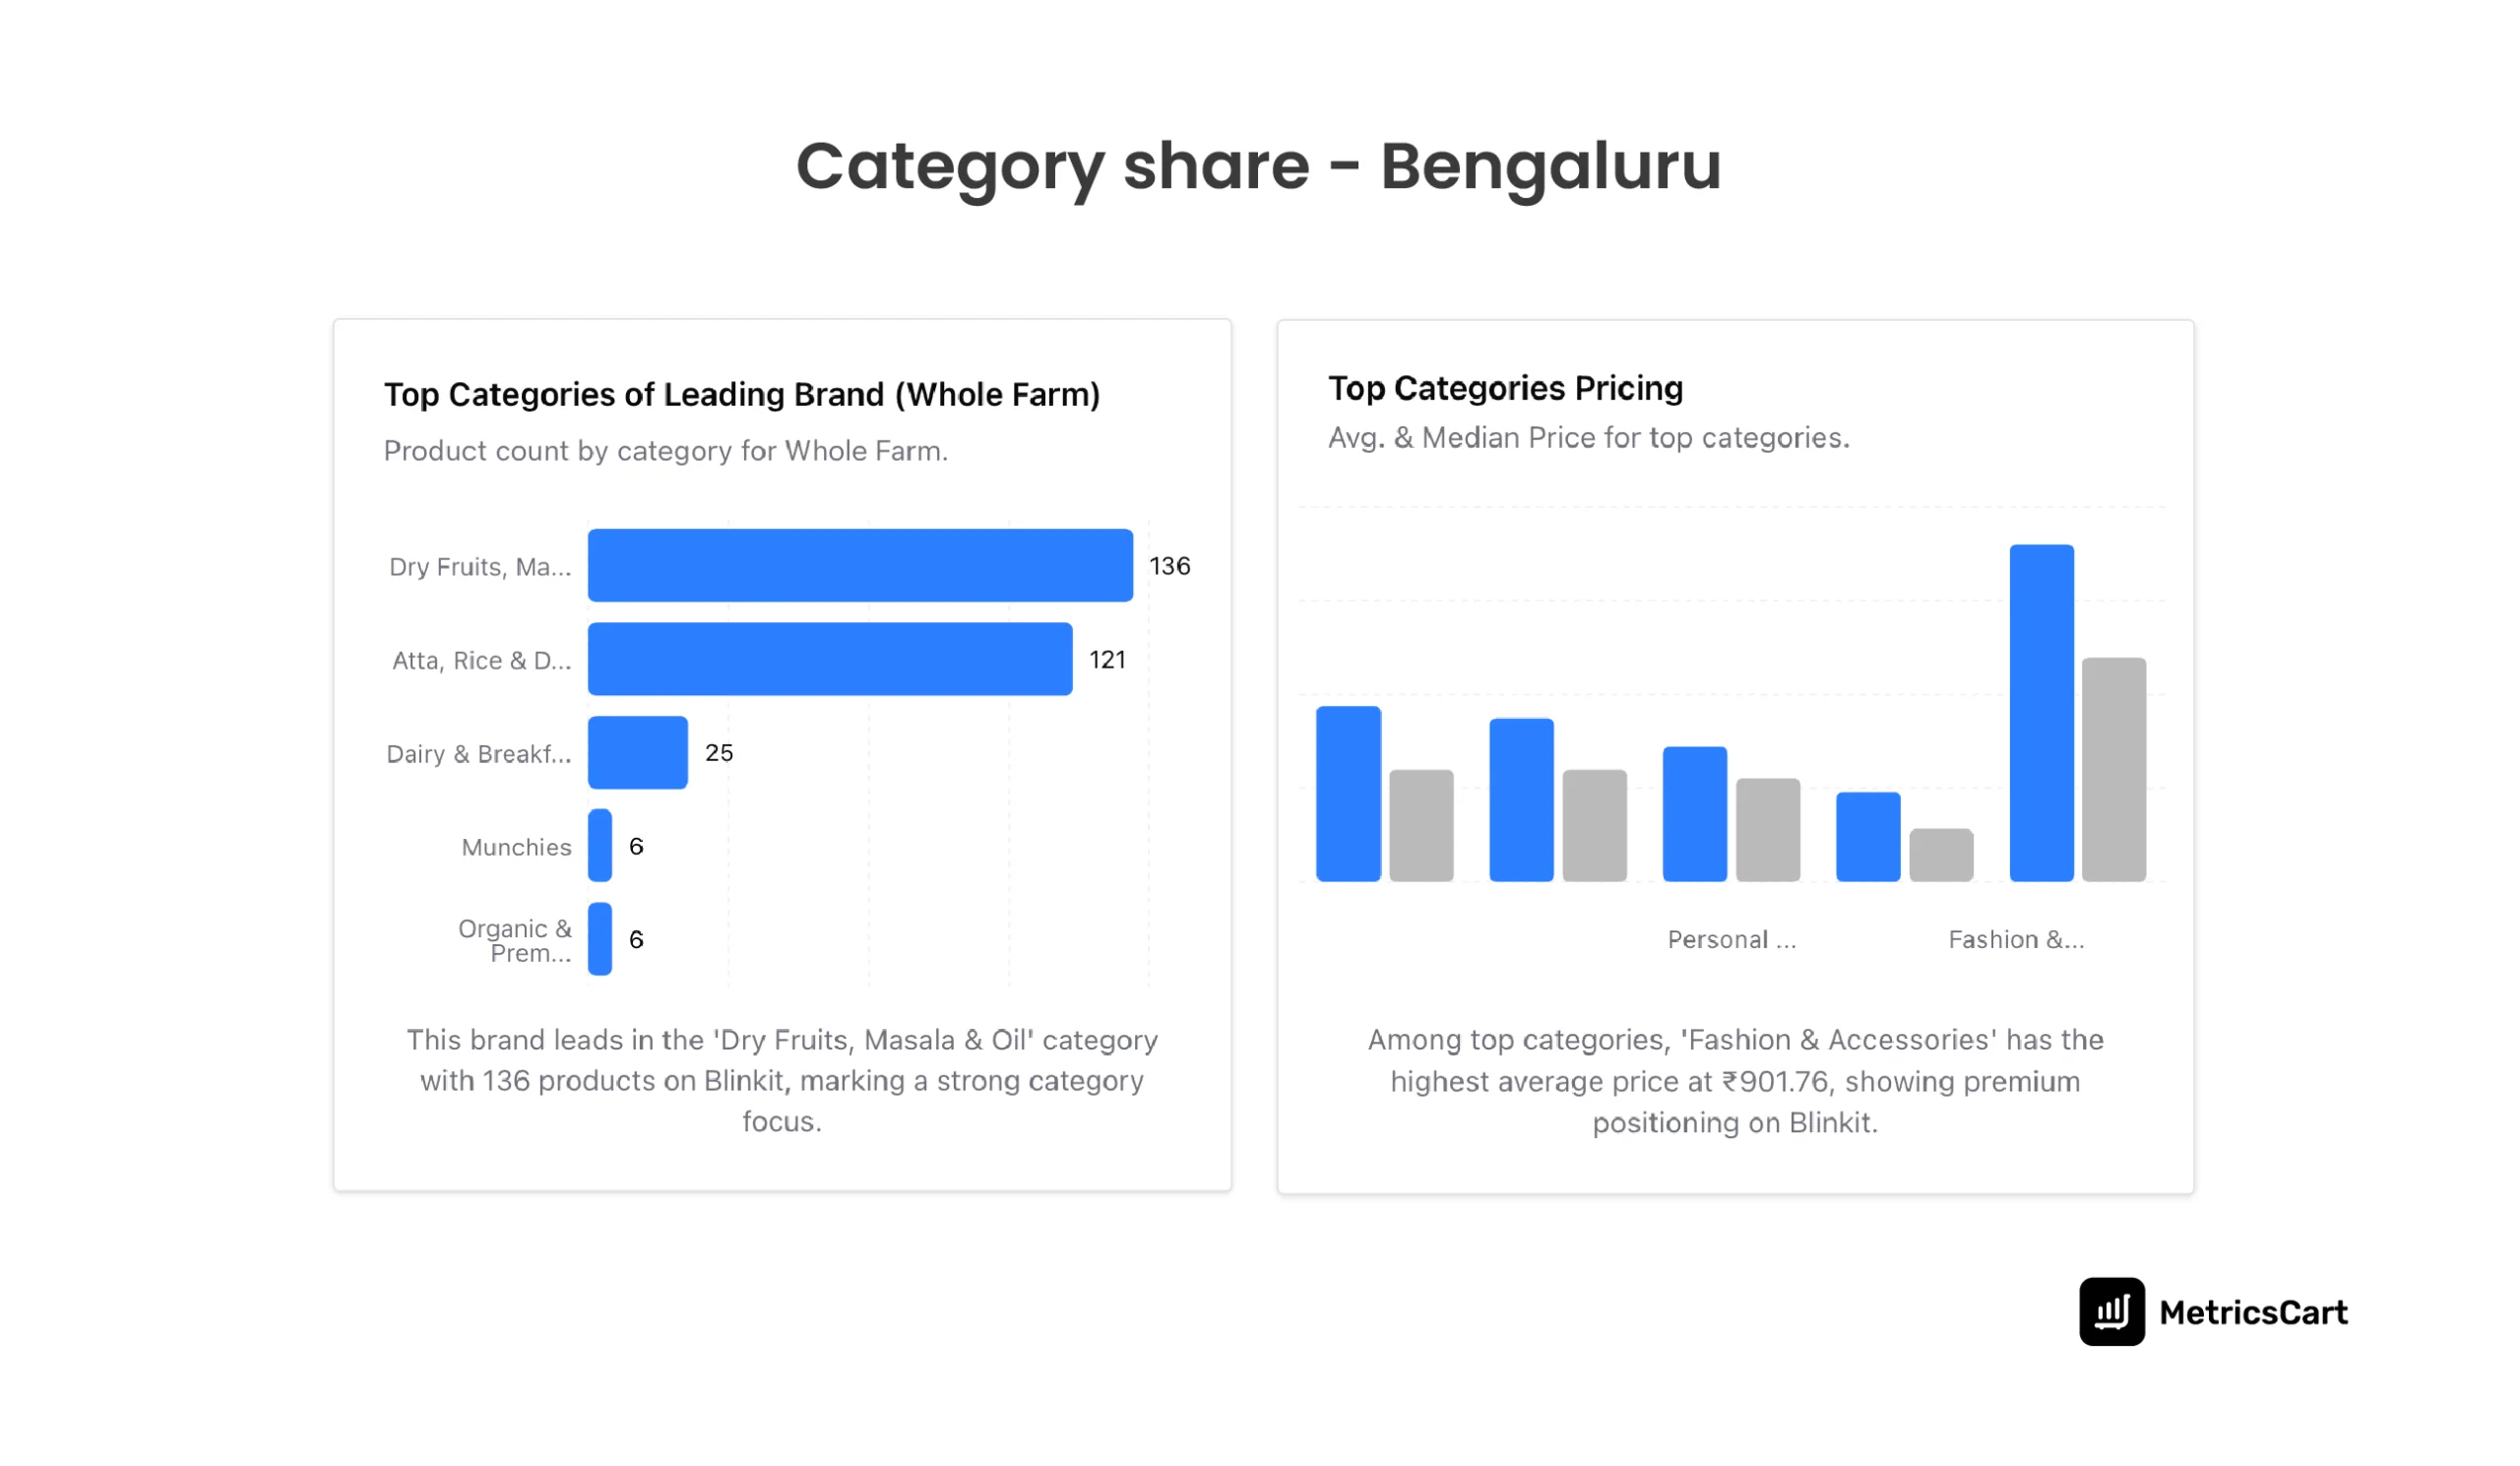
Explore Top Categories Pricing and Top Categories of the Leading Brand to see the average and median price of major categories, plus which categories top brands dominate.
For instance, if the leading brand has 40 SKUs across ₹60–₹280, and you only offer 10 SKUs in the mid-range, there’s a gap to fill. So, look for pricing tiers (e.g., sub-₹100) where your brand has no presence, as those are your low-hanging fruits.
Conclusion
Blinkit moves fast. As per Statista, the quick commerce market will reach $5.38 billion in 2025. The brands that win here are those that stop relying on guesswork and start managing their performance with live, granular, competitive data.
MetricsCart’s Blinkit price tracker doesn’t just show you what’s happening; it shows you what to do. From spotting competitor discounts before they steal your traffic to restocking ahead of zone-level outages, it empowers your team to act, not react.
If Blinkit is a battlefield, MetricsCart is your radar, your compass, and your playbook.
Track, Compare, and Grow with Data. Book a Demo of MetricsCart Today to See Your Blinkit Performance Live.
FAQs
Tracking prices on Blinkit provides valuable visibility into market trends, competitor actions, and stock availability. This enables brands to stay ahead of price changes, prevent stockouts, and refine promotional strategies to meet the 10-minute delivery standard.
The best Blinkit price tracker tools depend on your needs. For comprehensive, real-time insights, MetricsCart is ideal for brands managing multiple SKUs across different cities. 42Signals is better suited for broader market trend analysis, while Quick Compare is ideal for solo operators who need basic price comparisons.
To track prices on Blinkit, use a Blinkit price tracker, such as MetricsCart. These tools automatically monitor price fluctuations, discounts, and stock levels across SKUs, providing live updates that help optimize pricing and inventory strategies.
To find the cheapest groceries on Blinkit, use a price comparison tool like Quick Compare. This allows you to compare prices across multiple platforms, including Blinkit, and find the best deals.
Yes, there are free Blinkit price tracker options available. However, they may have limited features, such as fewer data points, no historical tracking, or SKU-level insights. For a comprehensive set of tools and real-time, actionable data, a paid solution like MetricsCart is more effective.