
Highlights
- Content improvements directly impact conversions; brands often see up to ~15% lift when listings are optimized.
- LLMs can identify the share of search gaps, but only when powered by accurate digital shelf data.
- Manual audits do not scale; real-time DSA platforms are the only reliable way to monitor brand consistency.
- Review analytics + time-based comparison quickly reveal if packaging changes are hurting ratings.
- Five KPIs matter most: Content Health, Share of Search, Buy Box Win Rate, In-Stock Rate, and Rating + Review Velocity.
- Buy Box leakage is driven by pricing, stockouts, and unauthorized sellers; tracking patterns reveal root causes.
- OOS on one retailer does not directly affect another, but sustained loss in sales velocity weakens rankings over time.
- AI recommendations depend on clear, structured, and consistent product data across all channels.
- Localization fails when brands translate instead of adapting, ignore compliance, or lose control of syndicated content.
- Advanced sentiment analysis must extract themes, not just scores, to uncover real reasons behind returns.
Introduction
Brand managers today manage more SKUs, more retailers, and more competitor pressure than they did three years ago, while AI shopping assistants increasingly influence purchase decisions before a customer ever lands on a product page.
And the digital shelf, the online equivalent of a physical retail shelf, describing how a brand’s products appear, rank, and convert across e-commerce platforms like Amazon, Walmart, and Target, has become the primary battleground for brand performance.
But for many brand managers, digital shelf management still feels overwhelming as issues surface faster than they can be diagnosed, and the same critical questions keep coming up. Why is my conversion rate dropping? Who is winning my Buy Box? Is my OOS status on Instacart affecting my rank on Amazon? What does my VP actually want to see in the next QBR?
If these questions sound familiar, you are not alone. MetricsCart’s digital shelf analytics software analyzed all the challenges for brand managers today and curated the 10 most asked digital shelf questions, along with answers to help you navigate this complexity with confidence.
Answering the 10 Most Asked Digital Shelf Questions Asked by Brand Managers
Below, we break down the 10 most asked digital shelf questions and provide straightforward answers you can apply immediately to improve visibility, conversions, and overall performance.
1. How Does Digital Shelf Software Correlate Content Health Scores With Actual Conversion Rate Lifts on Amazon and Walmart?
Digital shelf analytics software is a tool that monitors and optimizes how products appear and perform across online retail platforms. They correlate content health score with conversion rate lifts by continuously tracking how improvements in content quality influence shopper behavior and sales performance over time.
For example, MetricsCart tracks content elements like titles, images, bullet points, keywords, ratings, and reviews to generate a content health score for each SKU. To prove the impact of these improvements, the platform connects with data sources such as Amazon Vendor Central, Seller Central, Walmart Marketplace data, retailer APIs, and brand sales reports where available.
This allows the software to compare content updates against actual metrics like conversion rate, traffic, sales velocity, and Buy Box performance. When direct conversion data is unavailable, the platform uses modeled estimates based on signals such as sales rank movement, traffic trends, and competitive benchmarks to estimate the likely conversion impact.
2. Can an LLM Analyze Our Current Share of Search vs. a Competitor to Identify Which Keywords We Are Losing Ground On?
Yes. An LLM (Large Language Model) can analyze your share of search against competitors by combining keyword-level performance data with ranking, visibility, and conversion signals to identify where you are gaining or losing ground.
However, LLMs don’t generate this data independently. They work on top of inputs from retail media platforms, search analytics tools, or digital shelf software. Once fed this data, they can interpret patterns at scale and surface insights much faster than manual analysis.
Also note that an LLM is only as good as the data it receives. So if you feed accurate digital shelf and retail media data, it becomes a powerful layer for turning raw numbers into actionable intelligence.
3. What Is the Best Way to Monitor Brand Consistency Across 10+ Global Retailers Without Manual Auditing?
Monitoring multiple platforms and SKUs simultaneously every day is one of the biggest challenges for brand managers. And, the best and most scalable way to monitor brand consistency across 10+ global retailers is through a purpose-built DSA platform with continuous crawling, retailer-specific compliance rules, and real-time deviation alerts.
Modern Digital Shelf Analytics platforms like MetricsCart, which monitors 150+ retailer platforms in real time, offer the most efficient, centralized way to track listings, pricing, images, availability, and sellers.
Plus, it also flags and alerts inconsistencies proactively. You don’t have to “find” issues anymore. The system alerts you when something goes off, like a reseller changing pricing, a retailer dropping key images, or a listing going out of stock. So instead of auditing everything manually, you’re just fixing what actually needs attention.

4. How Do I Use Review Analytics to Identify If a Recent Packaging Change Is Negatively Affecting Our Star Rating?
The most effective way to detect the impact of your packaging change is by combining review analytics with time-based comparison.
Start by segmenting reviews into pre-change and post-change periods. This allows you to track shifts in average star rating, review volume, and sentiment immediately after the packaging update goes live. A sudden dip in ratings or an increase in negative reviews during the post-change window is your first indicator.
Next, go deeper with keyword and sentiment analysis. Look for recurring terms related to packaging such as “damaged,” “leaking,” “hard to open,” or “different than before.” If these terms spike after the change, it strongly suggests the new packaging is driving dissatisfaction. Many DSA platforms can automatically cluster these themes and quantify how much they contribute to negative sentiment.
It is also important to isolate packaging-specific feedback from other factors like product quality or delivery issues. Finally, connect these insights back to performance metrics. If the drop in star rating is accompanied by lower conversion rates or higher return rates, the business impact becomes clear.
5. What Are the Top 5 Digital Shelf KPIs I Should Report to My VP to Prove Brand Health?
Digital shelf strategy for brand managers starts with tracking the right KPIs. Without a focused set of metrics, it becomes difficult to clearly communicate performance, justify investments, or prove brand health at the executive level.
The five most critical digital shelf KPIs you must report are
- Content Health Score: A measure of how complete, accurate, and optimized your product content is across listings. It is the leading indicator of whether your listings can convert the traffic they receive.
- Share of Search (vs. primary competitors): The percentage of category search visibility your brand owns compared to key competitors. It shows whether you are gaining or losing ground in how often shoppers find you first.
- Buy Box Win Rate: The percentage of time your brand or authorized seller controls the Buy Box on key SKUs. Report this because losing the Buy Box means losing the conversion, regardless of traffic.
- In-Stock Rate: Availability gaps directly suppress sales velocity and search ranking. This KPI gives the percentage of time your products are available for purchase without stockouts.
- Weighted Average Star Rating with Review Velocity: A combined view of your average rating and how quickly new reviews are coming in, indicating both quality and demand momentum. It gives an idea about where sentiment stands today, plus whether it is improving or deteriorating.
Together, these metrics cover content, visibility, revenue protection, availability, and customer sentiment, giving leadership a complete picture of brand health on the digital shelf.
READ MORE | 6 E-Commerce KPIs for the Digital Shelf: Must-Know Guide for Brands
6. How Can I Identify “Leakage” Where 3P Sellers Are Winning the Buy Box Over Our 1P Listings?
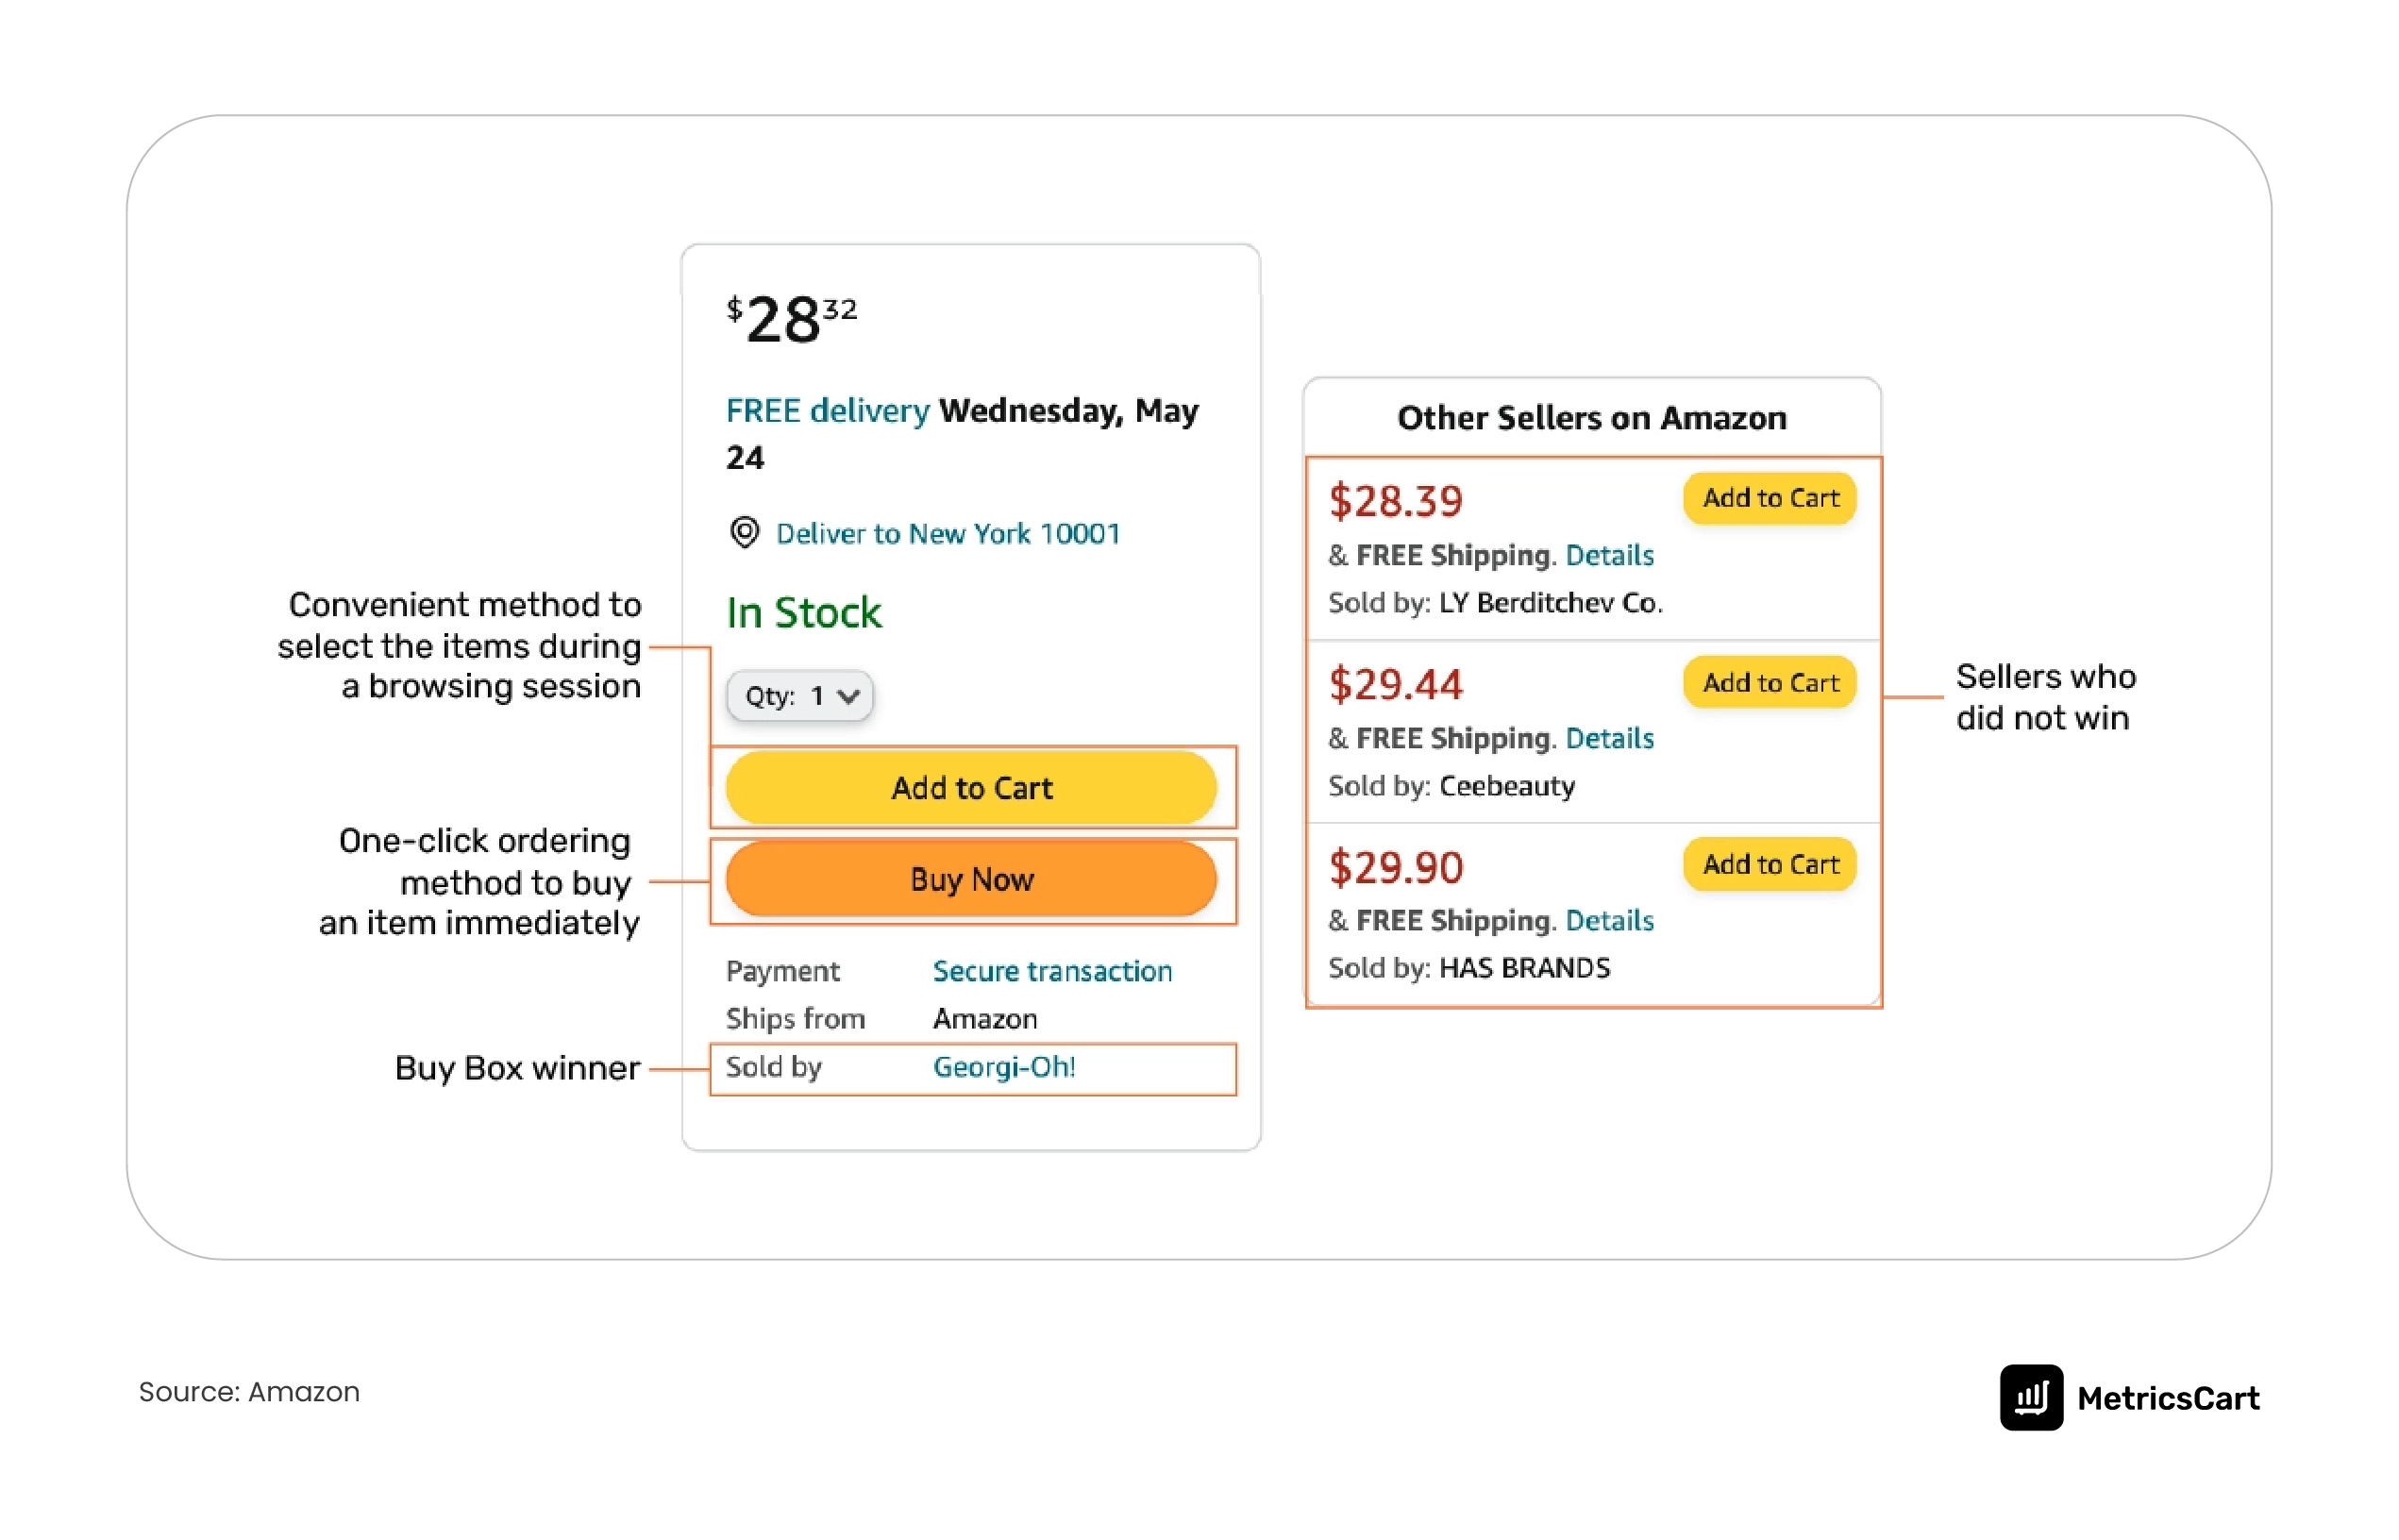
Buy Box leakage is one of the most common digital shelf issues brand managers deal with, and it directly impacts margin, MAP compliance, and brand control. The key is not just knowing that 3P sellers are winning the Buy Box, but understanding when, why, and how often it happens.
Start by tracking Buy Box ownership at the ASIN level on a continuous basis. Instead of periodic checks, look for patterns over time. The most important signals are recurring drops in 1P ownership, sudden shifts during peak traffic periods, and repeated wins by the same set of 3P sellers.
Key signals to monitor
| Signal | What it indicates | Why it matters |
| Drop in 1P Buy Box ownership | Increasing 3P dominance | Early sign of pricing or availability issue |
| Frequent Buy Box switching | Price volatility or algorithm sensitivity | Indicates aggressive 3P competition |
| 3P win after 1P stockout | Inventory-driven leakage | Direct revenue loss due to OOS events |
| Same 3P sellers winning repeatedly | Structured reselling channel | Suggests grey market or distributor leakage |
| Sudden spike in 3P offers | New seller entry on SKU | Possible channel conflict or diversion |
Once you identify leakage, the next step is to diagnose triggers. In most cases, it comes down to pricing undercuts, stockouts, fulfillment speed differences, or unauthorized seller entry on high-velocity SKUs.
Next, understand where these sellers are sourcing inventory from.
In most cases, grey market sellers source through distributors, arbitrage from your own DTC or retail channels, or unintended leakage within your supply chain. The way to uncover this is by analyzing violation patterns such as repeated undercutting across specific SKUs, clusters of new sellers appearing after replenishment cycles, or consistent Buy Box wins tied to specific distribution geographies or timing.
By combining Buy Box monitoring with seller behavior analysis, brand managers can move from detection to root-cause understanding and take corrective action at the source level.
7. Does Out-of-Stock (OOS) Status on a Secondary Retailer Affect My Organic Search Ranking on a Primary One?
Not directly. Most retailers like Amazon, Walmart, or Target run independent search and ranking algorithms, so an OOS on one platform does not automatically reduce your organic ranking on another.
However, it can have an indirect impact over time. If your product is frequently out of stock on secondary retailers, you lose total cross-channel sales volume and velocity. Since ranking systems on primary retailers heavily depend on sales momentum, conversion consistency, and demand strength, a sustained loss in overall market performance can gradually weaken your ranking stability.
For example, sustained OOS on Target can reduce overall brand sales velocity, which indirectly weakens Amazon ranking signals that depend on cross-channel demand strength.
READ MORE | Benefits of Monitoring Out of Stock in E-Commerce
8. How Do I Optimize My Product Descriptions to Ensure Gemini and ChatGPT Recommend My Brand for Category Queries?
Generative Engine Optimization (GEO) is becoming an inevitable part of digital shelf strategy for brand managers. Salesforce says AI and agents will drive 21% of all holiday orders globally, accounting for $263 billion in sales, highlighting how quickly discovery is shifting toward AI-led interfaces.
Unlike traditional search, Gemini, ChatGPT, and other Gen AI solutions do not rank products based on keywords. They synthesize recommendations from structured product data, retailer listings, reviews, and authoritative web content. This means optimization is less about SEO tactics and more about making your product information interpretable, consistent, and verifiable across sources.
So, here is what you need to do:
Name the category, user, and problem in your first sentence
AI systems read for context, not cleverness. Instead of “a premium hydration solution,” write “an electrolyte drink for endurance athletes who need fast post-workout recovery.” The clearer your opening, the easier it is for AI to match your product to a category query.
Replace marketing language with verifiable facts
Words like “innovative” or “best-in-class” carry no weight with AI. Specific claims like “72-hour battery life,” “dermatologist-tested,” or “used by 2 million professionals” do, because AI recommendations are built on information that can be corroborated across multiple sources.
Add schema.org/Product markup to every product page
Structured data helps AI crawlers extract your brand name, ratings, pricing, and product attributes cleanly and confidently without having to interpret your copy.
Build consistent mentions across third-party sources
AI does not rely solely on what your website says. It weighs what review sites, retailer pages, and editorial content say about you. Make sure those mentions exist, are accurate, and use the same product and brand names you use on your own pages.
Keep your brand and product names identical everywhere
Your website, Amazon listing, retail partners, and press coverage should all refer to you the same way. Inconsistent naming confuses AI entity resolution and reduces the likelihood of a confident recommendation.
The brands AI recommends most are not necessarily the biggest. They are the ones that make it easiest for AI to understand exactly what they sell, who it is for, and why it works.
9. What Are the Common Pitfalls in Managing Localized Content for a Global Brand Across Different E-Commerce Platforms?
Localized content management is one of the major digital shelf challenges for brand managers operating across regions, because the failure modes are not always visible until they have already damaged ranking, compliance, or customer trust.
Here are some of the common pitfalls of localizing content:
Pitfall 1: Translating instead of localizing
Direct translation of English copy does not account for how shoppers in different markets actually search. For instance, German shoppers use longer compound search terms and expect feature-first technical copy. Meanwhile, US shoppers mostly look into the benefits. And in that case, a translated content that has not been keyword-optimized for local search behavior is effectively invisible to local shoppers.
Pitfall 2: Compliance content being stripped in syndication
Ingredient disclosures, allergen warnings, and regulatory language required in EU and APAC markets frequently get dropped when content is syndicated through a US-configured workflow. This is not just a content quality issue: it is a legal and regulatory risk that your compliance team needs to be part of your digital shelf governance process.
Pitfall 3: Image compliance failures by market
Lifestyle images that are legally appropriate in the US may be restricted in Germany, France, or Australia. Before-and-after imagery, implied health outcome visuals, and certain claim-led creative are more tightly regulated in EU markets. A global image asset that passes US review can fail across multiple EU markets without anyone flagging it in your workflow.
Pitfall 4: Local teams or retailer portals overwriting syndicated content
This is probably the most common issue. Local market teams push edits through retailer portals that overwrite your syndicated master content. Without an automated monitoring layer, these overwrites go undetected for days or weeks. MetricsCart’s live listing surveillance automatically flags these changes and alerts your team before compliance violations or brand inconsistencies accumulate.
READ MORE | E-Commerce Product Page Optimization: Tips and Examples
10. Which DSA Tools Offer the Best Sentiment Analysis for Extracting “Reasons for Return” From Customer Reviews?
Most DSA platforms aggregate reviews, but the quality of NLP and topic extraction varies significantly. For extracting return-reason signals specifically, you need category-trained models rather than generic sentiment scoring that just outputs a positive or negative label.
What to evaluate in any platform:
| Capability | Why It Matters |
| Theme-level extraction vs. sentiment score | A score tells you something is wrong. A theme tells you what and routes it to the right team |
| Category-trained NLP | Generic models miss product-specific language; CPG-trained models catch “seal broke,” “texture changed,” “doesn’t lather” |
| Date-range segmentation | Essential for correlating review themes with product or packaging change events |
| Retailer-level breakdown | Return reasons can differ meaningfully between Amazon, Walmart, and Target shoppers |
MetricsCart’s review monitoring software is built for this level of precision. Rather than grouping feedback into broad positive or negative buckets, it extracts granular, actionable themes from review text. So “arrived damaged,” “product didn’t work,” and “not what I expected from the listing” are treated as separate issue clusters, not blended into a single negative score. That distinction is critical because each maps to a different root cause and owner.
This is powered by MetricsCart’s Product Pulse Quadrants, a visualization layer that maps review themes by frequency and trajectory across a two-axis grid
This is powered by MetricsCart’s Product Pulse Quadrants, a visualization layer that maps review themes across a two-axis grid:
- X-axis: frequency of mentions, showing how widespread a complaint or return reason is
- Y-axis: trajectory over time, showing whether that issue is increasing, stable, or declining
This allows teams to quickly identify whether a complaint is both widespread and accelerating. For example, if “arrived damaged” suddenly moves into a high-frequency, fast-growth quadrant, it signals a rising operational or fulfillment issue that requires immediate attention.
Additional platform capabilities that are most directly relevant for extracting return reasons are:
- Theme-level extraction: Surfaces discrete return triggers like “arrived damaged,” “wrong size,” or “didn’t match description” as separate clusters rather than blending them into a single sentiment score.
- Root cause mapping: Routes each issue cluster directly to the responsible team, such as supply chain, product, or content, so no complaint falls into a generic review queue.
- Pre vs. post change analysis: Tracks how return-related complaints shift after packaging, formulation, or content updates, giving you a clean before-and-after signal.
MetricsCart also offers aspect-based sentiment analysis, competitor benchmarking, retailer-level insights, trend and anomaly detection, review velocity tracking, keyword and phrase clustering, emotion detection, custom alerts, campaign impact tracking, and portfolio-level insights across SKUs.
The result is a shift from reactive review reading to structured diagnosis. Instead of relying on lagging metrics, you get a clear view of why customers are returning products and exactly where to act first.
Wrapping Up All the Questions
Digital shelf management is a continuous, data-driven process where content quality, availability, pricing control, search visibility, and customer feedback all work together to shape performance.
The questions covered here reflect what brand managers are actively dealing with today: fragmented data, rising competition, and increasing pressure to prove impact. The good news is that each of these challenges is now measurable and diagnosable with the right systems.
MetricsCart is built specifically for this workflow. It connects content health, pricing, availability, Buy Box monitoring, and review analytics into a single platform that brand managers use to identify issues before they compound into revenue loss. That continuity of visibility, across every retailer and every channel you sell on, is what makes the difference between reacting to problems and preventing them.
Get Complete Control Over Pricing, Content, and Availability Across Every Retail Platform.
FAQs
Digital shelf analytics is the use of data and automation to track and analyze key performance signals such as search visibility, conversion rates, pricing changes, stock levels, and reviews. It matters because it turns scattered data into clear insights, helping you identify issues early, measure impact, and make faster decisions that directly improve sales and profitability.
Digital shelf management is the process of monitoring and optimizing how your products appear and perform across online retailers like Amazon and Walmart. It covers pricing, content quality, availability, ratings, and Buy Box ownership. For brand managers, it means having full visibility and control over these factors to protect revenue, maintain brand consistency, and stay competitive.
MetricsCart offers modular digital shelf analytics starting at $300 per module per month, making it the most affordable enterprise-grade DSA platform currently available. Its modular architecture means brands pay only for the specific capabilities they need, such as content compliance, Share of Search, Buy Box monitoring, ratings and reviews analysis, or the AI Co-pilot, rather than a monolithic, all-or-nothing pricing model.
Third-party sellers can win the Buy Box on your ASINs if they offer lower prices with Prime-eligible fulfillment. When a 3P seller wins your Buy Box, the conversion revenue goes to them; they may override your content with unauthorized copy and images, and your MAP policy may be violated. Research shows brands lose approximately 1 in 5 conversion opportunities to 3P sellers on Amazon. Automated MAP monitoring and Buy Box tracking, as offered by MetricsCart, is the most effective countermeasure.
Share of search is the percentage of total search visibility your brand captures within a category compared to competitors on platforms like Amazon. It shows how often your products appear in relevant search results. A higher share of search indicates stronger visibility and demand, making it a leading indicator of market share and future sales performance.