If you manage Amazon P&L, own a channel, or sit inside an omnichannel or marketplace team, you already know this problem: by the time price erosion shows up in a monthly revenue review, it’s usually been happening for weeks.
A single unauthorized 3P seller undercutting MSRP by 20% doesn’t just cost that one sale. It resets customer price expectations, drags down the Buy Box price algorithm, and pulls every other seller (including your own 1P listing) toward the new, lower floor.
This MetricsCart pricing and Buy Box analysis report is designed to catch that erosion early, attribute it to specific sellers, and give teams the data they need for monthly and quarterly price health reporting, MAP enforcement escalation, and Buy Box strategy before it becomes a leadership-level revenue problem.
Product: Keurig K-Mini Single Serve K-Cup Pod Coffee Maker, 6 to 12oz Brew Size, BlackProduct Overview
Brand: Keurig
Marketplace: Amazon US
Tracking period: June 2 to June 30, 2026 (29 days)
Pricing health: Critical
Category: Home & Kitchen › Coffee Makers › Single-Serve Brewers
Product URL: amazon.com/dp/B07GV2S1GS
Tracking Summary
MetricsCart tracked the Keurig K-Mini, a single-serve coffee machine, on Amazon US for 29 days from June 2, 2026 to June 30, 2026 to assess MAP compliance and price erosion against MSRP.
The Buy Box price ranged from $44.10 to $65.00 against an MSRP of $99.99, closing at $49.00. Across 31 sellers, Amazon-owned accounts controlled the Buy Box for 28 of 29 days, holding the price at roughly half MSRP.
What This Report Covers
- Price Erosion: how the Buy Box price compared to MSRP over the month.
- Buy Box Ownership: who held the offer, and at what price.
- Seller Density and Price Movement: whether the price fell as more sellers arrived.
- Seller Churn: who joined, who left, and who stayed.
- Findings and Recommended Actions: where things stand, and what to do first.
Understanding Coffee Machine Pricing Strategy
Coffee machines are priced in a few distinct ways, and the model a brand chooses shapes how much its hardware price can move before the business behind it starts to hurt. Three approaches cover most of the category:
- Razor-and-blades: The machine is sold at or near cost, sometimes at a loss, to get it into as many homes as possible. The real margin comes later, from proprietary consumables the machine locks the user into, such as pods or capsules. Keurig and Nespresso are the clearest examples. The hardware is a gateway to a recurring pod business.
- Value-based pricing: The machine carries a premium price on its own merits, engineering, build quality, or design, and there is no proprietary consumable behind it. The user brings open commodity inputs like whole beans. Espresso machines and high-end manual brewers sit here, where the hardware itself is the product and the margin.
- Penetration pricing: Standard drip makers and basic pour-over setups compete on low price and volume. There is no consumable lock-in and no premium positioning, so profit comes strictly from scale and retail distribution.
Price Health of Keurig K-Mini
Price health is the single fastest signal for knowing whether a SKU needs intervention this week or can wait until the next quarterly review.
In the case of Keurig Mini, the price fell from $65.00 to $49.00 over the tracking window, which is a $16.00 drop in under a month, while the listing had already opened the period $34.99 below MSRP. That means erosion wasn’t a one-time dip; it was already baked in before the report window even began, and it kept sliding.
A single “erosion %” number, tracked monthly, is one of the cleanest KPIs a brand team can hand to leadership. It converts a scattered set of marketplace symptoms (seller complaints, margin questions, “why is this listing so cheap”) into one trackable number that either goes up (recovering) or down (deteriorating) month over month.
Price Erosion % of Keurig K-Mini Against MSRP
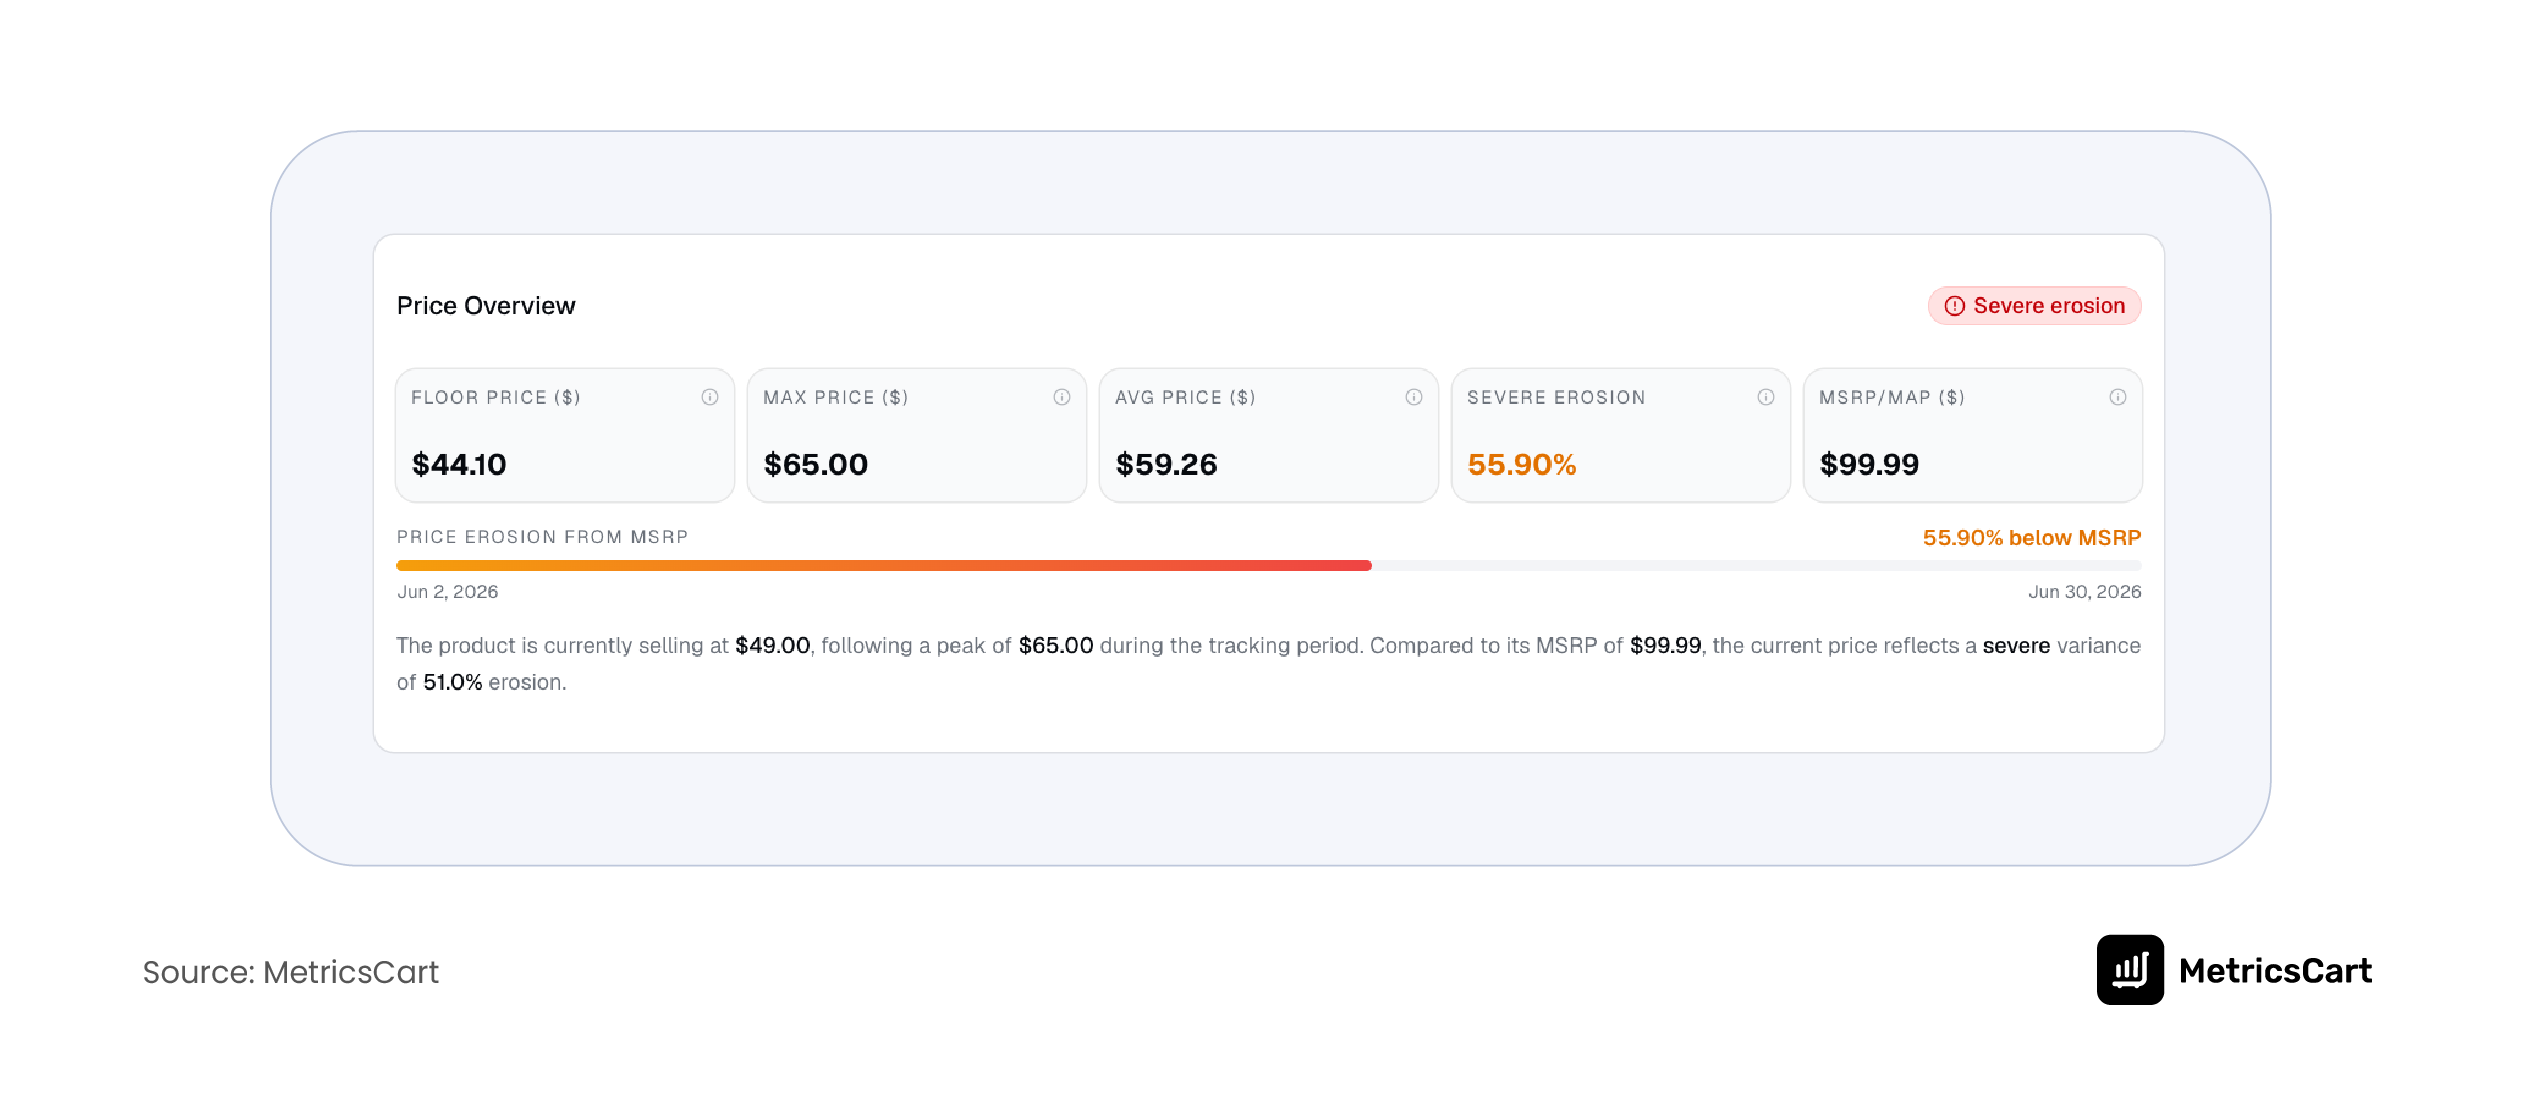
The listing traded between $44.10 and $65.00, averaged $59.26, and closed at $49.00. Price erosion is the percentage gap between the current selling price and MSRP. In this case, it’s running at 55.90% below MSRP, categorized as “severe.”
- Most of the gap was there on day one: $34.99 of the $50.99.
- The price dropped $16.00 and held there, longer than a sale would last.
- $44.10 was the lowest winning price; $43.12 (Amazon Resale) the lowest listed.
- A month at half price trains shoppers to expect it, and pulls other retailers down too.
This SKU has held near half its MSRP for a full month, so the erosion is a settled price level, and any move back toward $99.99 now reads to shoppers as an increase.
In addition, once erosion crosses roughly 80% below MSRP, a SKU typically enters CRAP territory: Can’t Realize Any Profit. At that erosion level, no seller in the chain (1P, 2P, or 3P) can cover landed cost, fulfillment, referral fees, and return/damage reserves.
At 55.9% erosion, the Keurig K-Mini listing in this report is not yet at CRAP level, but it’s within striking distance, and the seller proliferation trend suggests it’s heading in that direction, not away from it.
Buy Box Ownership Analysis of Keurig K-Mini
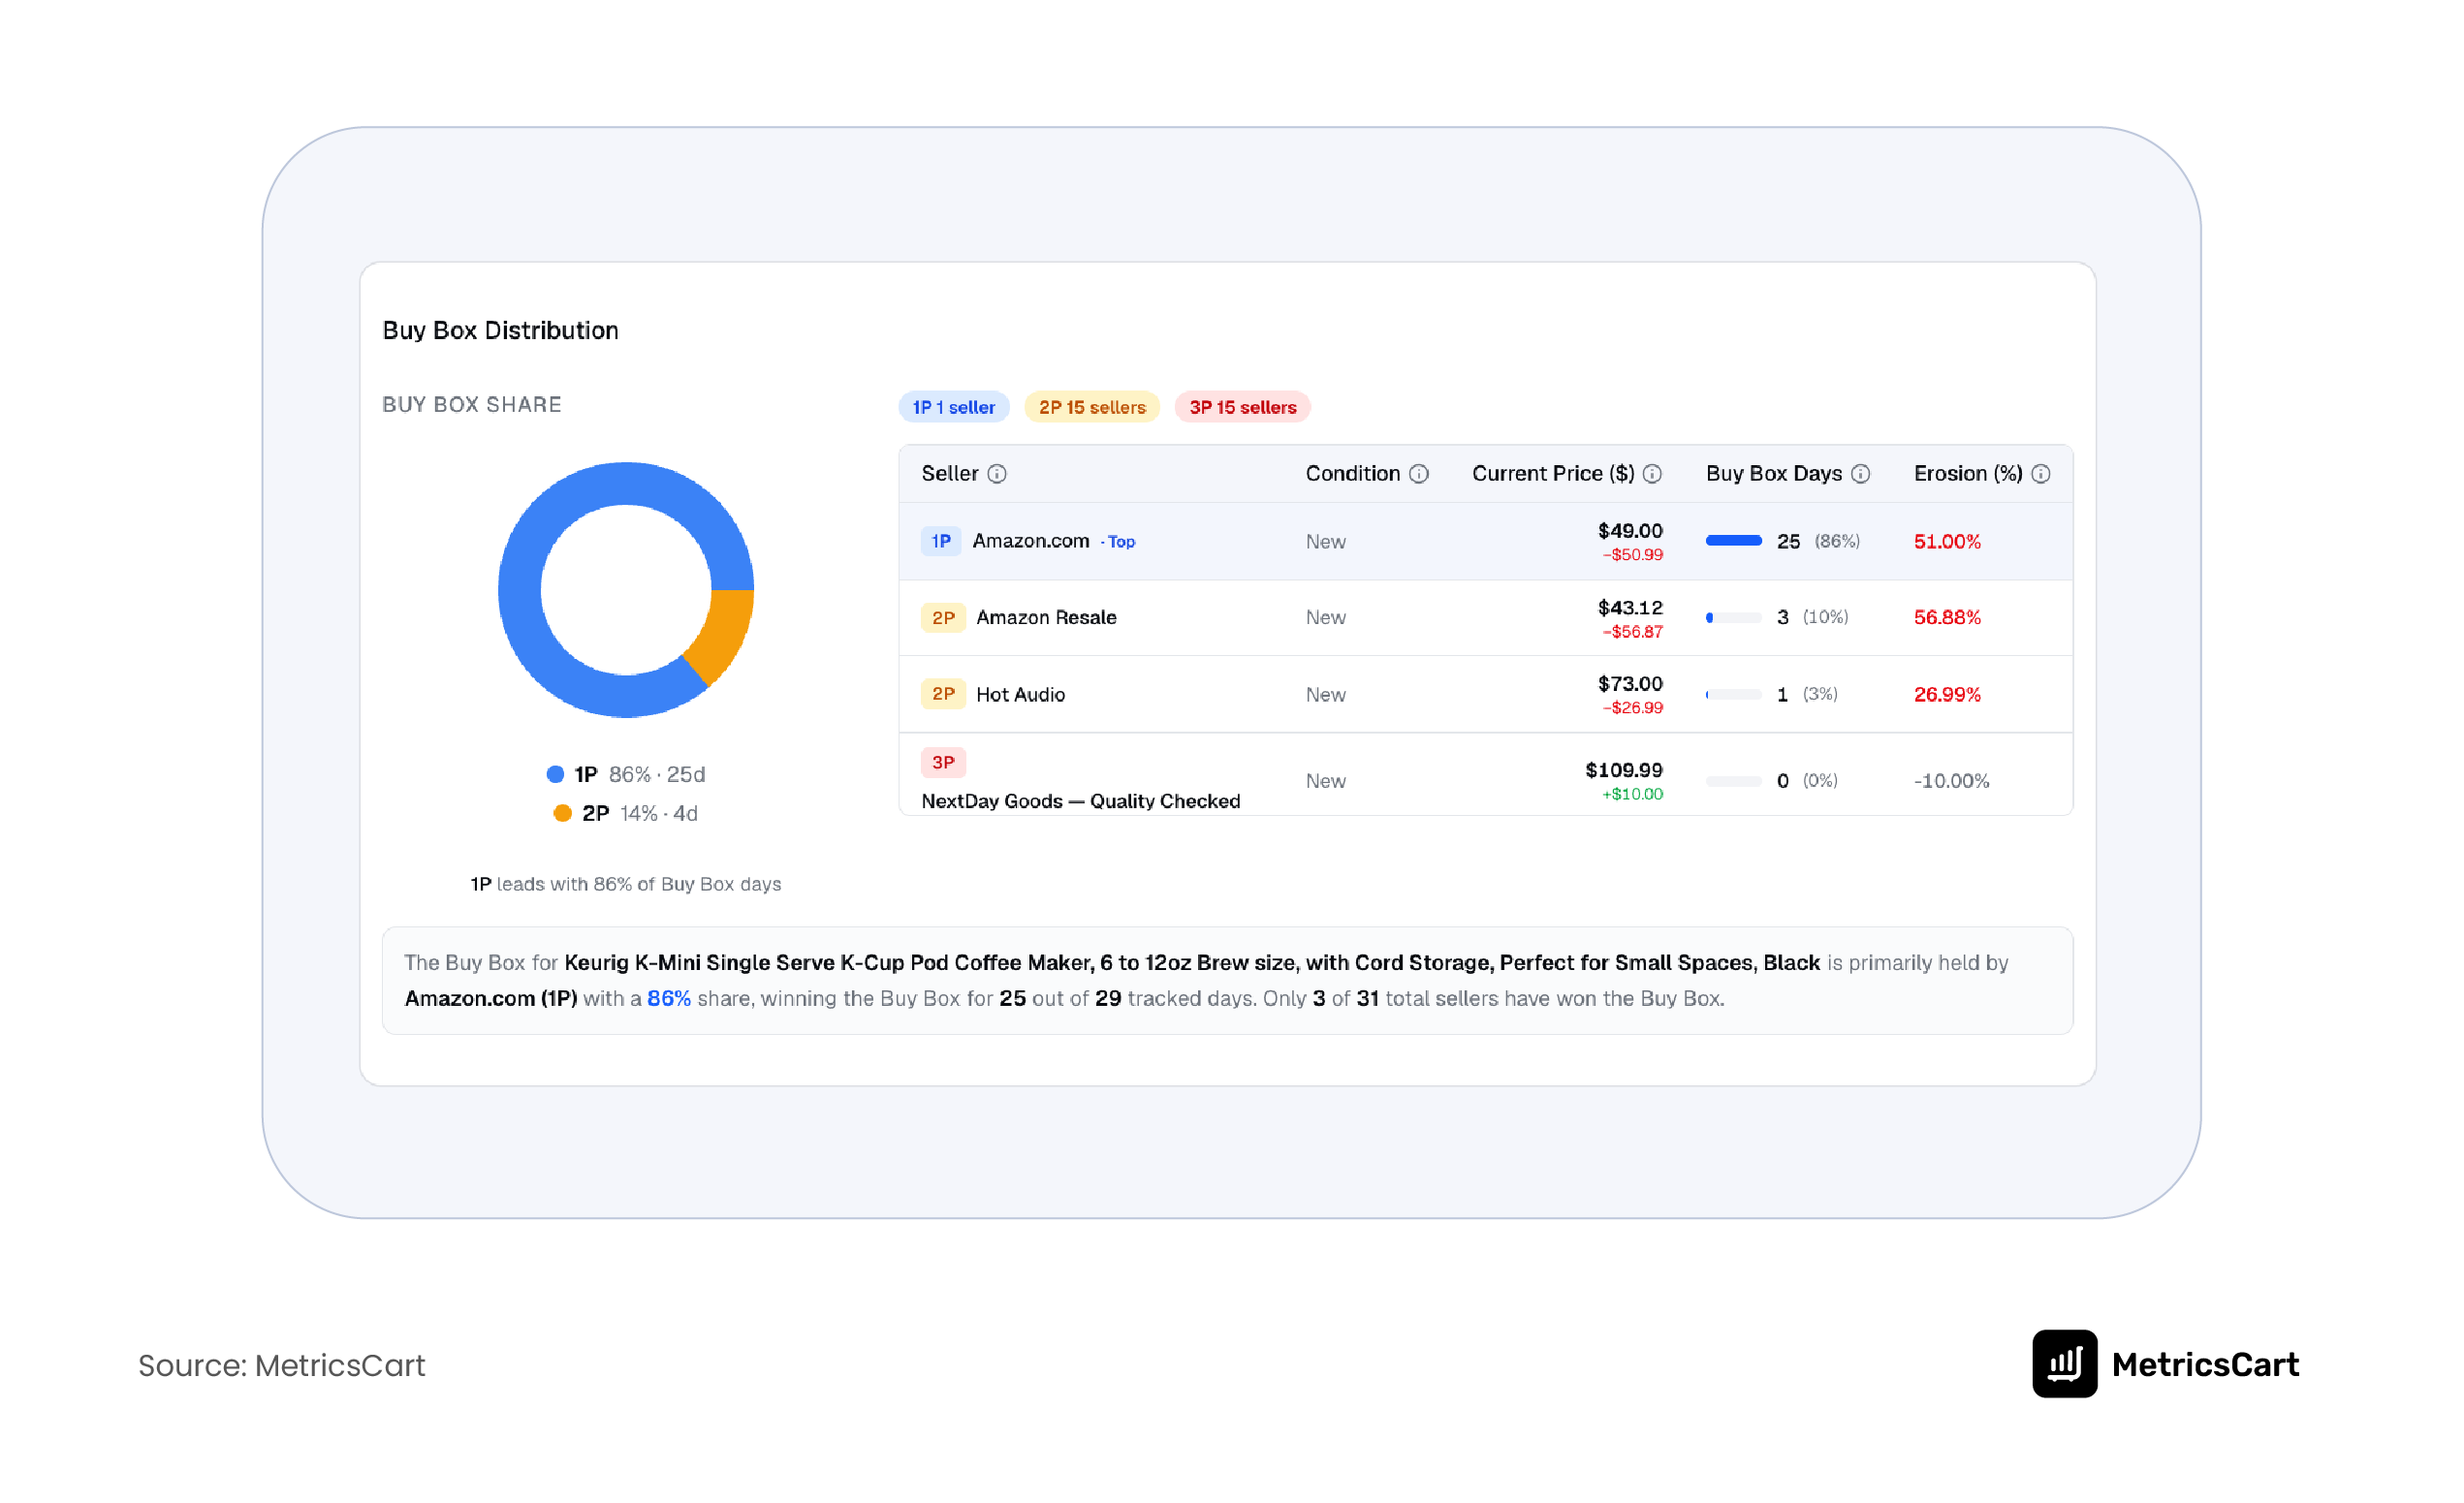
Amazon.com(1P) held the Buy Box 25 of 29 days (86%) at $49.00. 2p sellers took 4 days. No third-party seller won it, and only 3 of 31 sellers ever held it. Concentration is Controlled.
- Amazon-owned accounts hold 28 of 29 days.
- The one day an outside seller won, the price rose to $73.00.
- Amazon.com averaged $60.32 and closed at $49.00.
- Amazon-owned accounts controlled the price almost every day, so acting on third-party sellers would not change what shoppers see.
At first glance, an 86% 1P share looks like a win, with the brand’s authorized retail channel dominating. But this number alone can be misleading. It doesn’t show:
- How much the 1P listing had to drop its own price to keep winning (from $65.00 down to $49.00–$50.99 – a 51% erosion on the winning offer itself).
- How many sellers are sitting just below the surface, ready to win the Buy Box the moment 1P inventory dips or price ticks up? In this case, 2P sellers like Amazon Resale ($43.12) and Hot Audio ($73.00 base, but pricing as low as $26.99 off) are already positioned to take share.
For channel and marketplace managers, Buy Box % should never be read in isolation from price. “We’re winning the Buy Box” and “we’re winning the Buy Box at a price that’s eroded 51% from MSRP” are two very different business stories, and only one of them is sustainable.
Seller Density of Keurig K-Mini and Its Effect on Price
Seller density is the number of active sellers competing on a single listing. It is one of the earliest leading indicators of MAP erosion, often visible weeks before the price itself collapses.
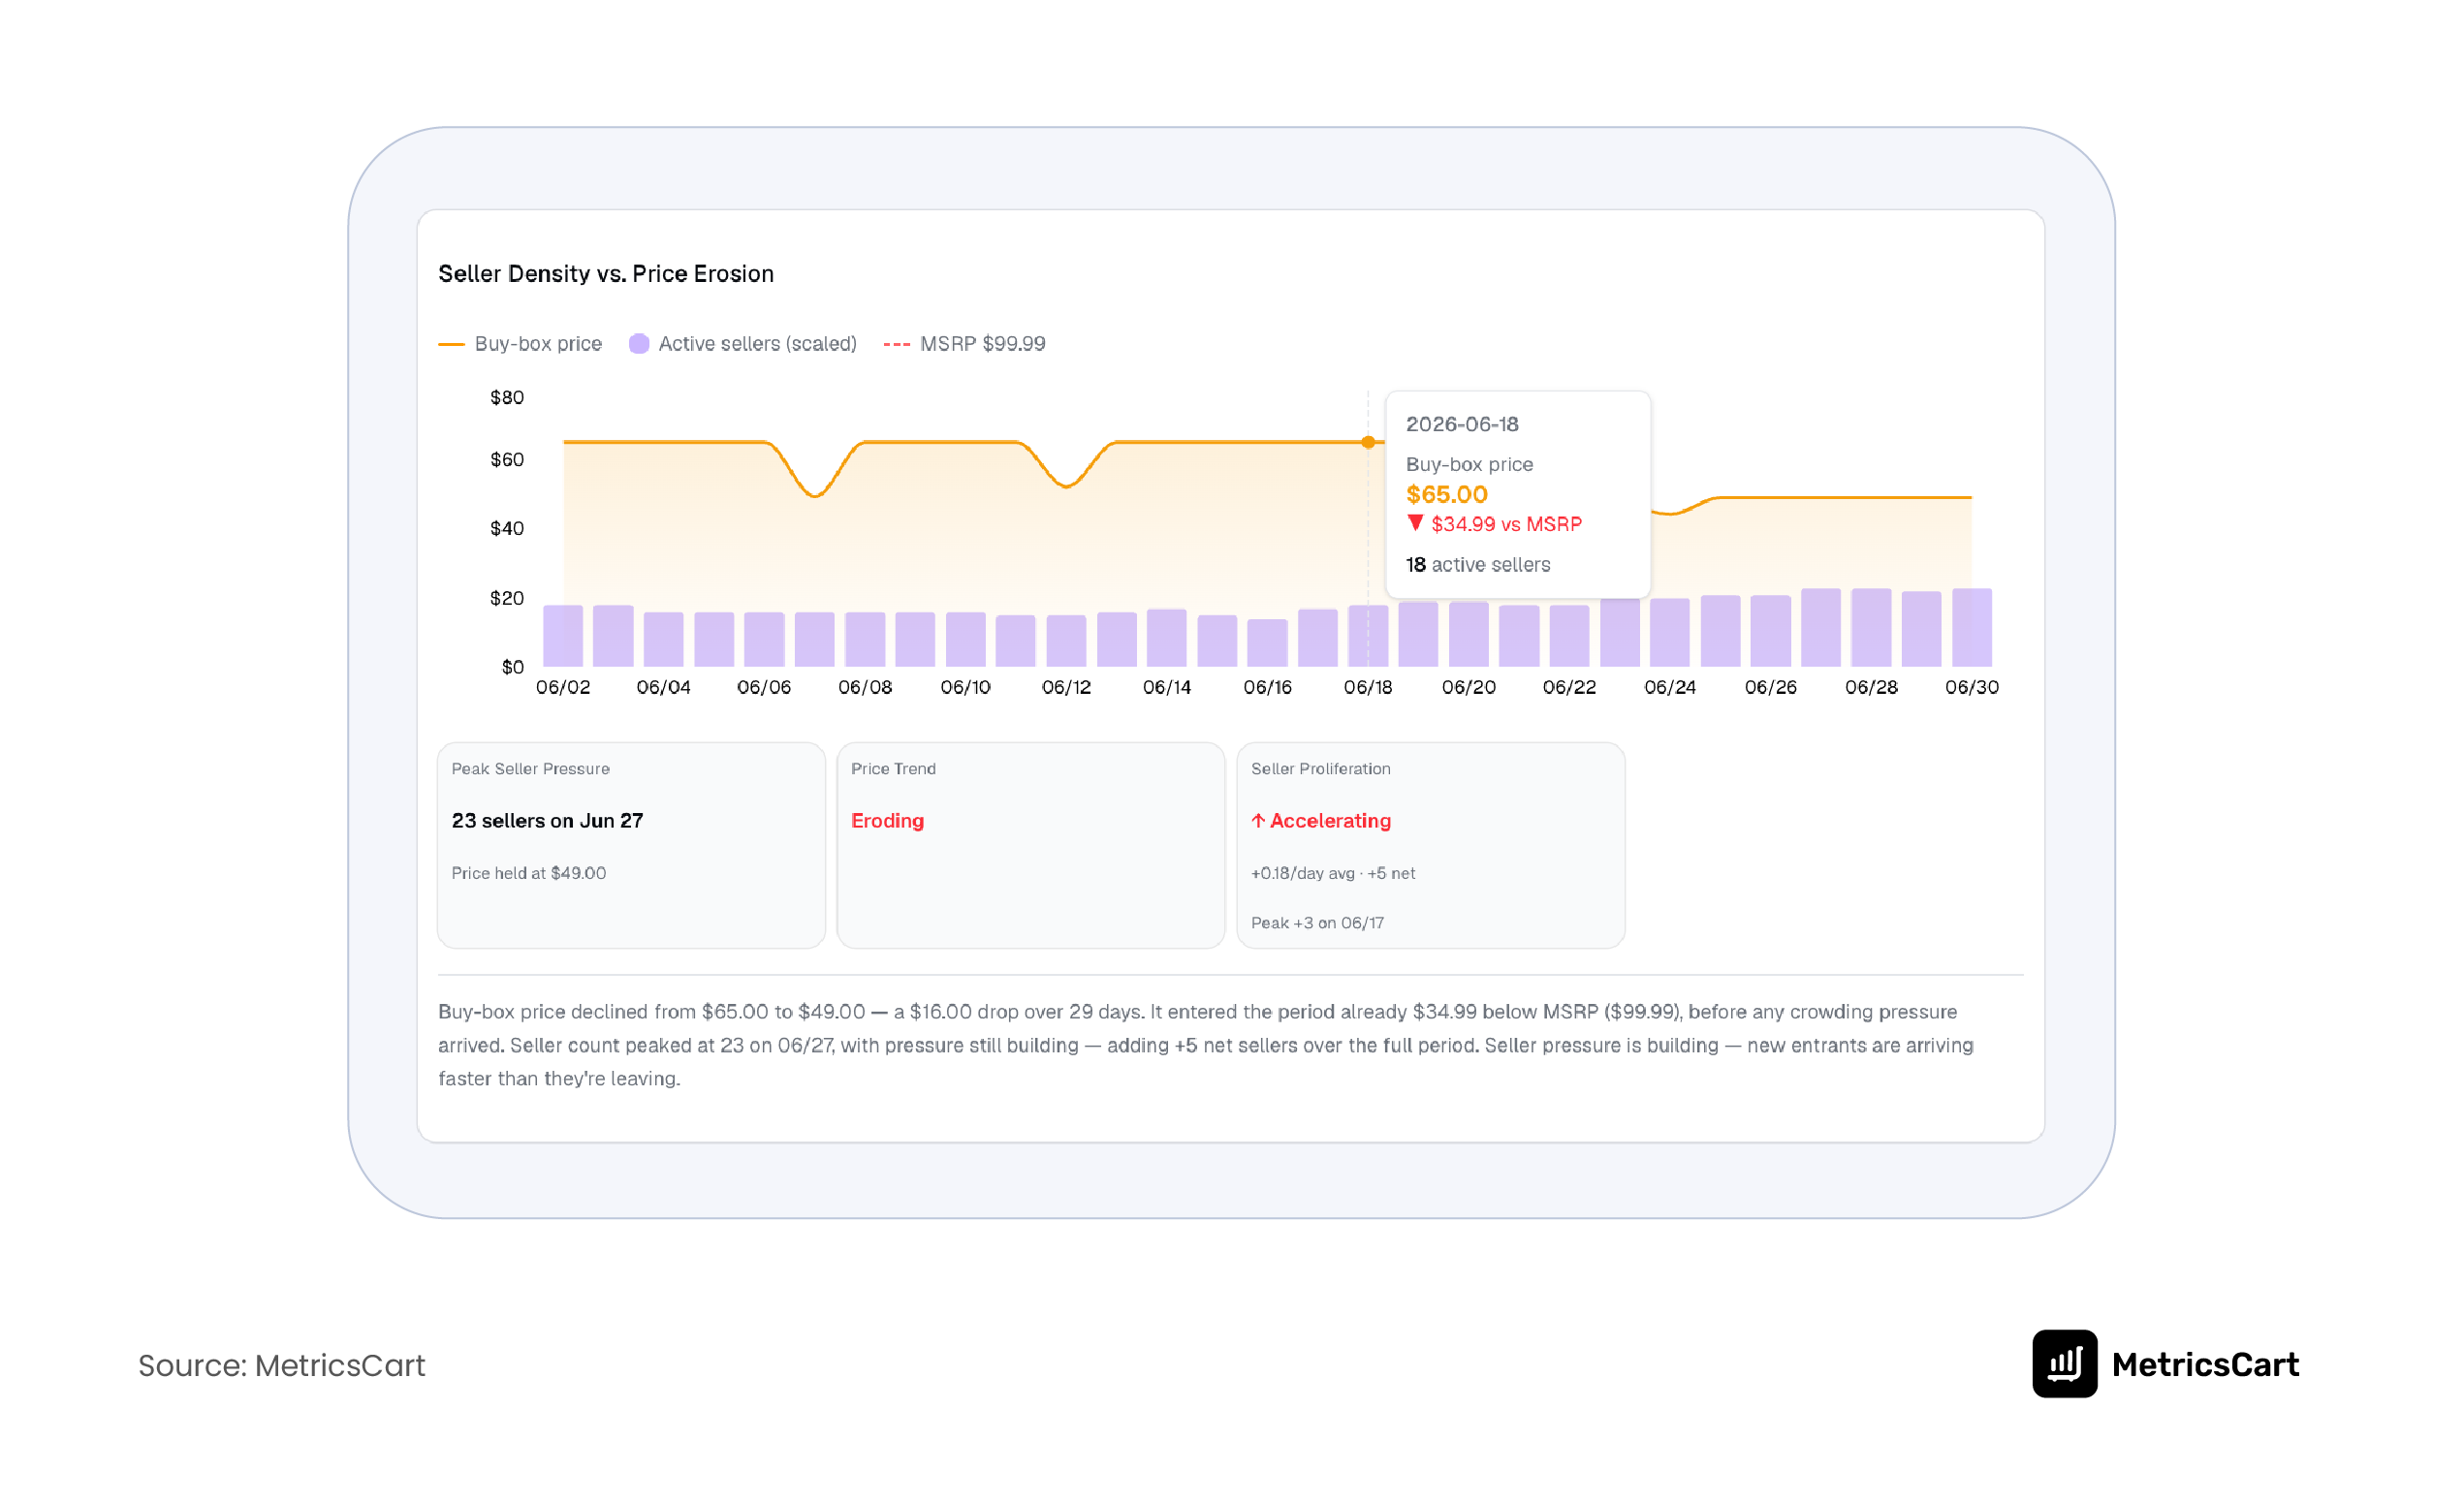
In this tracking window:
- Seller count peaked at 23 sellers on June 27
- Net seller growth was +5 over the 29-day period, with an accelerating trend of +0.18 sellers/day on average
- 2 new 3P entrants appeared in just the final days of tracking, while 1 seller exited
As seller count rises, Buy Box price tends to fall in near lock-step, because more sellers = more price competition for a fixed pool of demand = a race to the bottom on price. In this case, the correlation is clear: price fell from $65.00 to $49.00 over almost exactly the same window that seller count rose from 18 to a peak of 23.
A rising seller count on an unauthorized-looking set of sellers is one of the strongest early-warning signs of gray market diversion or unauthorized distribution well before the price data alone would flag it as “critical.”
Seller Churn of Keurig K-Mini: Entrants, Exits & Persistent Sellers
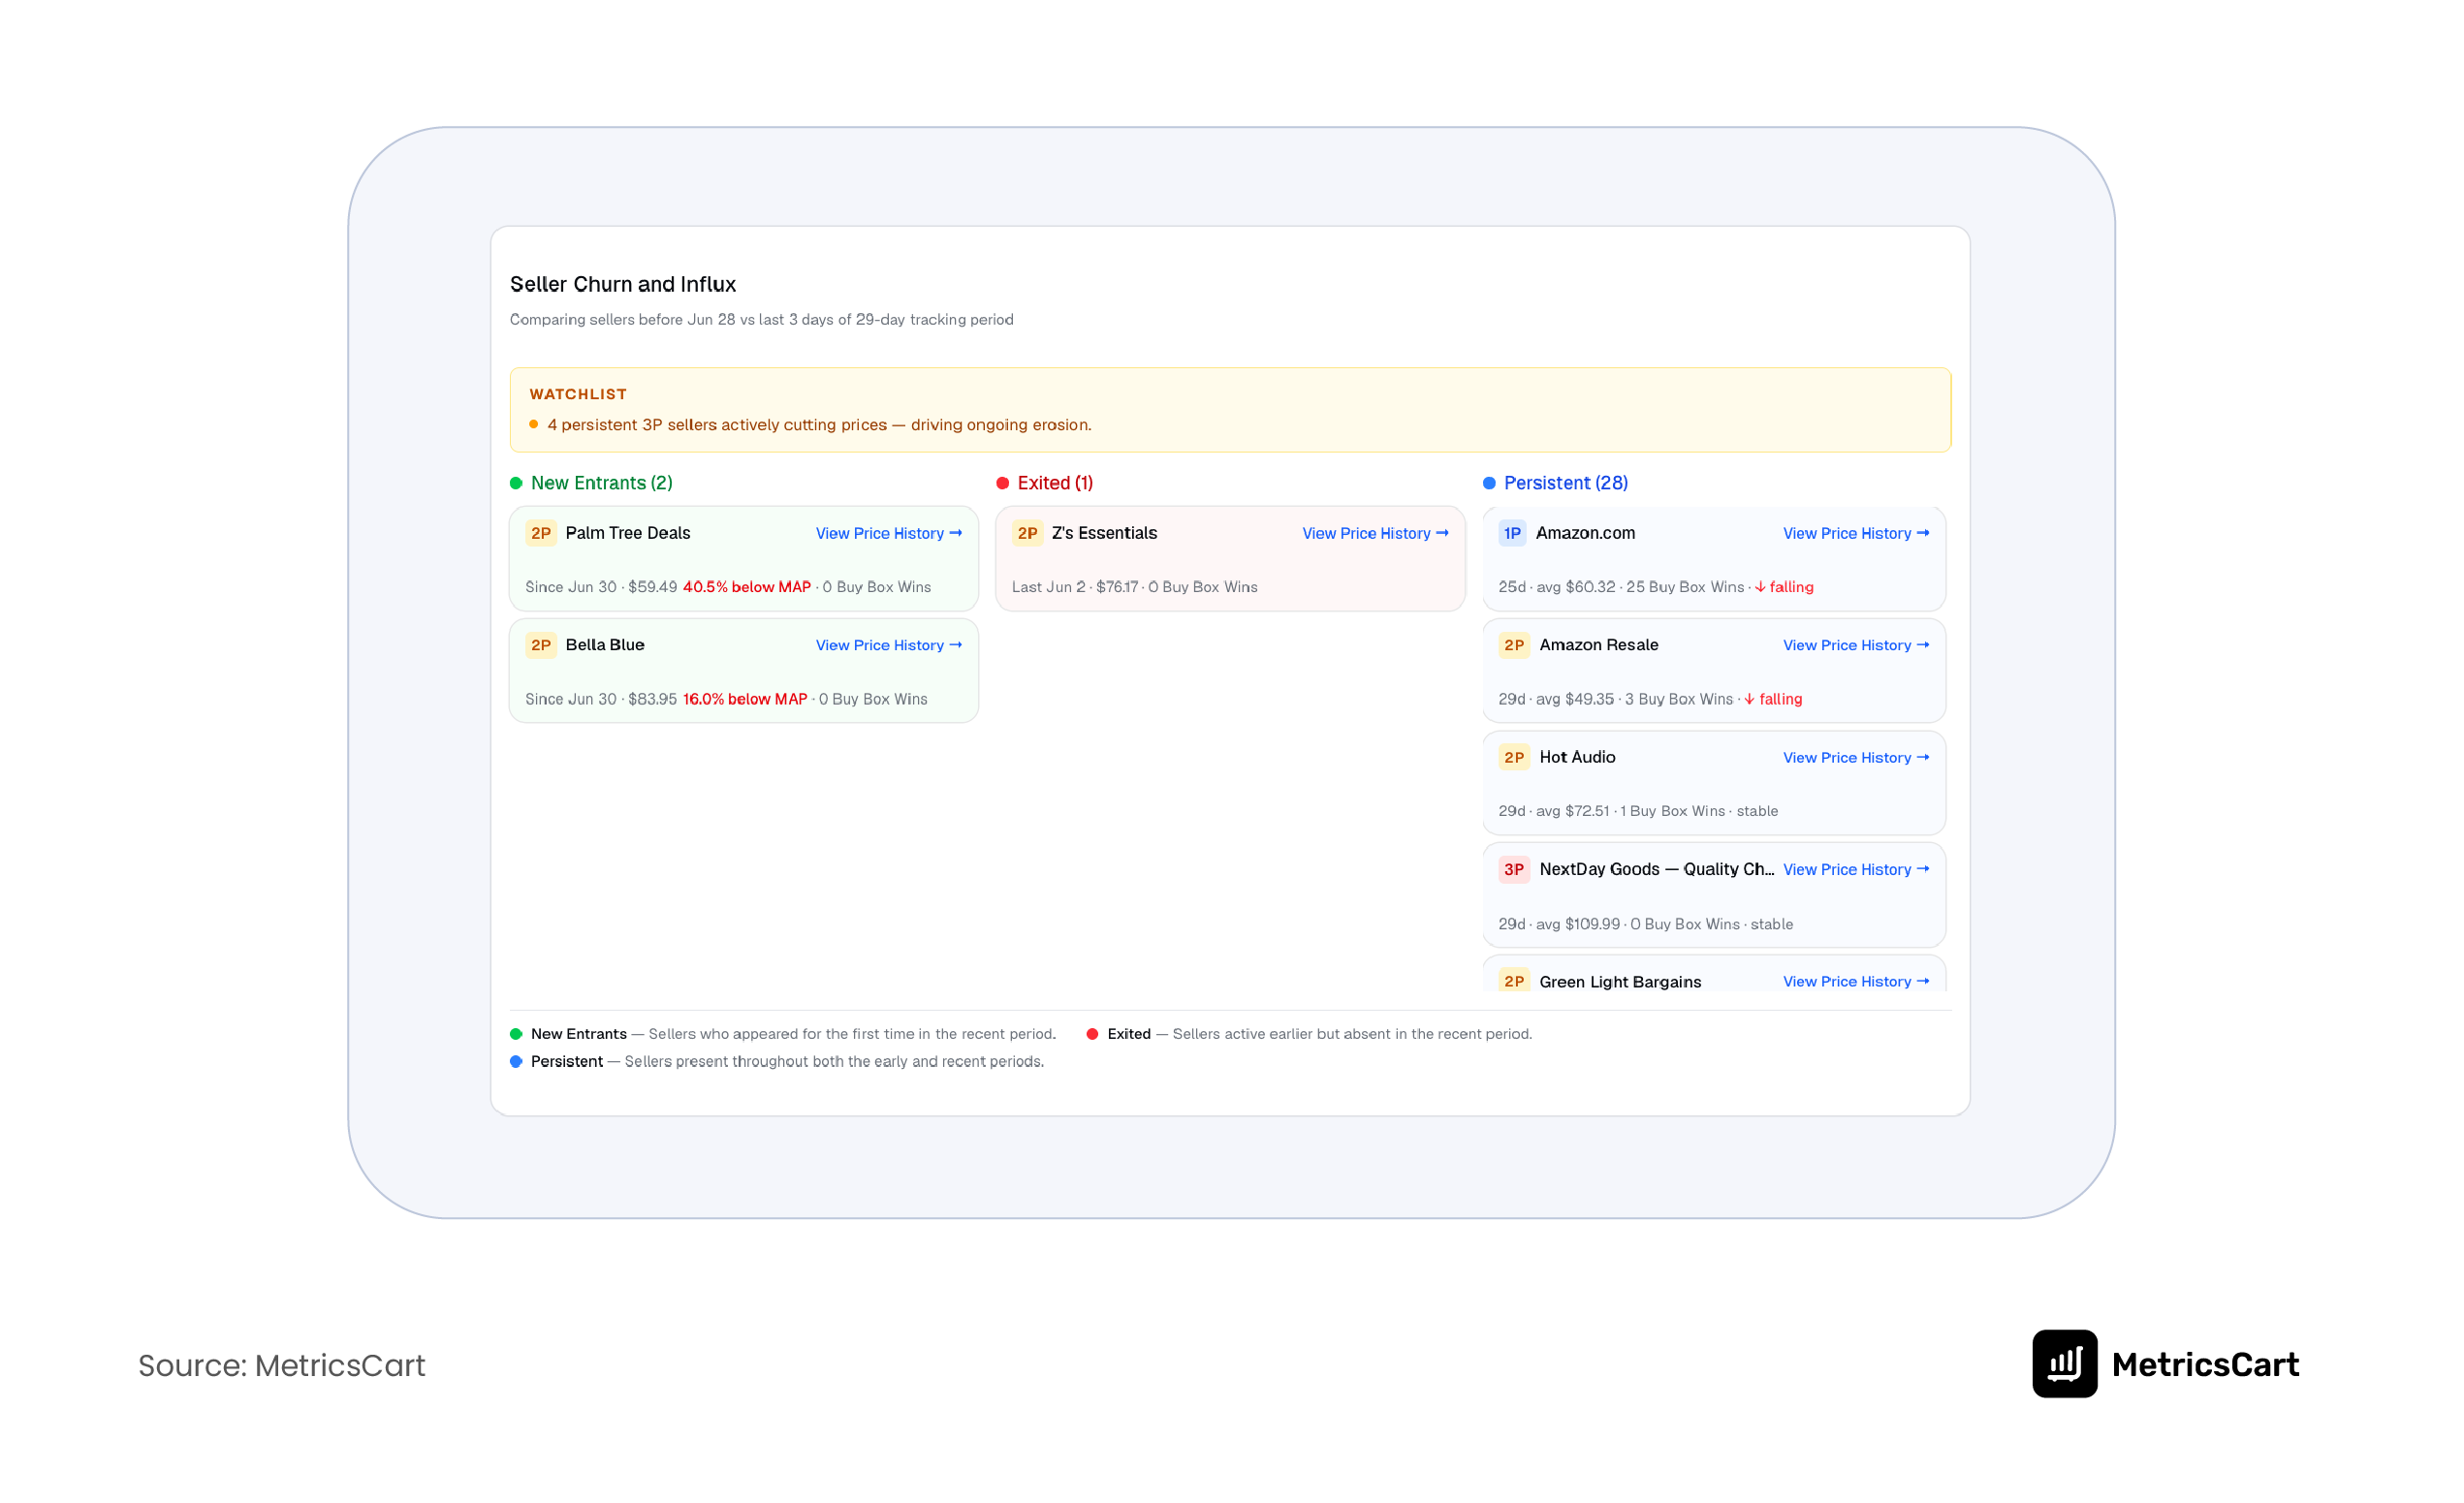
According to MetricsCart, the sellers are categorized into 3 groups: New Entrants, Exited, and Persistent.
New Entrants (2): Sellers who appeared for the first time in the recent period. Examples include Palm Tree Deals (40.5% below MAP/MSRP) and Bella Blue (16.0% below). These are the freshest enforcement targets easiest to act on before they build up Buy Box history.
Exited (1): Sellers active earlier but now gone, e.g., Z’s Essentials. Useful for confirming whether prior enforcement action actually worked.
Persistent (28): Sellers present across the entire tracking window, including several pricing consistently 40–56% below MSRP with a “falling” price trend. These are the chronic, structural problem sellers, not one-off opportunists.
A monthly report that only shows “current erosion %” misses the difference between a new problem and an entrenched one. Persistent low-price sellers with a falling trend line indicate that prior MAP enforcement (if any) has not worked, and stronger escalation is warranted.
Bestseller Chances and Buy Box Wins of Keurig K-Mini
Only 3 of 31 tracked sellers ever won the Buy Box on this listing during the entire window. That’s a heavily crowded field with almost no realistic path to Buy Box ownership for the other 28 — including any authorized reseller trying to compete on this ASIN.
Amazon’s ranking and “Bestseller” badge logic favors listings with strong, consistent Buy Box ownership and conversion. When 15 3P sellers are swarming a listing but only winning the Buy Box 0% of the time, it signals:
- Wasted seller effort and inventory sitting on a listing that can’t convert for them
- A fragmented price signal to Amazon’s algorithm, which can suppress ranking velocity
- Lower odds of the listing achieving or maintaining Bestseller status, since Buy Box churn and price volatility work against ranking stability
Recommended Actions for Coffee Machine Brands
- Immediate pricing intervention — Floor price has dropped to $44.10, a 55.9% erosion from MSRP ($99.99). This is close enough to the CRAP threshold (80%) to require action within the current reporting cycle, not the next one.
- Audit distribution channels — 15 active 3P sellers on a single listing signals broad, likely unauthorized distribution. Trace inventory sourcing before it worsens.
- Escalate directly with Amazon — Persistent sellers pricing 50%+ below MSRP with a falling trend (not a one-time dip) justify a formal case with Amazon’s Brand Registry or MAP enforcement channels.
- Track Net PPM monthly, not just erosion % — Convert erosion into a margin-dollar figure for leadership reporting so pricing issues are read as P&L issues.
- Watch the seller density trend line — At +0.18 sellers/day and accelerating, this listing is trending toward, not away from, further erosion. Re-check before the next reporting cycle.
Appendix A: How This Was Tracked
MetricsCart checked the listing every day on Amazon US over the 29 days, using its Digital Shelf Analytics and MAP Monitoring software. For each check, the Buy Box was recorded against the seller showing at that moment.
Every seller was logged by type (1P, 2P, 3P), along with days active, price, and Buy Box wins. Prices were taken daily in US dollars, including coupon and promo prices where shown. All comparisons use the $99.99 MSRP, since no MAP floor was provided.
Appendix B: Evidence & Limitations
- Covers June 2 to June 30, 2026 only, based entirely on what was observed on amazon.com/dp/B07GV2S1GS.
- MSRP ($99.99) is the reference point, since no MAP was available for this SKU.
- The 55.9% figure is measured from the $44.10 Buy Box floor; the lowest listing, Amazon Resale at $43.12, is 56.9% under MSRP.
- Cost figures depend on the unit volume the brand provides; the per-unit gap is fixed at $50.99.
- Read these recommendations alongside the brand’s own pricing and distribution rules.