Best The Eggmazing Egg Decorator products on Amazon in April 2025
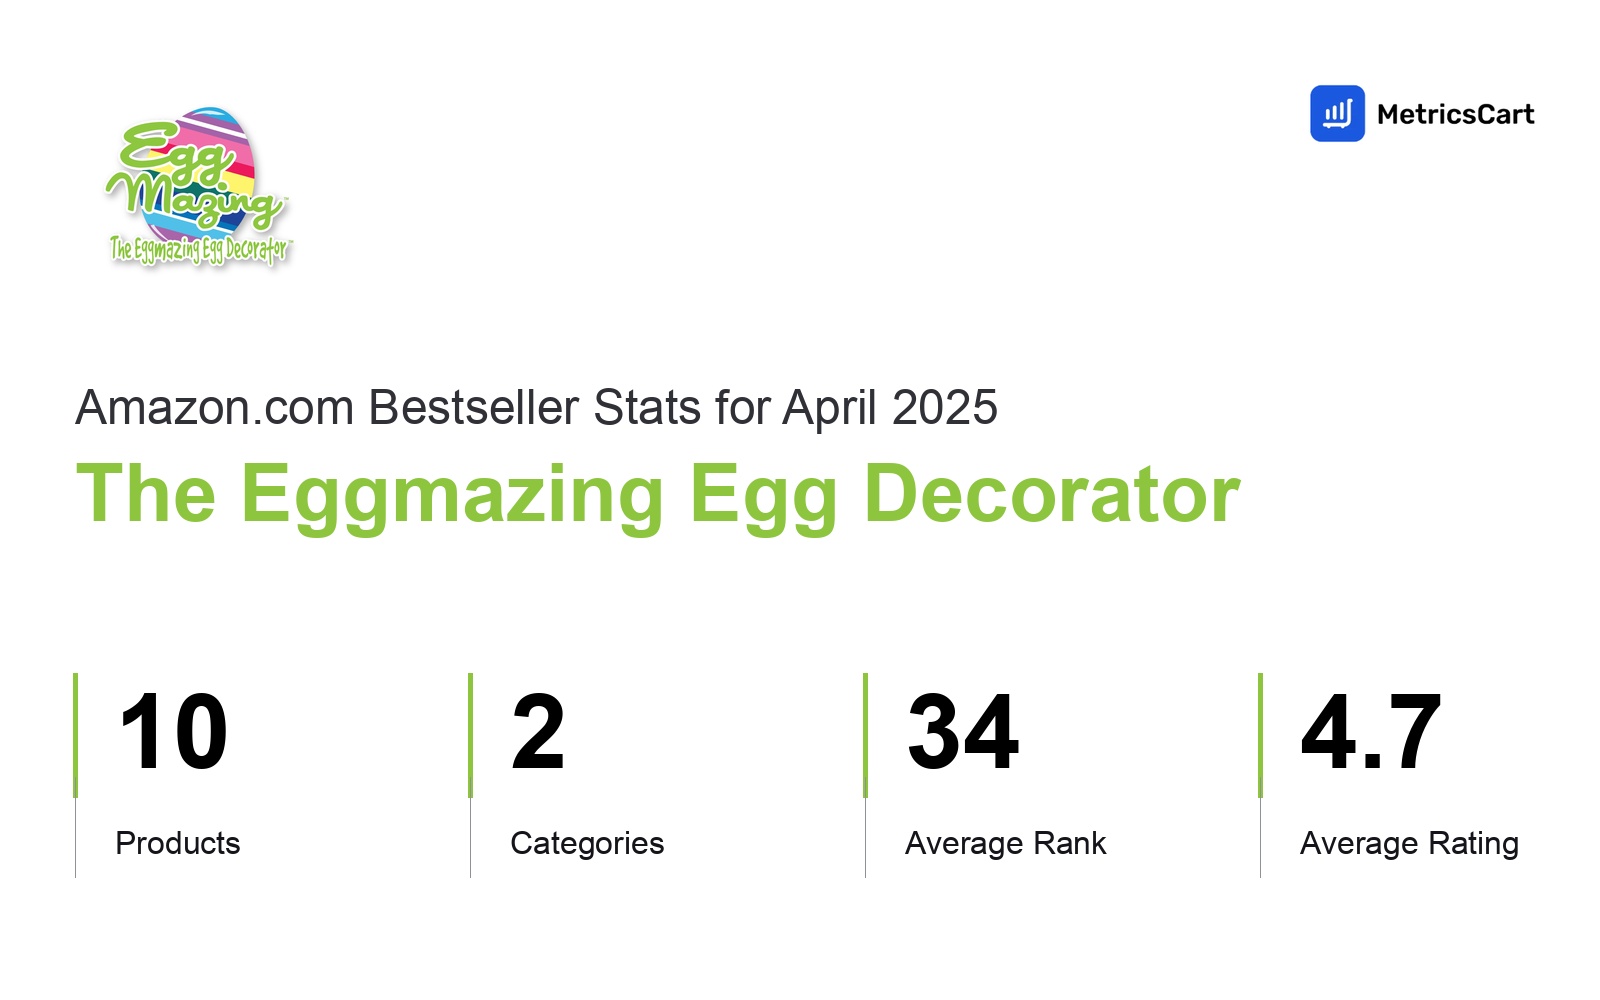
In April 2025, The Eggmazing Egg Decorator appeared on Amazon's bestseller lists with 10 unique products across 2 categories. These products appeared in categories including Arts, Crafts & Sewing and Toys & Games. The brand's products on the bestseller lists were priced between $8.97 and $27.99, with an average price of $20.56. These bestselling products maintained an average rating of 4.7 based on 26K total ratings from customers who purchased products that appeared on the bestseller lists.
Products
Categories
Average Price
Average Rank
Category Performance
Detailed metrics by category-product count, rank, price, and ratings-offer a quick view of how brands stack up on the Amazon digital shelf.
Considering the data across product categories, the Toys & Games category is a clear leader, exhibiting the highest product volume (7 listings), the highest average price ($21.56), and the strongest customer ratings (4.7 stars).
| Category | Products | Average Rank | Average Price | Rating |
|---|---|---|---|---|
7 | 32.4 3 — 88 | $21.56 $17.95 — $27.99 | 4.7 (23,852 ratings) | |
3 | 43.9 21 — 72 | $11.98 $8.97 — $19.99 | 4.7 (1,961 ratings) |
Top Products
Products are ranked by performance, price, and customer rating. This helps e-commerce teams find the top performer among a brand's Amazon listings. The highest average rank is 5.0, and the lowest is 72.0. The highest-rated product has 4.8 stars, while the lowest is 4.6 stars. In terms of pricing, the highest is $23.92, and the lowest is $10.17.
| Product | Average Rank | Average Price | Rating |
|---|---|---|---|
21.2 3 — 67 | $18.95 $17.95 — $19.97 | 4.7 (7,250 ratings) | |
42 9 — 82 | $23.81 $19.97 — $27.99 | 4.6 (8,909 ratings) | |
20.2 9 — 38 | $19.99 | 4.7 (810 ratings) | |
5 3 — 6 | $23.92 $19.99 — $27.99 | 4.8 (838 ratings) | |
13.8 7 — 29 | $23.08 $22.37 — $23.79 | 4.8 (872 ratings) | |
34.2 21 — 57 | $10.17 $8.97 — $12.99 | 4.7 (655 ratings) | |
64.8 51 — 88 | $22.37 | 4.8 (924 ratings) | |
66.7 49 — 79 | $19.44 $17.97 — $22.37 | 4.7 (4,249 ratings) | |
64 | $12.99 | 4.7 (655 ratings) | |
72 | $19.99 | 4.7 (651 ratings) |
Content Compliance
Focusing on text, video, and image content, as well as the overall content score, this analysis guides the brand in meeting Amazon's content benchmarks and improving product visibility.
The values shown are median figures. The average title length across this brand is 160 characters. Additionally, the average count of images and videos in the Amazon bestseller product listings for this brand is 7 images and 8 videos.
Title
Title Length
Title Score

No Special Characters

Proper Capitalization

Product Identification

Character Count
Spelling & Grammar
Proper Numerals
Content
Total Score

Bullet Points
Bullet Average Length
Has Enhanced Content
Images
Total Images
Graphics Images
Silo Images
Alternate Images
Lifestyle Images
Centered
No White Border

Full Bleed

Not Enlarged
Valid Dimensions
Has 360° Images
Videos
Total Videos
Has Videos
About Amazon Best Seller Category Reports
Our Amazon Bestseller Brand Monthly Reports track key changes in product performance on the Amazon digital shelf, giving e-commerce teams a clear view of market shifts. Using our machine learning model, we analyze your brand's performance on the Amazon digital shelf, helping you stay ahead. Brands already relying on this information are better equipped to optimize their strategies and improve their competitive positioning.
Disclaimer: Data on this page is based on publicly available amazon.com information and compiled using proprietary analysis. All trademarks and brand names belong to their owners. This report is for informational purposes only and is not endorsed by Amazon or featured brands.