Best Mkeke products on Amazon in October 2025
Share :
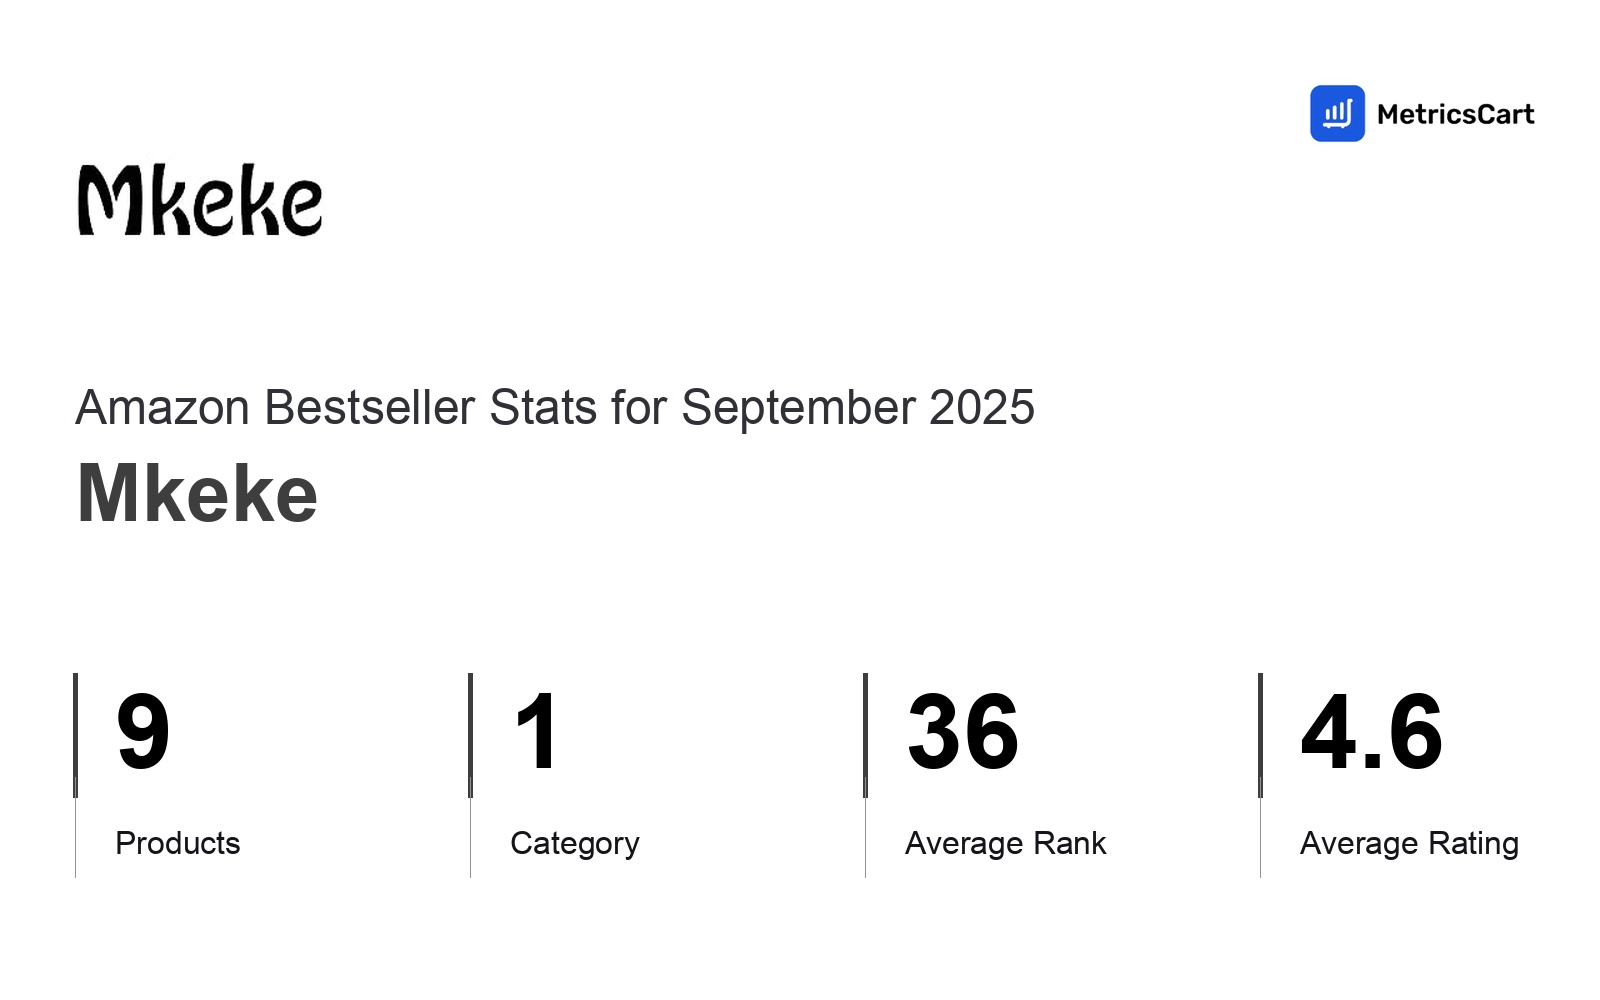
7
Products
1
Categories
$9.99
Average Price
36.3
Average Rank
Category Performance
| Category | Products | Average Rank | Average Price | Rating |
|---|---|---|---|---|
7 | 36.3 13 — 90 | $9.99 | 4.6 (964,569 ratings) |
Top Products
| Product | Average Rank | Average Price | Rating | |
|---|---|---|---|---|
14.6 13 — 18 | $9.99 | 4.7 (126,973 ratings) | ||
28 21 — 35 | $9.99 | 4.5 (210,085 ratings) | ||
23.7 20 — 28 | $9.99 | |||
21.8 17 — 24 | $9.99 | 4.6 (209,245 ratings) | ||
19.5 19 — 20 | $9.99 | 4.5 (210,008 ratings) | ||
66.8 49 — 90 | $9.99 | 4.6 (123,188 ratings) | ||
69.5 48 — 84 | $9.99 | 4.6 (85,070 ratings) |
Content Compliance
Title
Title Length
165characters (median)
Distribution of title character lengths. Longer bars indicate more products in that range.
152-160
29%
160-168
29%
168-176
14%
176-184
14%
184-192
14%
Title Score
64/ 100
Distribution of title scores. Longer bars indicate more products in that range.

No Special Characters
Title should not contain disallowed special characters

Proper Capitalization
Title should use proper capitalization for words
Product Identification
Title should include key product identifying information

Character Count
Title should have an appropriate character count
Spelling & Grammar
Title should have correct spelling and grammar

Proper Numerals
Title should use numerals correctly
Content
Total Score
53/ 100
Distribution of total scores. Longer bars indicate more products in that range.

Description Length
393characters (median)
Distribution of description character lengths. Longer bars indicate more products in that range.
0-100
43%
100-200
0%
200-300
0%
300-400
14%
400-500
43%
Bullet Points
5points (median)
Distribution of bullet point counts. Longer bars indicate more products in that range.
4-5
14%
5-6
43%
6-7
43%
Bullet Average Length
141.9characters (median)
Distribution of average bullet point character lengths. Longer bars indicate more products in that range.
78-104
14%
104-130
29%
130-156
29%
156-182
14%
182-208
0%
208-234
14%
Has Enhanced Content
Product should have enhanced content
Images
Total Images
7images (median)
Distribution of total image counts. Longer bars indicate more products in that range.
6-7
14%
7-8
86%
Graphics Images
5images (median)
Distribution of graphics image counts. Longer bars indicate more products in that range.
4-5
29%
5-6
71%
Silo Images
1images (median)
Distribution of silo image counts. Longer bars indicate more products in that range.
0-1
100%
Alternate Images
6images (median)
Distribution of alternate image counts. Longer bars indicate more products in that range.
5-6
14%
6-7
86%
Lifestyle Images
1images (median)
Distribution of lifestyle image counts. Longer bars indicate more products in that range.
0-1
100%
Detail Images
1images (median)
Distribution of detail image counts. Longer bars indicate more products in that range.
0-1
43%
1-2
57%
Centered
Product should be centered in the image

No White Border
Image should not have a white border
Full Bleed
Image should use full bleed (extend to edges)

Not Enlarged
Image should not be artificially enlarged
Valid Dimensions
Image should have valid pixel dimensions
Has 360° Images
Product should have 360-degree images
Videos
Total Videos
5videos (median)
Distribution of video counts. Longer bars indicate more products in that range.
0-2
29%
2-4
0%
4-6
71%
Has Videos
Product should have videos
About Amazon Best Seller Category Reports
Our Amazon Bestseller Brand Monthly Reports track key changes in product performance on the Amazon digital shelf, giving e-commerce teams a clear view of market shifts. Using our machine learning model, we analyze your brand's performance on the Amazon digital shelf, helping you stay ahead. Brands already relying on this information are better equipped to optimize their strategies and improve their competitive positioning.
Disclaimer: Data on this page is based on publicly available amazon.com information and compiled using proprietary analysis. All trademarks and brand names belong to their owners. This report is for informational purposes only and is not endorsed by Amazon or featured brands.