Best Samsung products on Amazon UK in September 2025
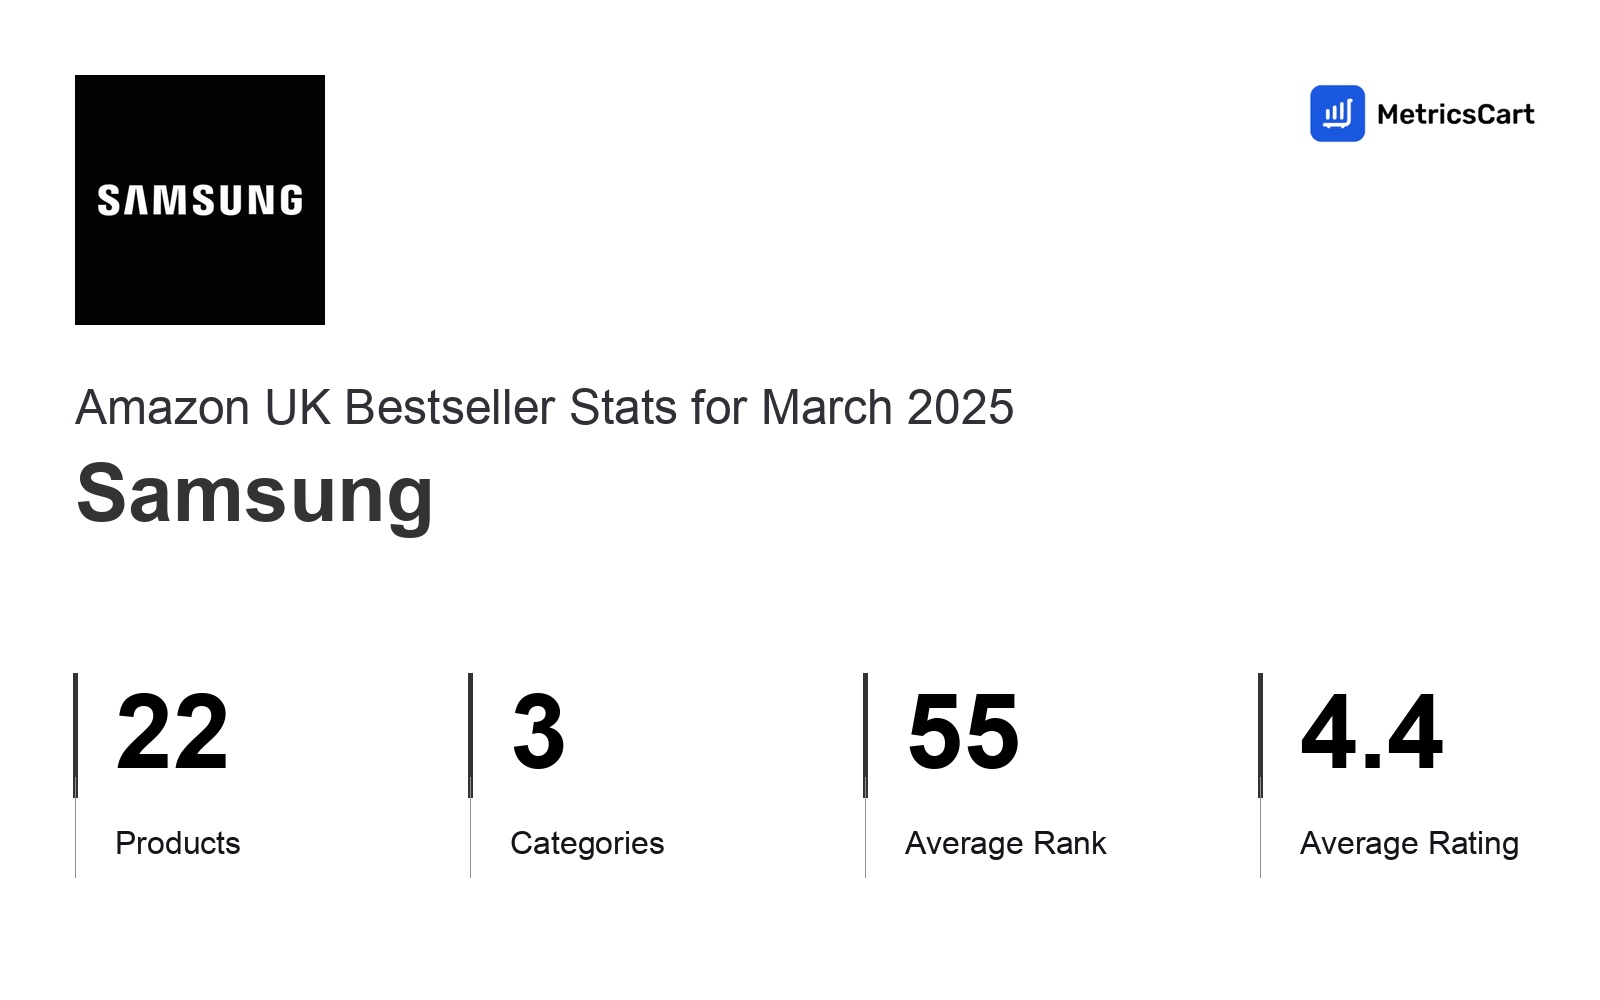
Products
Categories
Average Price
Average Rank
Category Performance
| Category | Products | Average Rank | Average Price | Rating |
|---|---|---|---|---|
14 | 45.9 6 — 98 | £387.2 £179 — £499 | 4.4 (3,639 ratings) | |
3 | 61.4 36 — 98 | £67.49 £49 — £105 | 4.4 (8,196 ratings) | |
3 | 73 40 — 99 | £161.34 £122.99 — £259 | 4.6 (15,430 ratings) | |
1 | 99.5 99 — 100 | £49 | 4.3 (3,912 ratings) |
Top Products
| Product | Average Rank | Average Price | Rating |
|---|---|---|---|
26.1 6 — 72 | £314 £299 — £319 | 4.5 (491 ratings) | |
48.8 10 — 86 | £417.81 £337.99 — £464 | 4.6 (473 ratings) | |
46.5 28 — 92 | £429 | 4.3 (244 ratings) | |
34.1 20 — 68 | £483 £469 — £499 | 4.5 (225 ratings) | |
53.7 36 — 75 | £67.45 £67 — £67.55 | 4.4 (2,227 ratings) | |
56.5 21 — 98 | £479 | 4.4 (229 ratings) | |
66.7 40 — 86 | £174.79 £146.99 — £259 | 4.3 (75 ratings) | |
43.5 36 — 63 | £499 | 4.5 (228 ratings) | |
47.3 23 — 69 | £377.16 | 4.4 (209 ratings) | |
58.8 26 — 81 | 4.1 (74 ratings) |
About Amazon UK Best Seller Category Reports
Our Amazon UK Bestseller Brand Monthly Reports track key changes in product performance on the Amazon digital shelf, giving e-commerce teams a clear view of market shifts. Using our machine learning model, we analyze your brand's performance on the Amazon digital shelf, helping you stay ahead. Brands already relying on this information are better equipped to optimize their strategies and improve their competitive positioning.
Disclaimer: Data on this page is based on publicly available amazon.co.uk information and compiled using proprietary analysis. All trademarks and brand names belong to their owners. This report is for informational purposes only and is not endorsed by Amazon UK or featured brands.