About the Report
This Digital Shelf Insights report compares Nike and HOKA’s performance on Amazon US, focusing on how product assortment, pricing, reviews, and visibility influence marketplace success.
Using the MetricsCart Digital Shelf Analytics platform, we analyzed 7,467 Nike products and 4,038 HOKA products listed on Amazon US between December 7, 2025, and January 6, 2026.
The goal is to understand how both brands compete on the digital shelf and what their strategies reveal about the broader footwear marketplace.
Introduction
In 2025, the global athletic footwear market reached $88.81 billion and is expected to grow to $120.19 billion by 2030. As the market grows, it gets harder for brands to stand out.
A lot of this competition now plays out on Amazon. Shoppers compare products, check prices, read reviews, and move between brands quickly. What they see on the digital shelf often shapes what they end up buying.
This is where Nike and HOKA stand out.
Nike competes with scale. It covers multiple categories, price points, and use cases, which helps it stay visible across a wide range of searches. Its ecosystem, Nike Run Club, Nike Training Club, and SNKRS, along with campaigns like Just Do It and You Can’t Stop Us, keeps the brand consistently present.
HOKA takes a more focused route. It centers on comfort and performance, with a tighter, more premium product range. Campaigns like Fly Human Fly, along with collaborations and growing brand attention, have helped it expand beyond running into everyday wear.
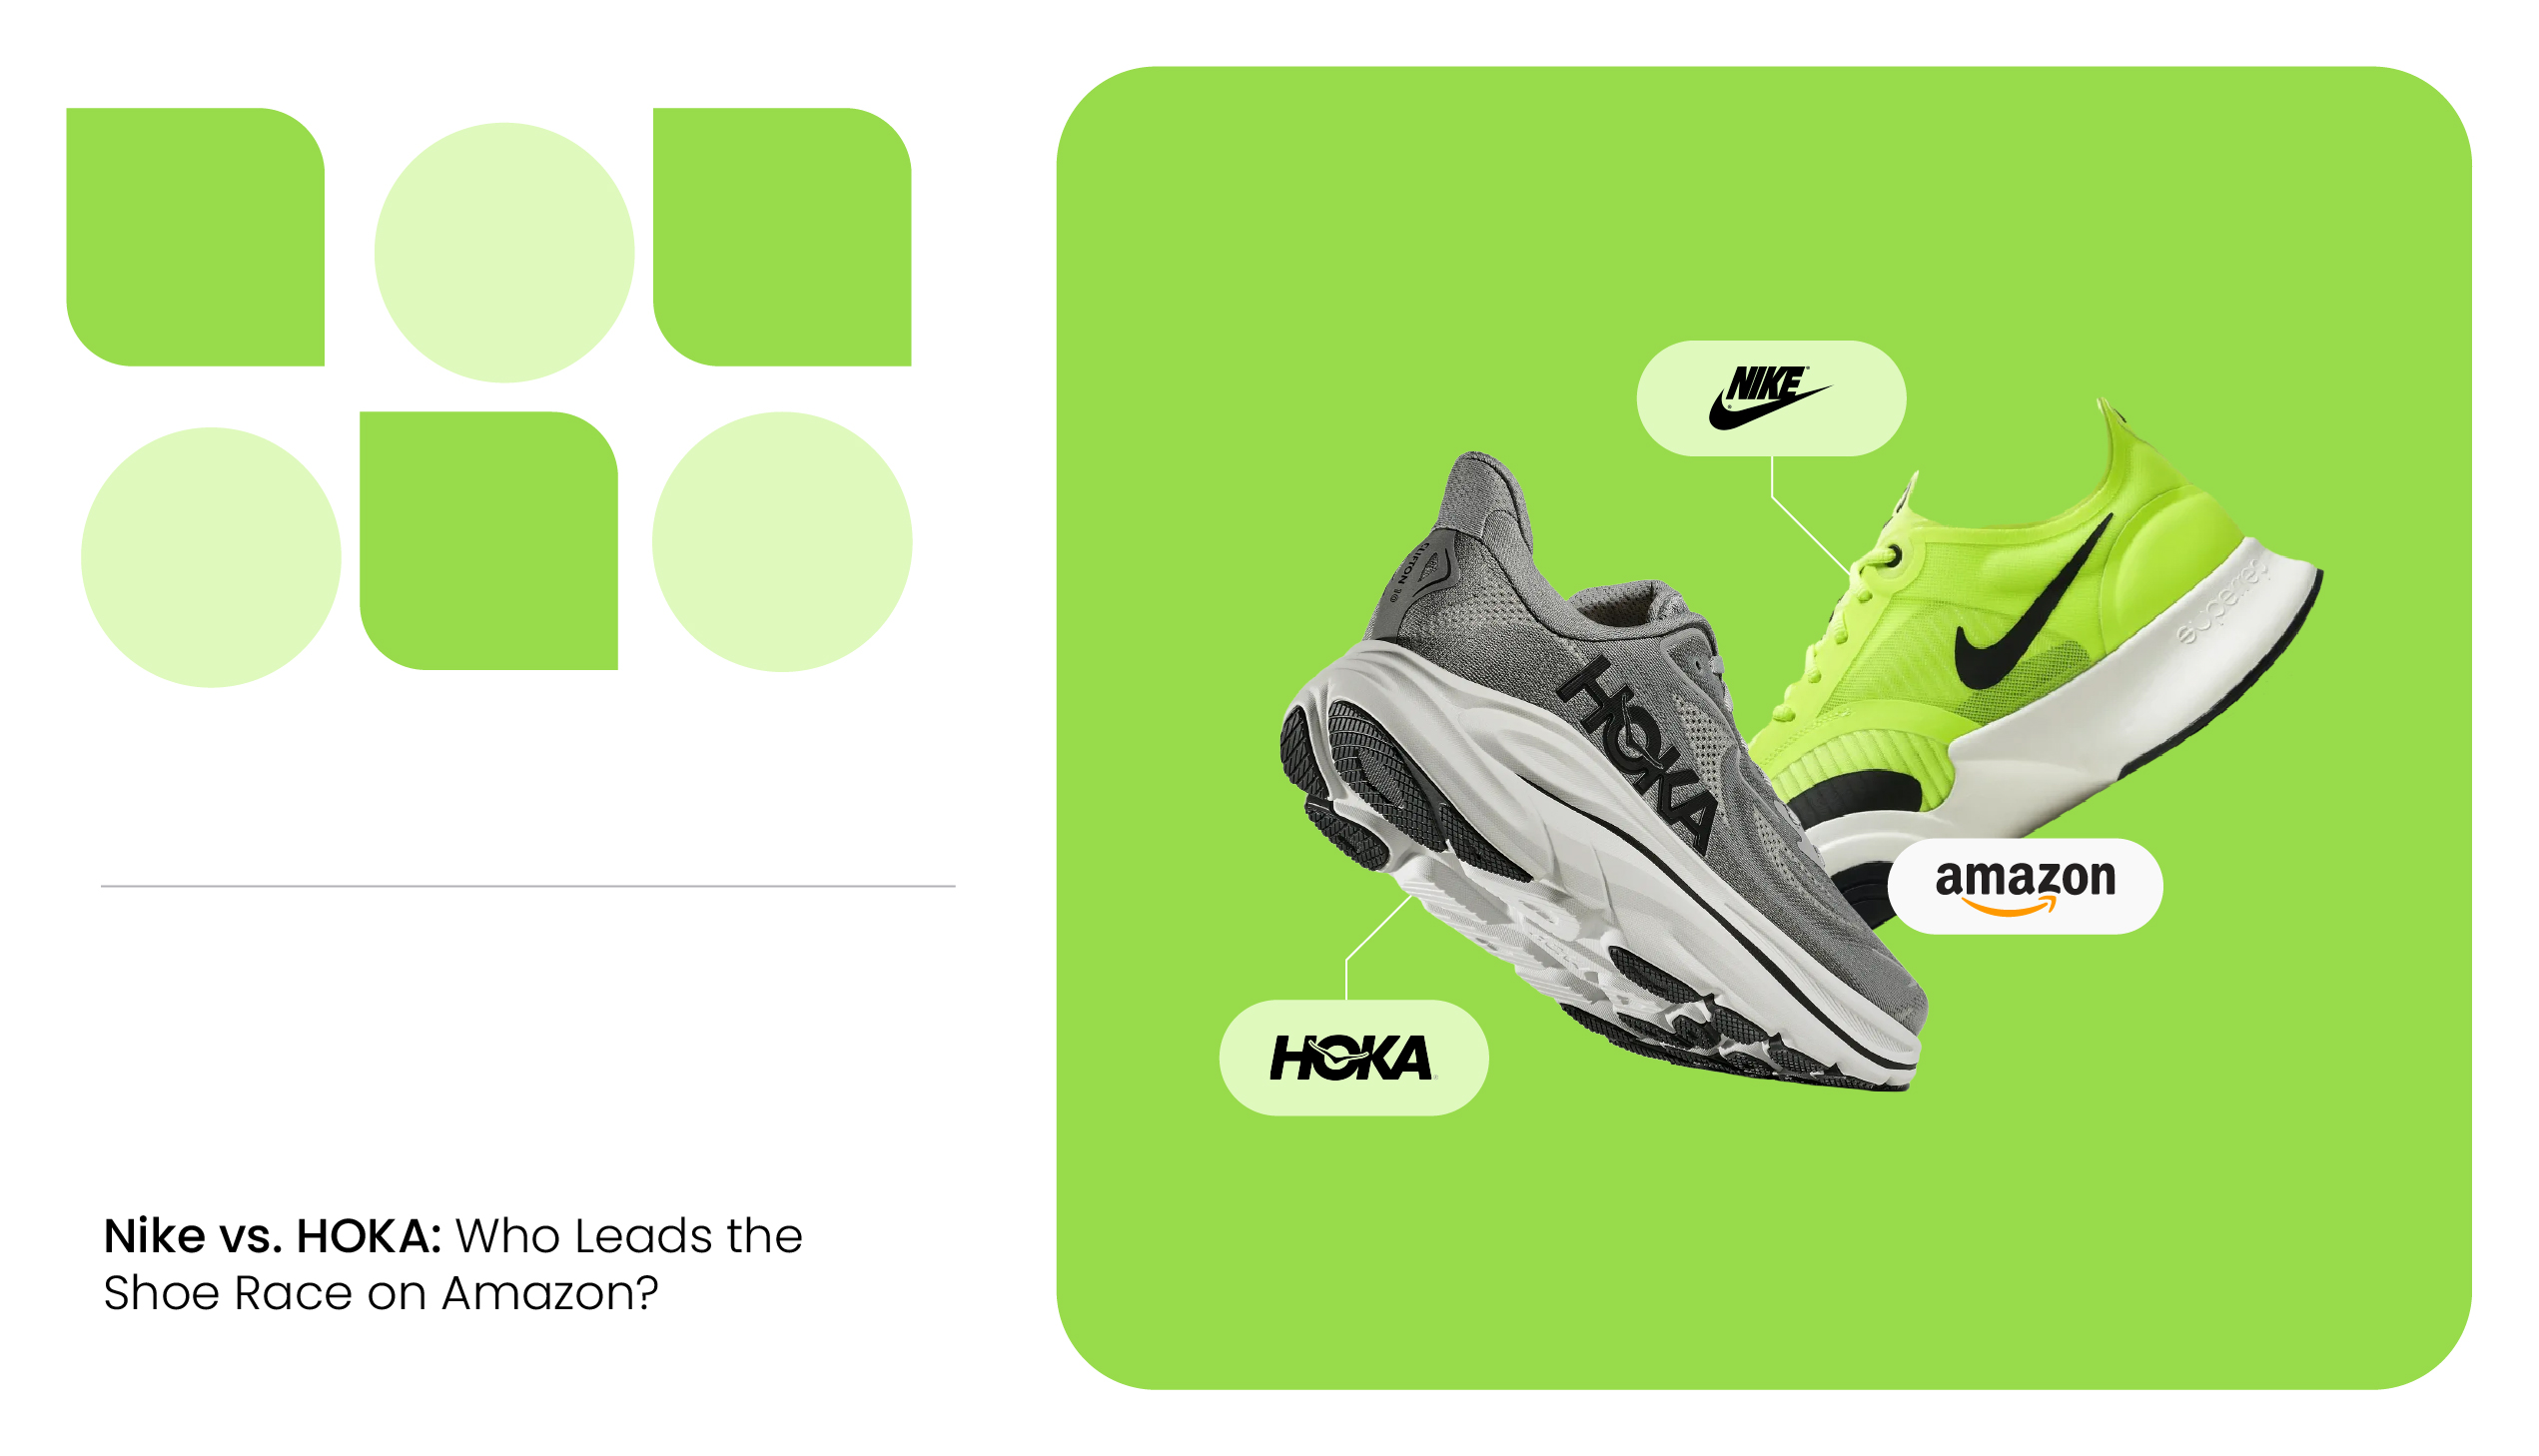
This report examines Nike vs. HOKA on the digital shelf and what their strategies reveal about winning in today’s footwear market.
Highlights
- Nike has 7,467 product listings on Amazon US, compared with HOKA’s 4,038, reflecting a significantly larger marketplace presence.
- Nike has accumulated over 4.5 million reviews, while HOKA has around 650,000, indicating a much larger sales scale.
- HOKA’s average product price is $171.78, compared with $121.38 for Nike, positioning HOKA as a more premium footwear brand.
- Nike applies average discounts of 4.61%, slightly higher than HOKA’s 3.35%, suggesting a more promotion-driven sales strategy.
- Both brands rely primarily on organic visibility, with more than 7,000 Nike listings appearing without sponsorship.
Nike vs HOKA on Amazon: A Snapshot of Their Brand Presence on Amazon
Amazon often reveals how brands approach the market. When we look at Nike and HOKA on the platform, a clear pattern appears. Nike competes through scale and broad reach. HOKA operates with a tighter catalog and a stronger premium focus.
From MetricsCart research findings, the first visible difference is catalog size. Nike lists 7,467 products on Amazon, while HOKA lists 4,038. A larger catalog allows Nike to appear across more search queries. This improves visibility across different styles, use cases, and price points.
Pricing further highlights the contrast. HOKA’s average product price is $171.78, while Nike averages $121.38. This places HOKA more firmly in the premium segment. Nike, in comparison, covers a wider range of price points, making the brand accessible to a larger group of shoppers.
Promotions also reflect this difference in positioning. Nike offers an average discount of 4.61%, compared with 3.35% for HOKA. Nike appears slightly more active with price incentives, while HOKA discounts less often to protect its premium positioning.
Customer engagement mirrors the difference in scale. Nike products have accumulated more than 4.5 million reviews, compared with roughly 650,000 reviews for HOKA. On Amazon, higher review volume often improves visibility because listings with stronger engagement signals tend to rank better in search results.
Taken together, these signals highlight two distinct marketplace scenarios. Nike focuses on scale, reach, and wider price coverage. HOKA focuses on a smaller portfolio built around premium performance footwear.
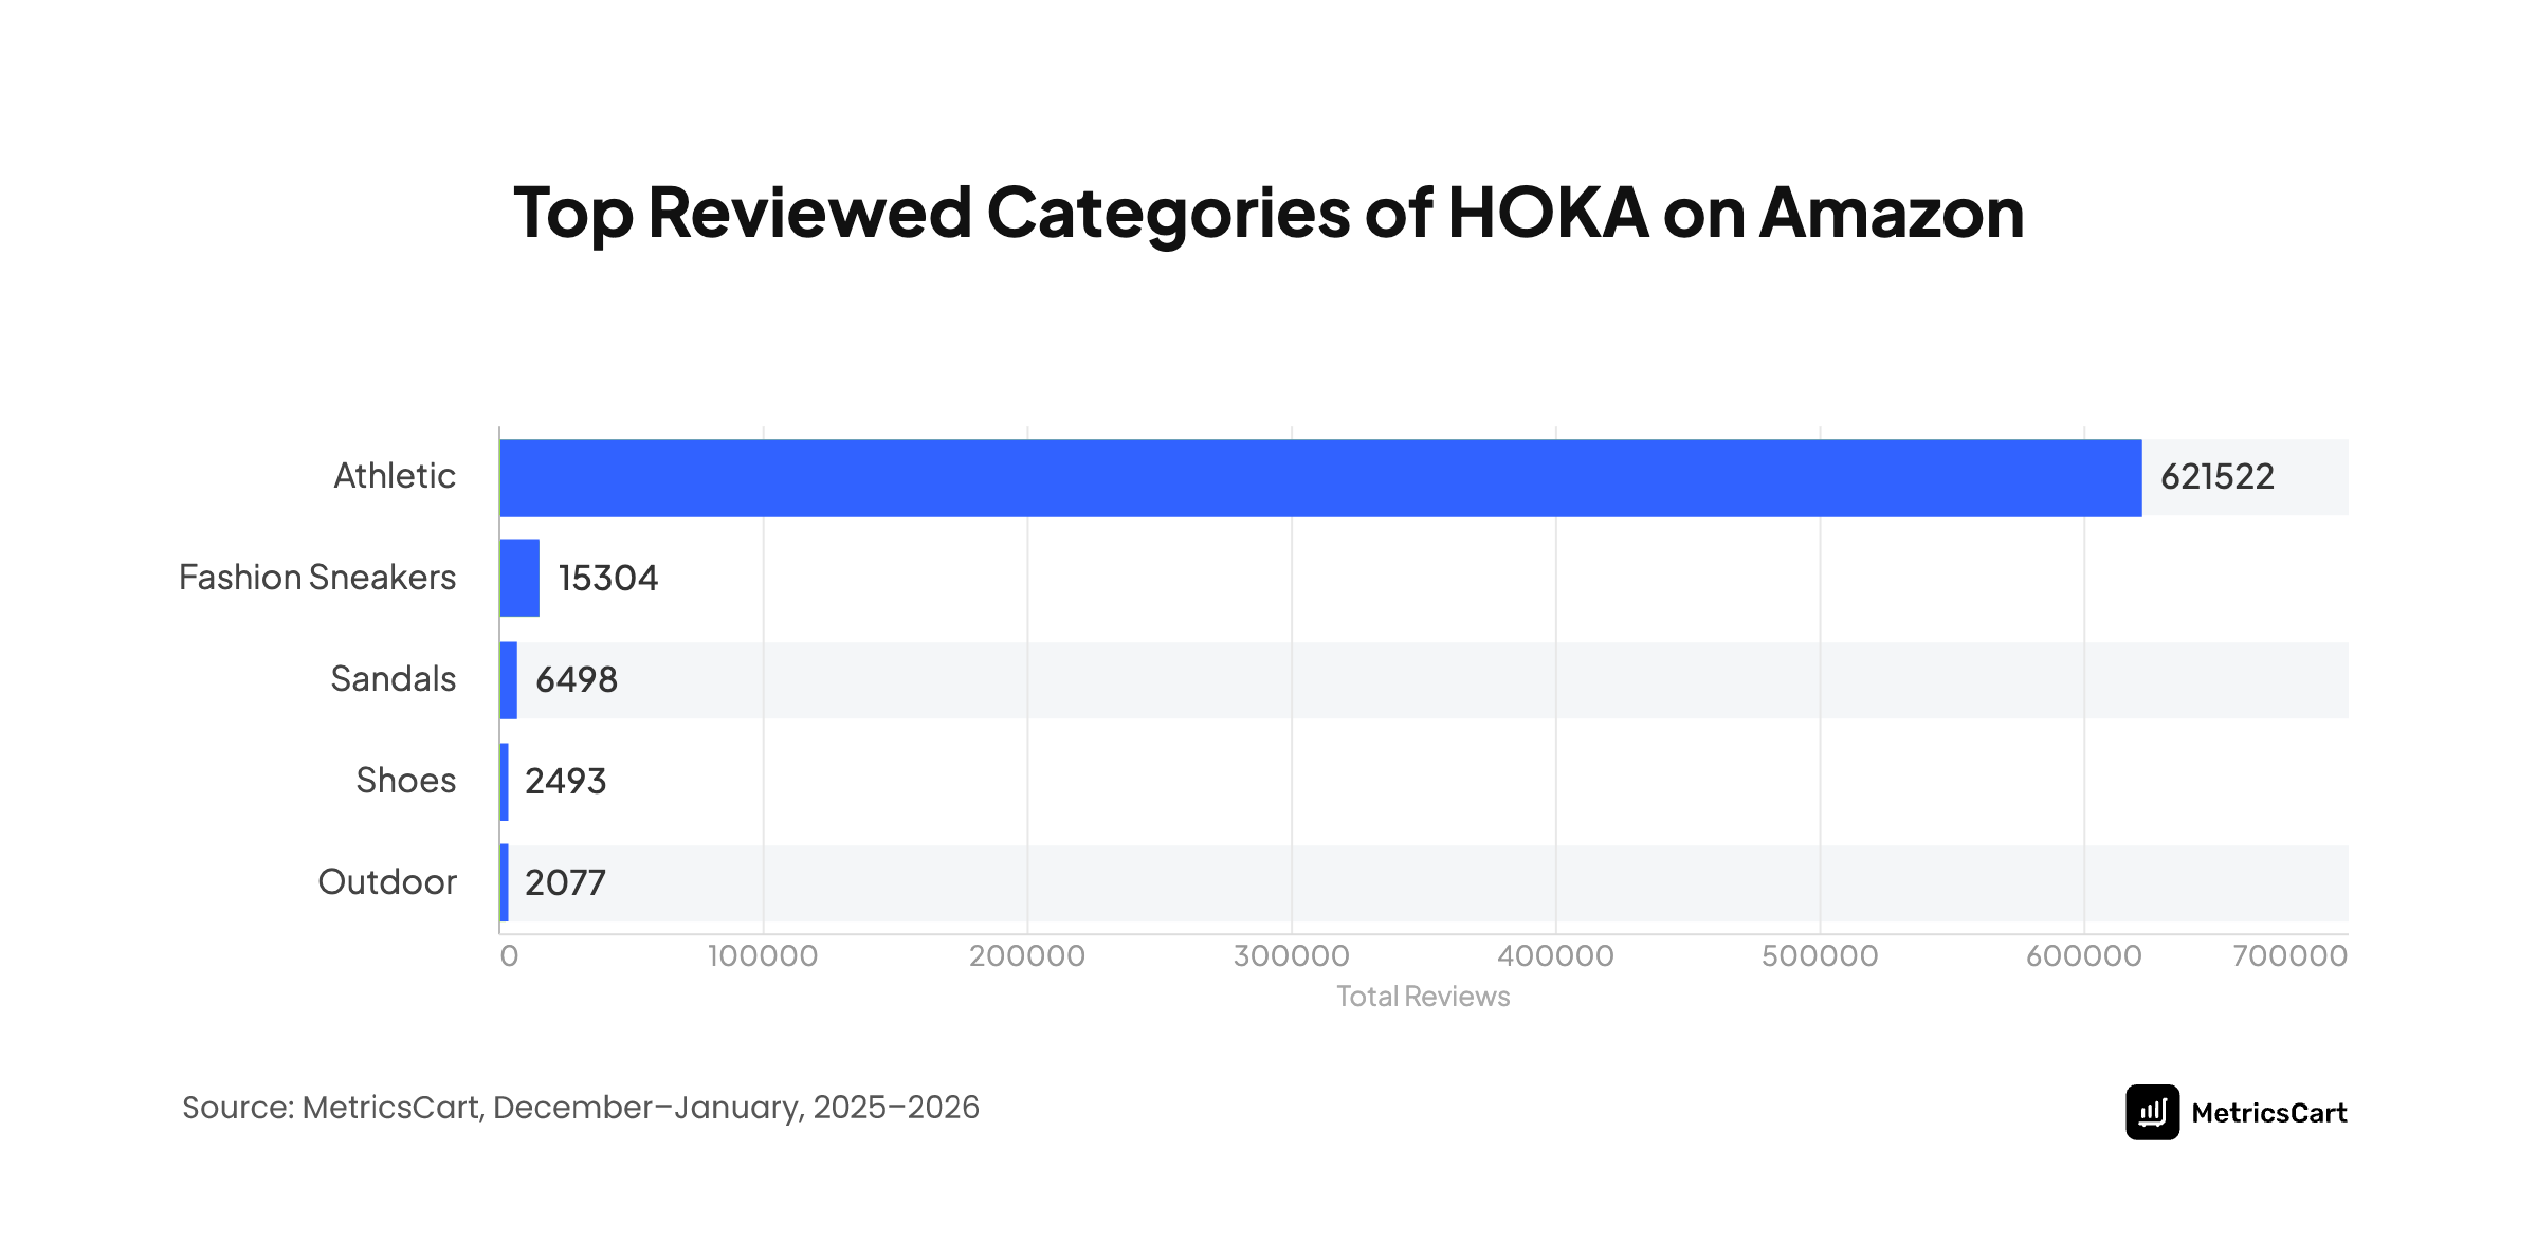
Athletics Is the Top-Reviewed Category for Both Nike and HOKA
HOKA Top-Reviewed Category
NIKE Top-Reviewed Category
Insights from the Metricscart app show that Athletics is the most-engaged category for both Nike and HOKA on Amazon US.
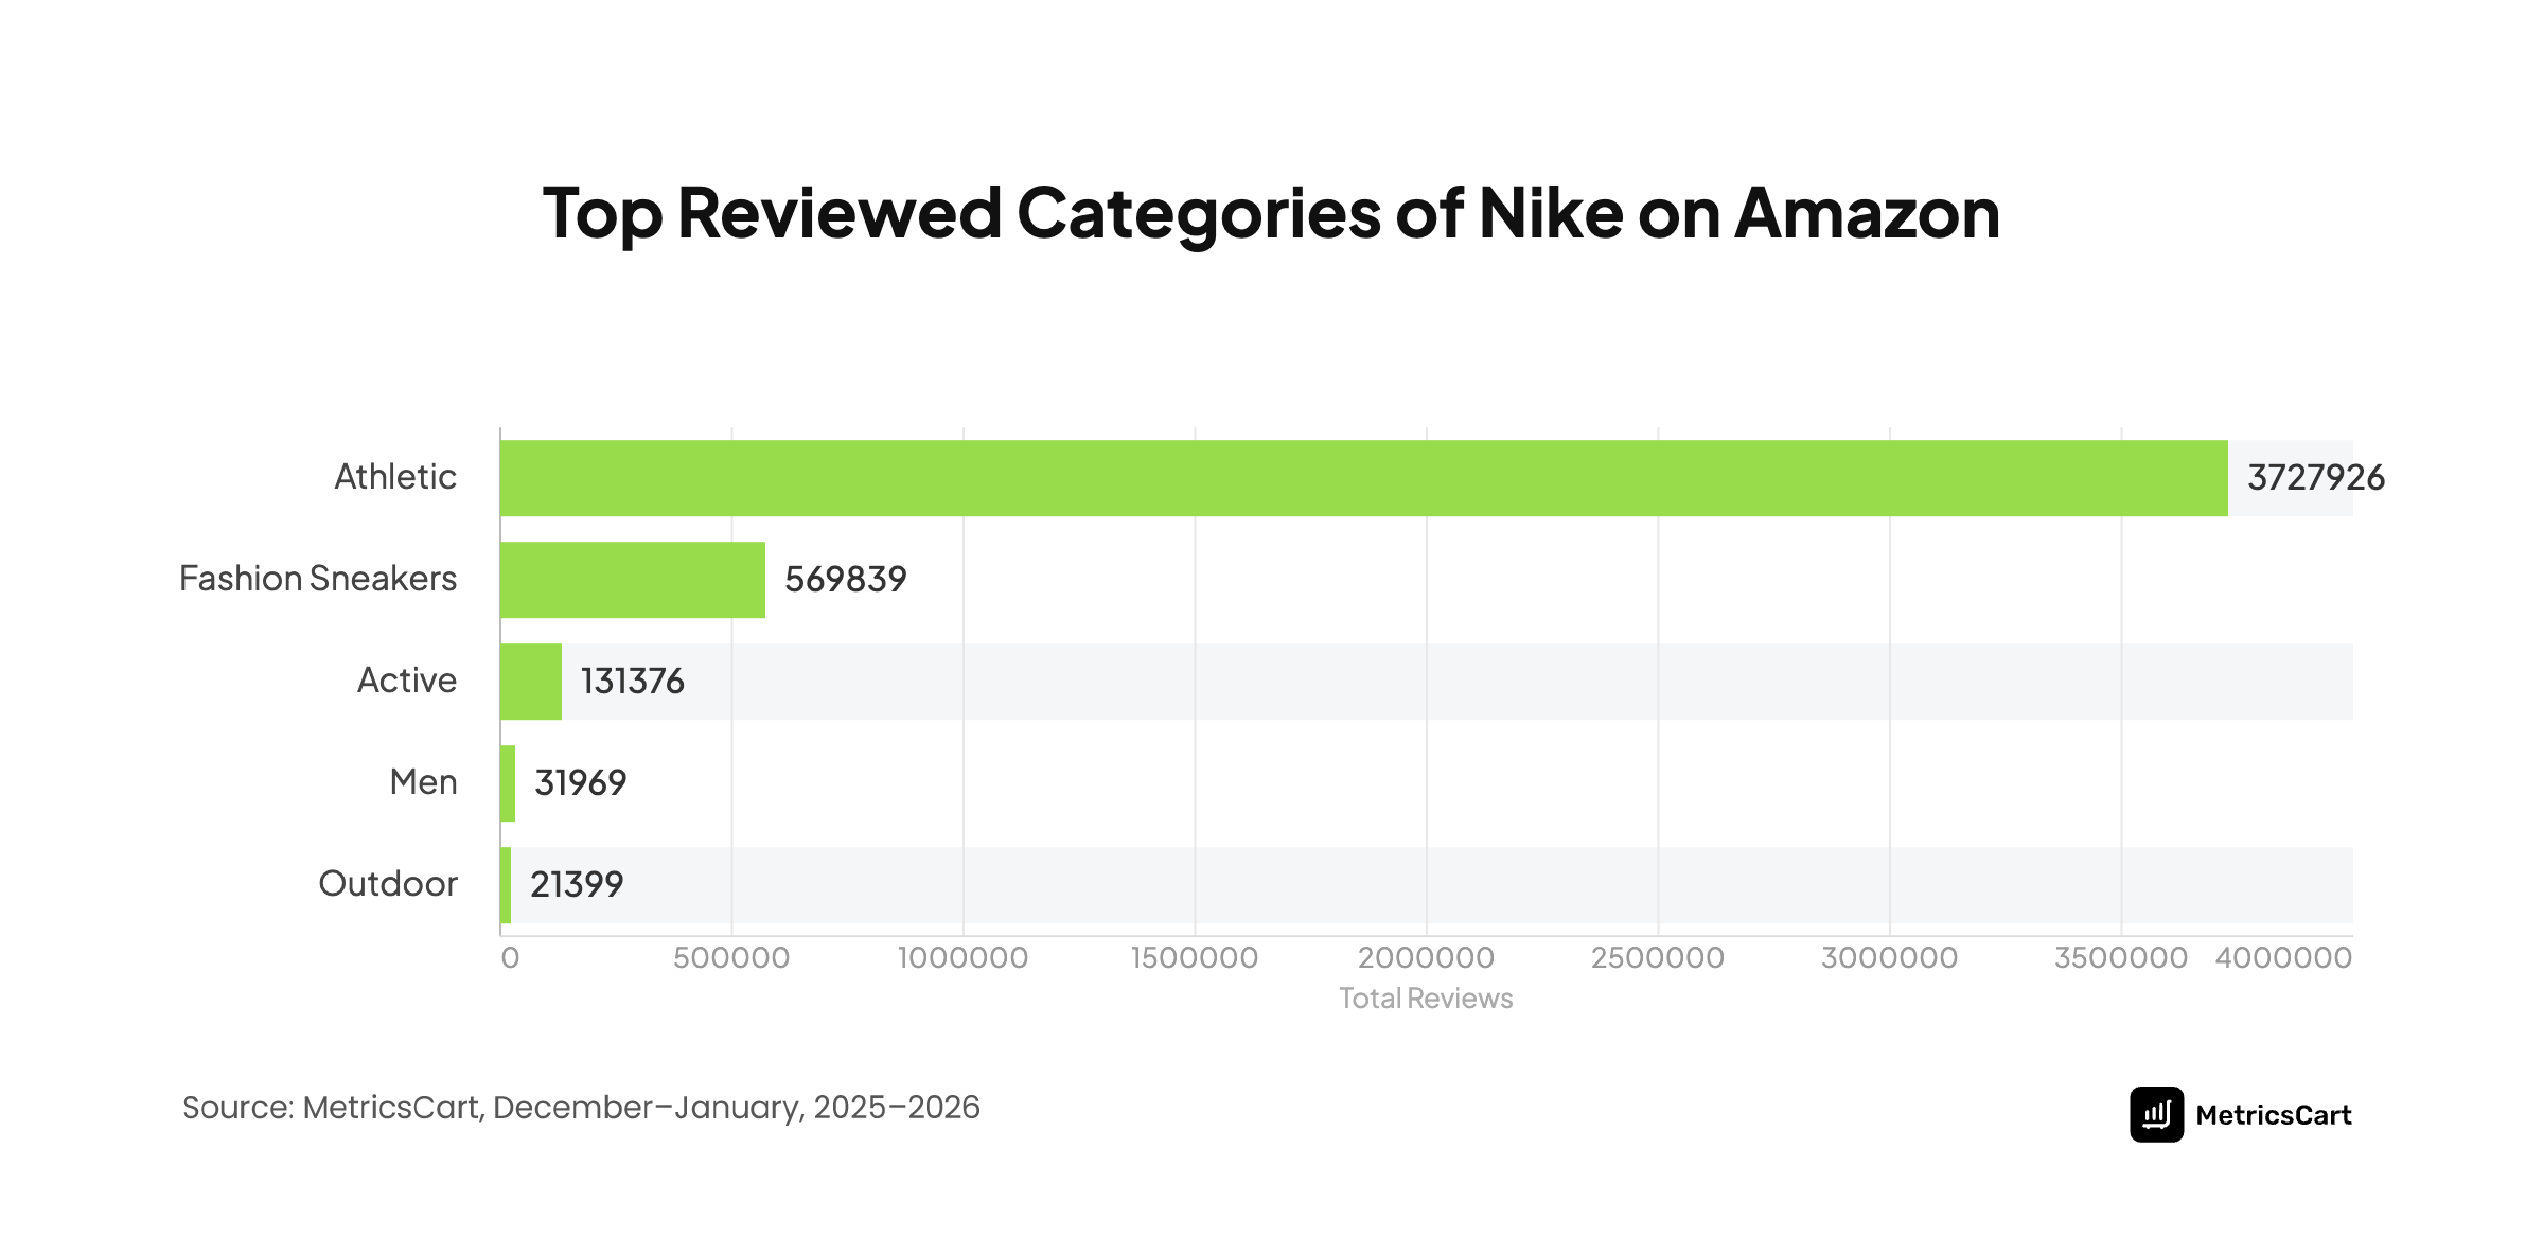
Nike’s athletic footwear listings have accumulated over 3.7 million reviews, while HOKA’s athletic category has generated around 621,522 reviews, making it the clear center of customer engagement for both brands.
This concentration reflects how frequently consumers evaluate performance footwear after purchase. Athletic shoes are used regularly for running, workouts, and daily movement, which naturally drives more customer feedback compared with occasional-use categories like fashion sneakers or sandals.
Beyond Athletics, the next highest engagement for Nike comes from fashion sneakers, which have generated around 569,839 reviews, showing strong demand for lifestyle-driven footwear alongside performance categories. The active category follows with approximately 131,376 reviews, indicating a smaller but still meaningful level of engagement tied to general fitness and multi-purpose use cases.
Within Athletics, engagement is largely driven by running, fitness & cross-training, and walking shoes. Running footwear attracts the broadest usage across exercise, gym training, and everyday wear, which increases both purchase frequency and review activity.
Fitness and cross-training shoes rank closely in popularity among gym users, while walking shoes appeal to consumers who prioritize comfort and daily support.
READ MORE | Men’s Footwear Trends: Latest Styles, Categories, and What’s Popular Now
Nike’s Revolution 5 Leads Review Volume While HOKA’s Walking Shoe Tops Its Catalog
Looking at individual product performance further illustrates the difference in marketplace engagement.
Most Reviewed HOKA Products on Amazon
| Products | Reviews |
| Hoka ONE ONE Women’s Walking Shoe Trainers | 2880 |
| HOKA ONE ONE Women’s Low-top Sneaker | 2081 |
| HOKA Women’s Bondi 9 | 1596 |
| Men’s Bondi 8 (WBLC – White/Black) | 1429 |
For HOKA, the most-reviewed listings are concentrated in performance and comfort-focused footwear. The HOKA ONE ONE Women’s Walking Shoe Trainers lead with 2,880 reviews, followed by the HOKA ONE ONE Women’s Low-Top Sneaker (2,081 reviews) and the HOKA Women’s Bondi 9 (1,596 reviews).
Most Reviewed Nike Products on Amazon
| Products | Reviews |
| Nike Men’s Revolution 5 Running Shoes | 24486 |
| Nike Men’s Benassi Just Do It Athletic Sandal | 19883 |
| NIKE Performance Cushion Crew Socks with Bag (6 Pairs) | 16513 |
Nike’s leading shoe products show significantly higher review volume. The Nike Men’s Revolution 5 Running Shoes lead with 24,486 reviews, followed by the Nike Men’s Benassi “Just Do It” Athletic Sandal (19,883 reviews) and Nike Performance Cushion Crew Socks (16,513 reviews).
These patterns reflect each brand’s marketplace reach. HOKA’s engagement is concentrated in premium performance footwear, while Nike generates review activity across both running shoes and everyday athletic products.
Nike vs HOKA: How Pricing Strategy Shapes Demand Across Categories
Pricing patterns within the athletics category show how Nike and HOKA capture demand at different price levels on Amazon.
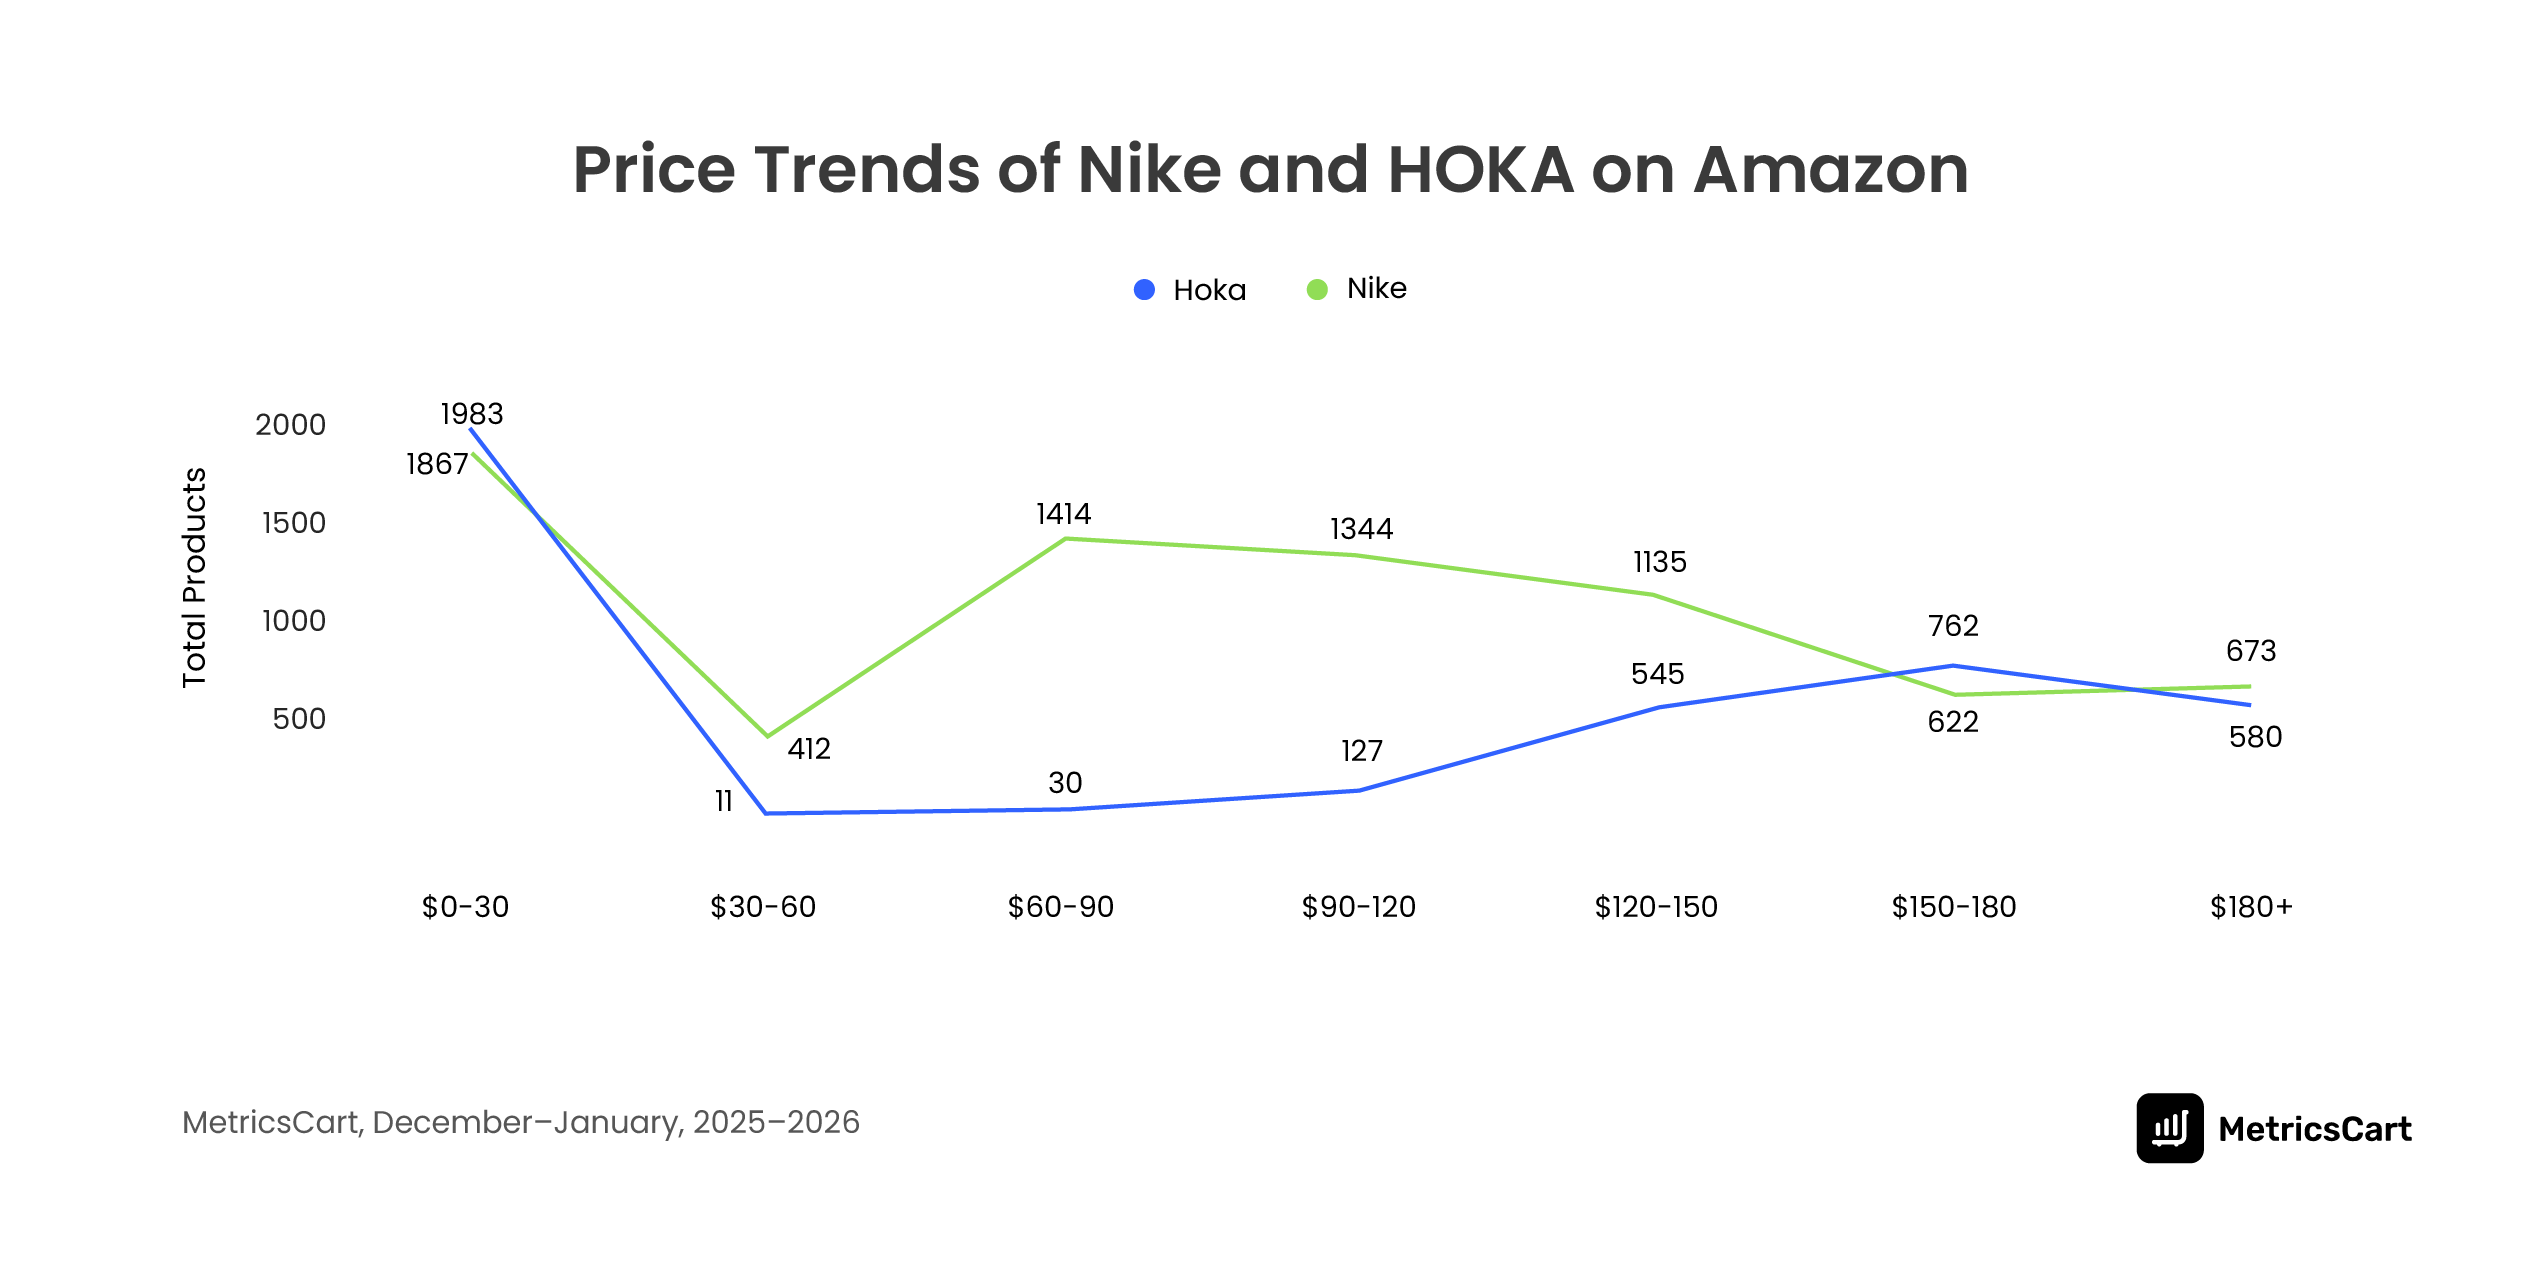
For HOKA, lower-priced products are mostly found in comfort-focused segments. Sport sandals and slides, generally priced below $100, appear among the brand’s most affordable items, followed by fitness, cross-training, and cycling footwear. This suggests that HOKA uses these categories as entry points, while keeping its core running lineup positioned at higher price tiers.
Nike’s affordable athletic products are distributed across a wider set of sports categories. Football, softball, and baseball footwear, along with sport sandals and slides, often priced below $55, form Nike’s entry-level offerings. By placing lower-priced products across multiple sports segments, Nike expands its reach and captures shoppers who are exploring the category or looking for budget-friendly options.
The pattern shifts in the premium tier. HOKA’s higher-priced products, typically in the $150–$180+ range, are concentrated in running footwear, followed by walking and cycling shoes. This reflects the brand’s strategy of concentrating premium value around performance running, where cushioning technology and comfort are key selling points.
Nike’s premium pricing, in contrast, spans several sports categories. Cycling, soccer, and tennis footwear, often priced between $150 and $180+, represent Nike’s highest-priced products, with cycling shoes reaching the top end of the range. This shows Nike’s ability to command premium prices across multiple performance segments.
How Customers Feel About Nike and HOKA: A Sentiment Analysis
Findings from MetricsCart indicate that customer sentiment reveals a clear difference in how Nike and HOKA deliver the product experience on Amazon US.
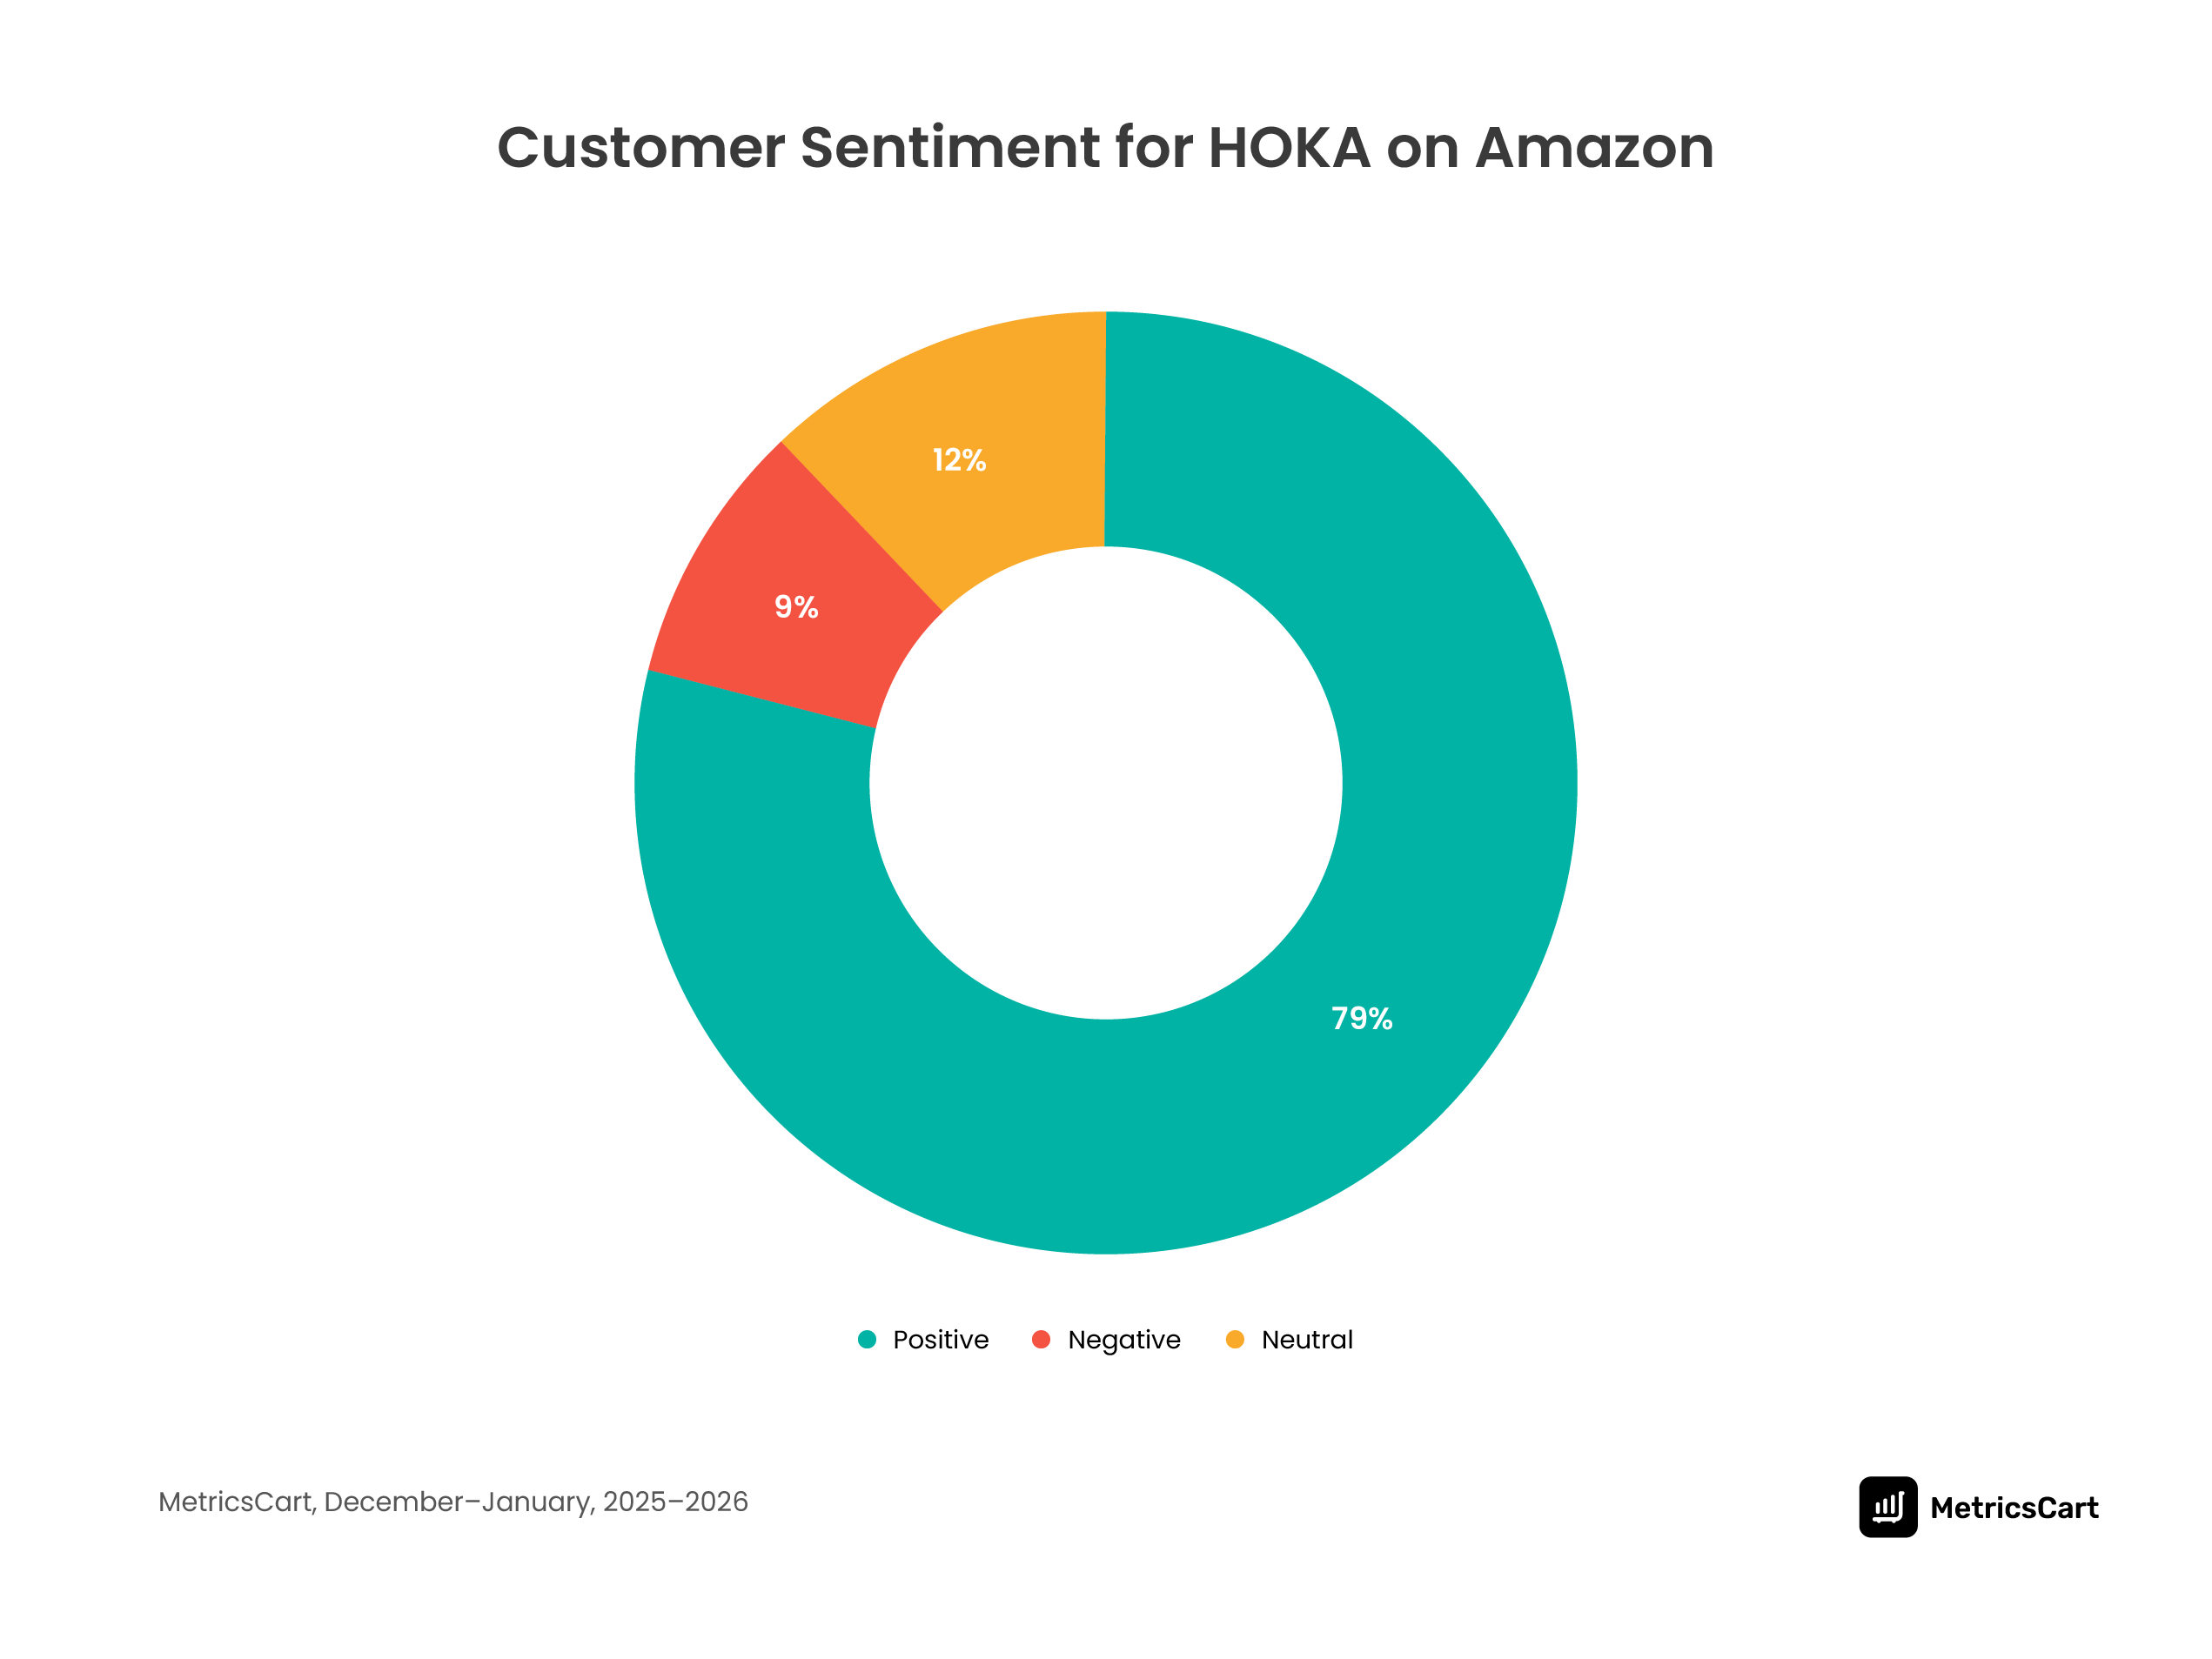
For HOKA, sentiment is strongly positive. Around 79% of reviews are positive, with only 9% negative and 12% neutral. This level of consistency is significant when viewed alongside HOKA’s smaller and more focused catalog.
The brand is largely centered on performance running and comfort-driven footwear, and the sentiment data suggests that this positioning is translating well into actual customer experience. Shoppers are not only buying into the promise of comfort and cushioning, but they are consistently validating it in their feedback.
On the digital shelf, this kind of concentrated positive sentiment strengthens trust, supports premium pricing, and reduces the risk of negative signals spreading across the catalog.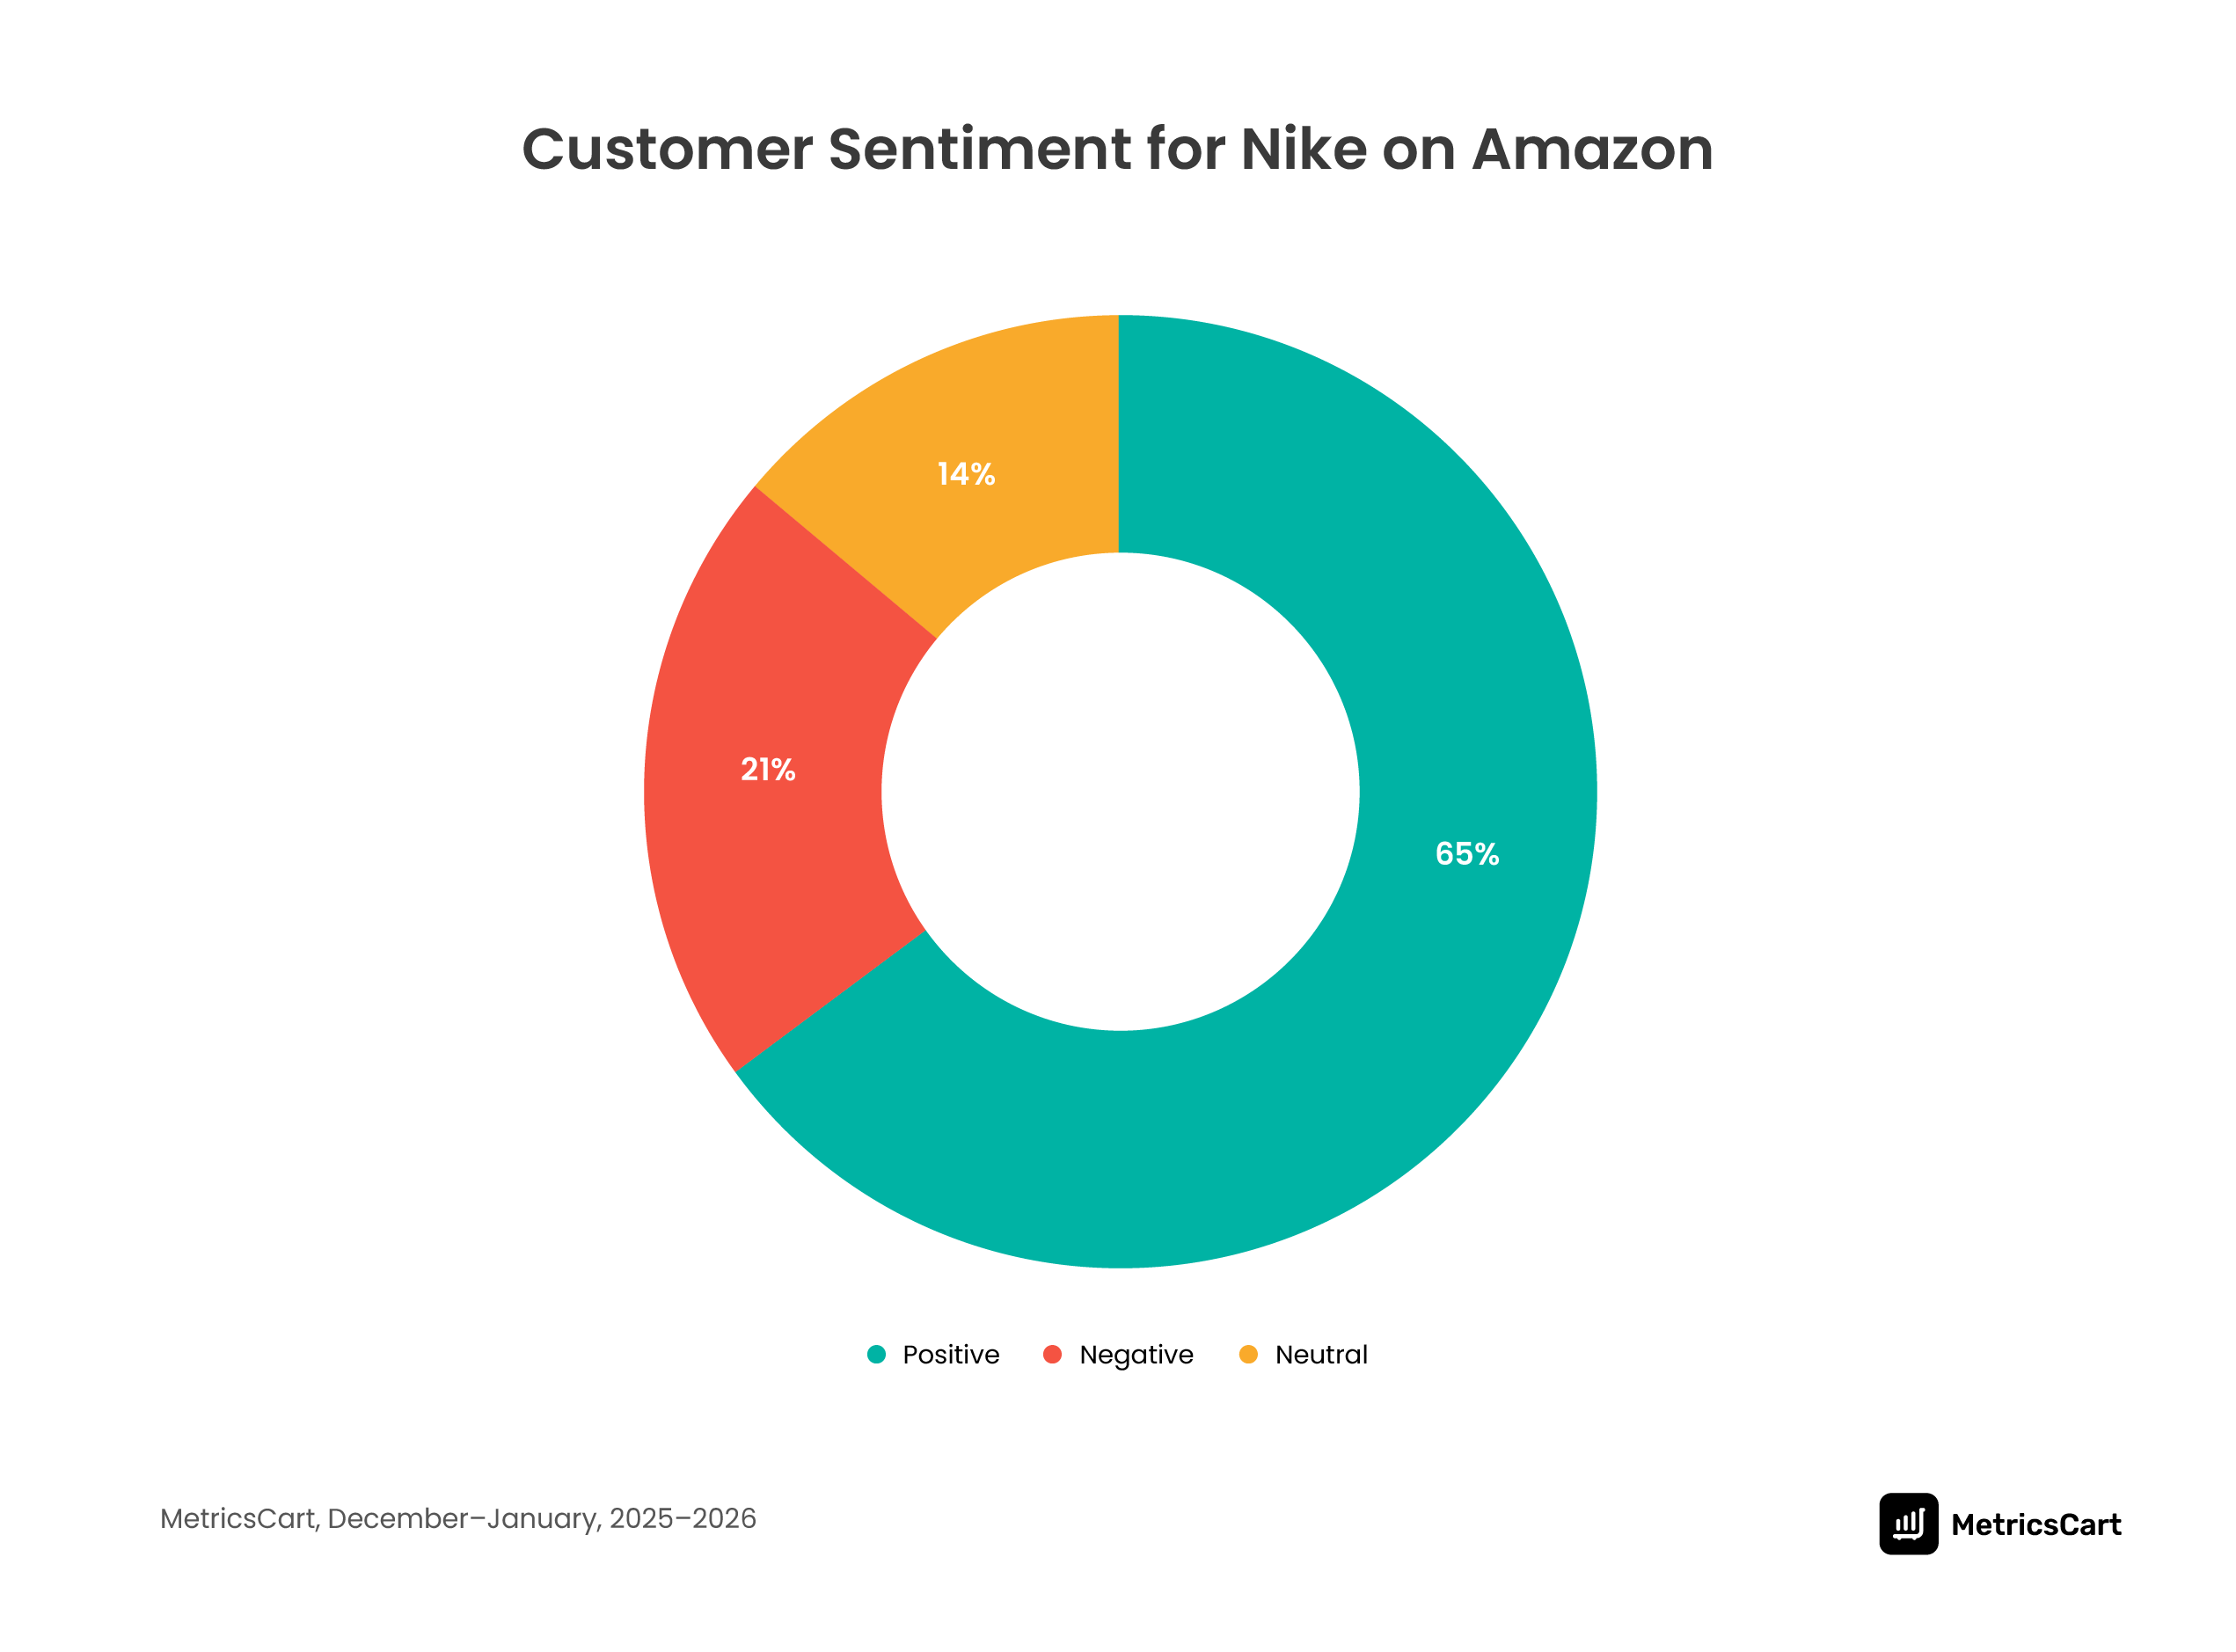
Nike shows a different pattern. About 65% of reviews are positive, while 21% are negative and 14% are neutral. At first glance, this may appear weaker, but it needs to be read in the context of Nike’s scale.
From our findings, Nike has a significantly larger product assortment and far higher review volume across multiple categories, price tiers, and use cases. This broader presence introduces more variation in customer experience.
Entry-level products, everyday essentials, and performance footwear all sit within the same catalog, and each attracts different expectations from shoppers. As a result, sentiment is more distributed, with a higher share of neutral and negative feedback.
This gap in sentiment concentration reflects a larger strategic difference between the two brands. HOKA’s tighter portfolio allows it to maintain a more controlled and consistent product experience, which shows up in stronger positive sentiment. Nike, on the other hand, maximizes reach and visibility through a wider assortment, but that same breadth leads to more mixed feedback across the catalog.
READ MORE | Benefits of Customer Feedback Tracking: Everything You Need to Know
Key Takeaways for Brands on the Digital Shelf
The comparison between Nike and HOKA highlights how different strategies can work on today’s digital marketplaces.
For brands selling online, the takeaway is simple. Success on marketplaces is not just about having more products. It comes from the right mix of product positioning, pricing strategy, and customer experience that builds visibility and trust over time.
This is where MetricsCart helps brands see the bigger picture. By tracking signals such as pricing changes, review trends, product visibility, and competitor activity, MetricsCart provides the insights brands need to understand how their products are performing across the digital shelf.
Disclaimer: MetricsCart is the exclusive owner of the data used in the Digital Shelf Insights reports. Any third-party use requires due credit to the source material.
Track What Shoppers Are Choosing in the Footwear Category