About The Report
This report is a deep dive into the drinkware category, comparing Stanley vs. Yeti brand performance with insights into product range, monthly sales performance, pricing and discounts, and customer engagement on Amazon. We’ll discuss the key factors behind Stanley and Yeti’s success in light of their branding and marketing strategies and what might come next in this brand battle in the drinkware market.
Highlights
- Stanley leads in monthly sales with 595,800 units sold per month, while Yeti sells 357,000 units per month.
- Stanley Quencher H2.0 Tumbler and Yeti Rambler Tumbler are the bestselling products.
- Stanley’s pricing averages $24.74, which is higher than Yeti’s average of $21.13.
- Stanley’s average discount of 1.34% is significantly higher than Yeti’s 0.18%.
- Stanley has more reviews with 3.76 million, while Yeti’s average rating is slightly higher (4.57 vs. 4.55).
When it comes to premium drinkware brands, Stanley and Yeti dominate the marketplace, each carving out a significant share of consumer attention and sales volume.
However, despite their shared prominence, their approaches to branding, marketing, and e-commerce strategies differ significantly. Let’s decode!
Stanley vs. Yeti: The TikTok Battle
If you’ve scrolled through TikTok in the past year, you’ve undoubtedly come across the #StanleyCup challenge or countless videos comparing Stanley vs. Yeti. What’s behind this explosion on social media?
Stanley’s Viral Success on TikTok
Stanley’s marketing strategy is a brilliant example of using social media as a sales funnel. Stanley has taken advantage of viral trends and influencer culture to create a buzz around its 40 oz Quencher Tumblers, turning them into Instagram-worthy, must-have accessories.
By focusing on social media virality and exclusive product releases, Stanley has tapped into the FOMO (fear of missing out) factor as a conversion driver. Influencers and consumers alike have posted countless videos showing off their tumblers in various trendy settings, propelling Stanley into the spotlight.
This viral success has translated into massive sales and cemented Stanley’s position as the go-to drinkware brand for younger, social-media-savvy consumers, generating over $750 million in revenue!
Yeti’s Premium Positioning
On the other hand, while Yeti enjoys symbiotic social media coverage with the “comparing Stanley vs. Yeti” TikTok trend, it has stayed true to its roots, focusing on its premium outdoor image.
While Stanley’s success is rooted in social media buzz, Yeti’s is in the rugged durability and functionality of its products. Yeti’s products, especially coolers and vacuum-insulated tumblers, cater to a different audience; one that values long-lasting performance over viral trends.
Yeti’s social media content strategy is authentic, focusing on outdoor adventures. That authenticity continues to resonate with loyal customers.
READ MORE| Want to decode Stanley’s marketing strategy? Check out How Stanley Dominates Target’s Digital Shelf: A Deep Dive into Prices & Reviews.
Stanley vs. Yeti on Amazon
On Amazon, Stanley and Yeti showcase unique strategies that drive their dominance in the premium drinkware market. From product range to pricing and sales performance, let’s dive into how each brand approaches the digital shelf.
Product Range: Stanley’s Focused vs. Yeti’s Varied Offerings
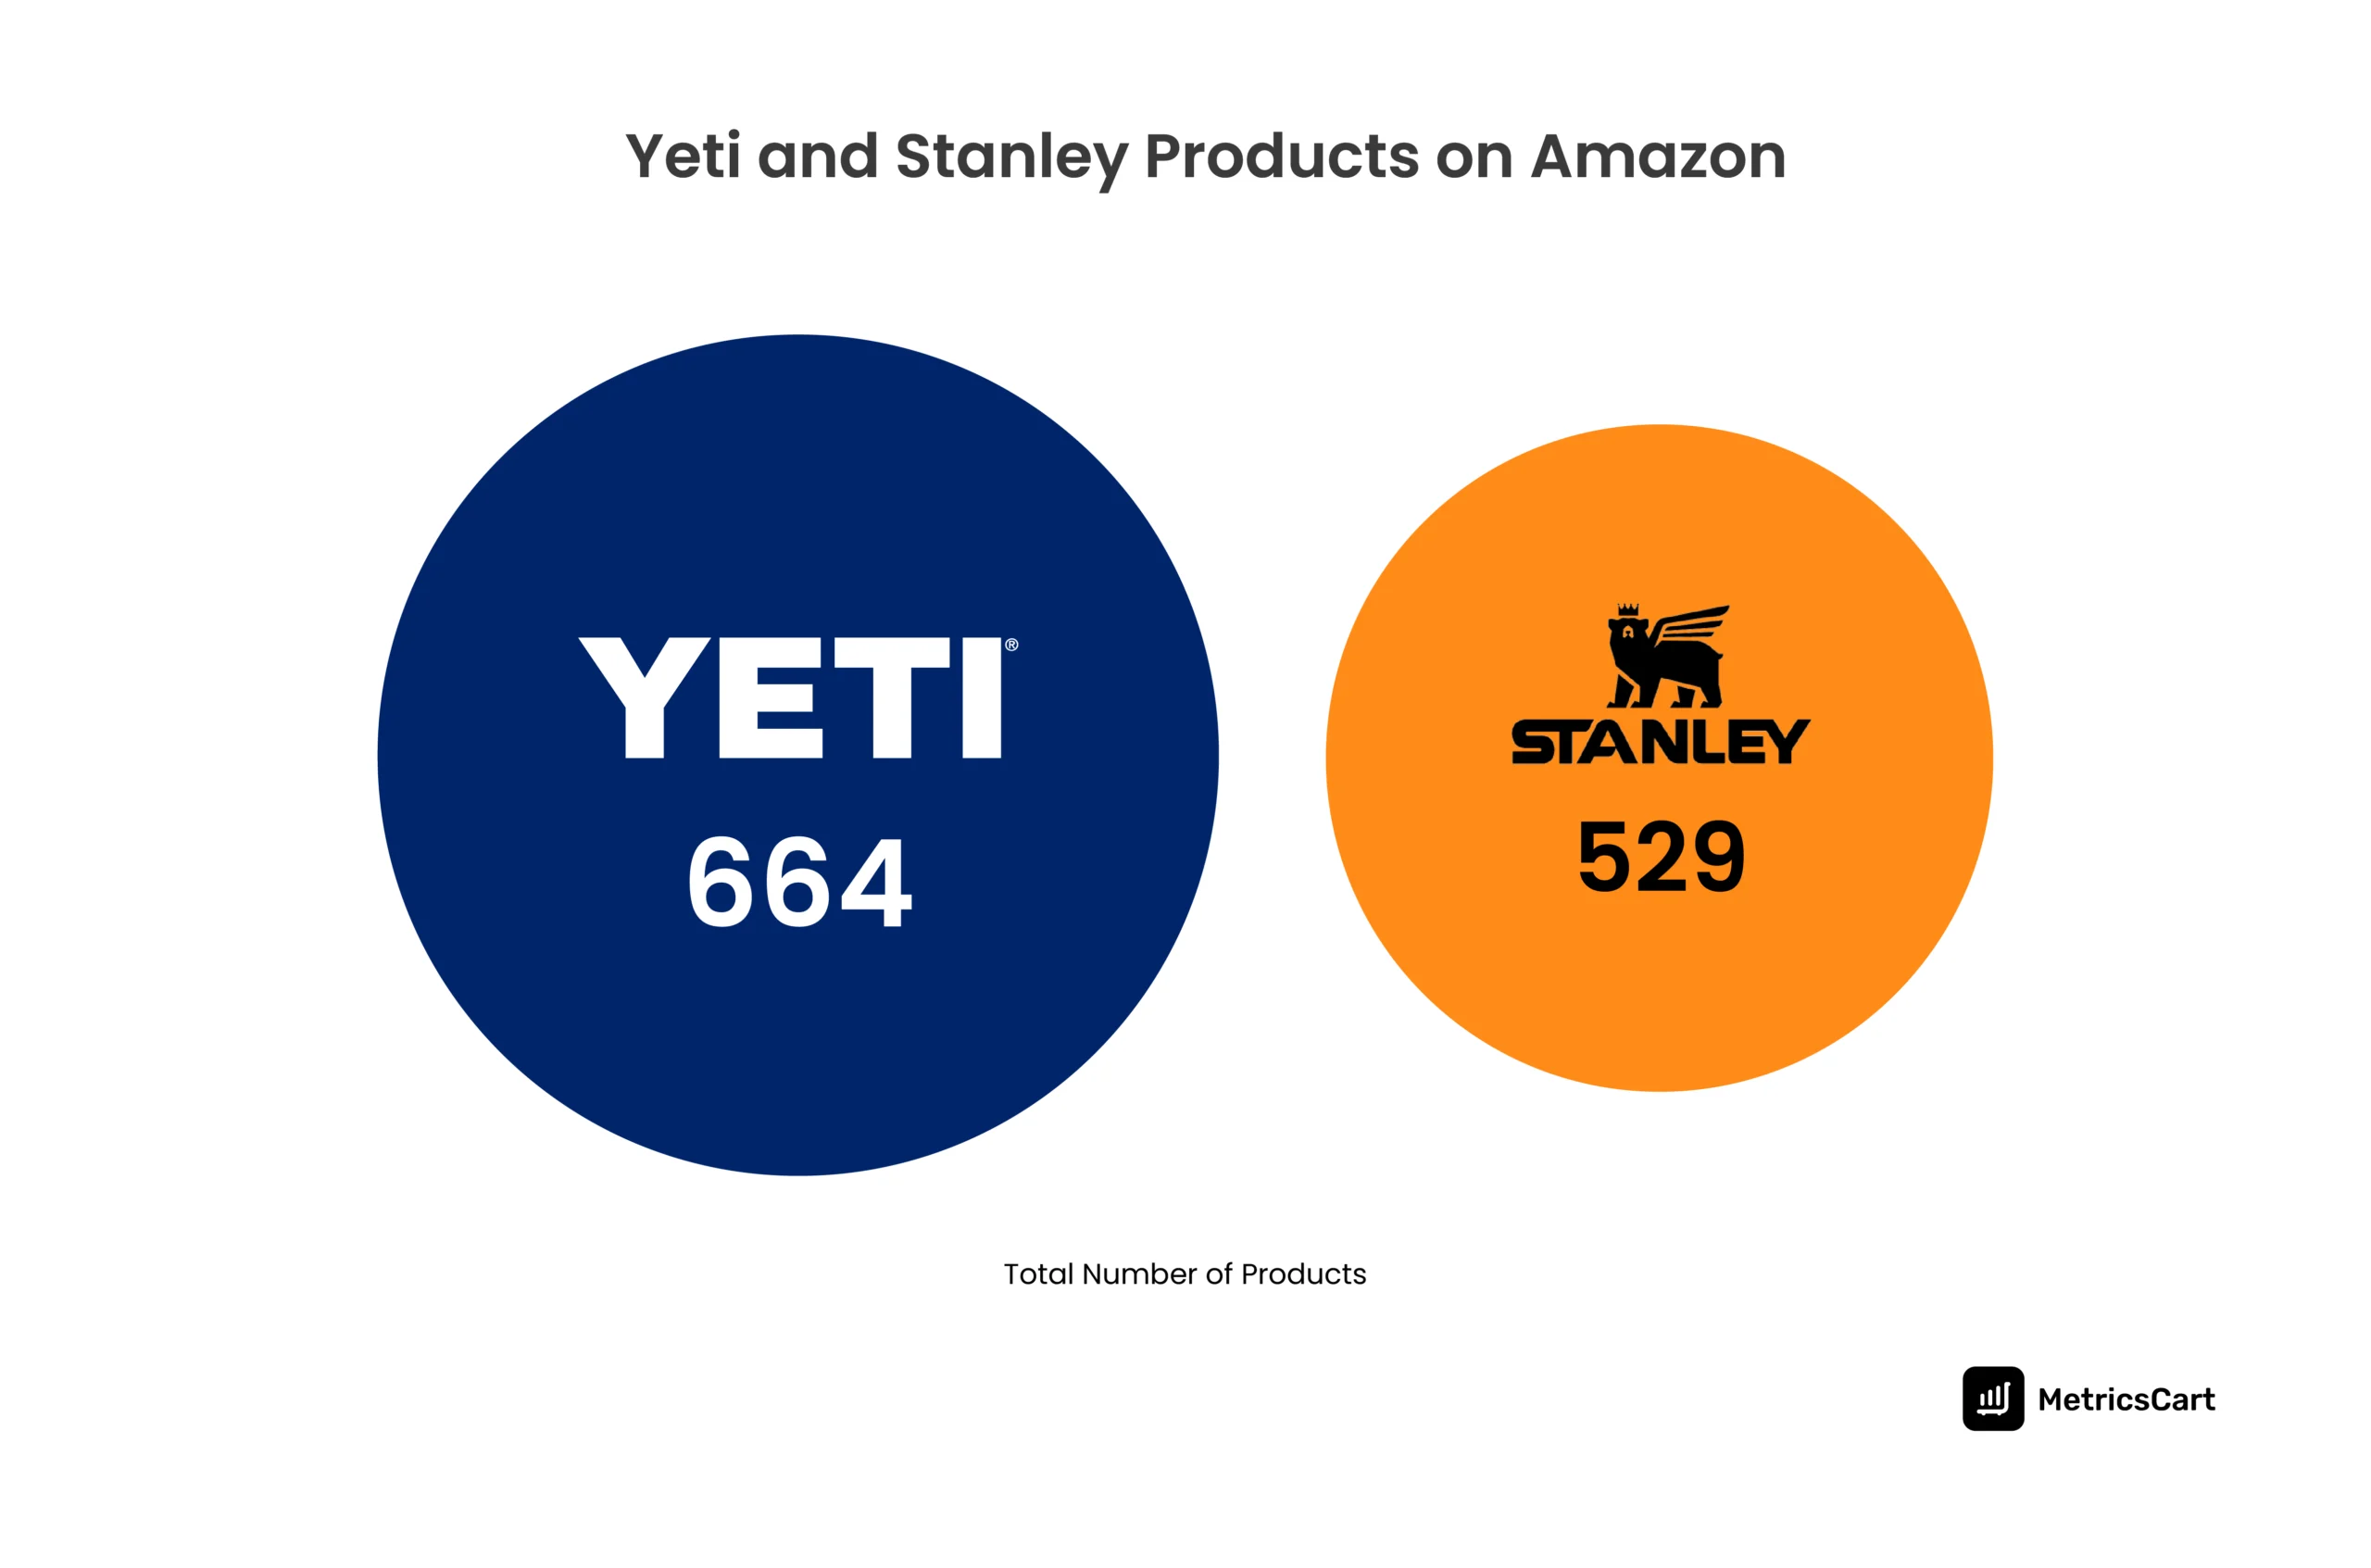
Stanley offers 529 products, primarily centered around premium drinkware like tumblers, bottles, and mugs. Yeti has a broader catalog of 664 products, which includes not only drinkware but also coolers, outdoor bags, and accessories.
Stanley’s focused product line allows it to dominate the tumbler market by carving out a niche by creating a strong brand identity around its high-demand drinkware. On the other hand, Yeti’s diversified catalog helps it capture a broader market, offering everything from coolers to outdoor gear to reach a larger audience.
Stanley Leads in Monthly Sales with 595,800 Units Sold Per Month
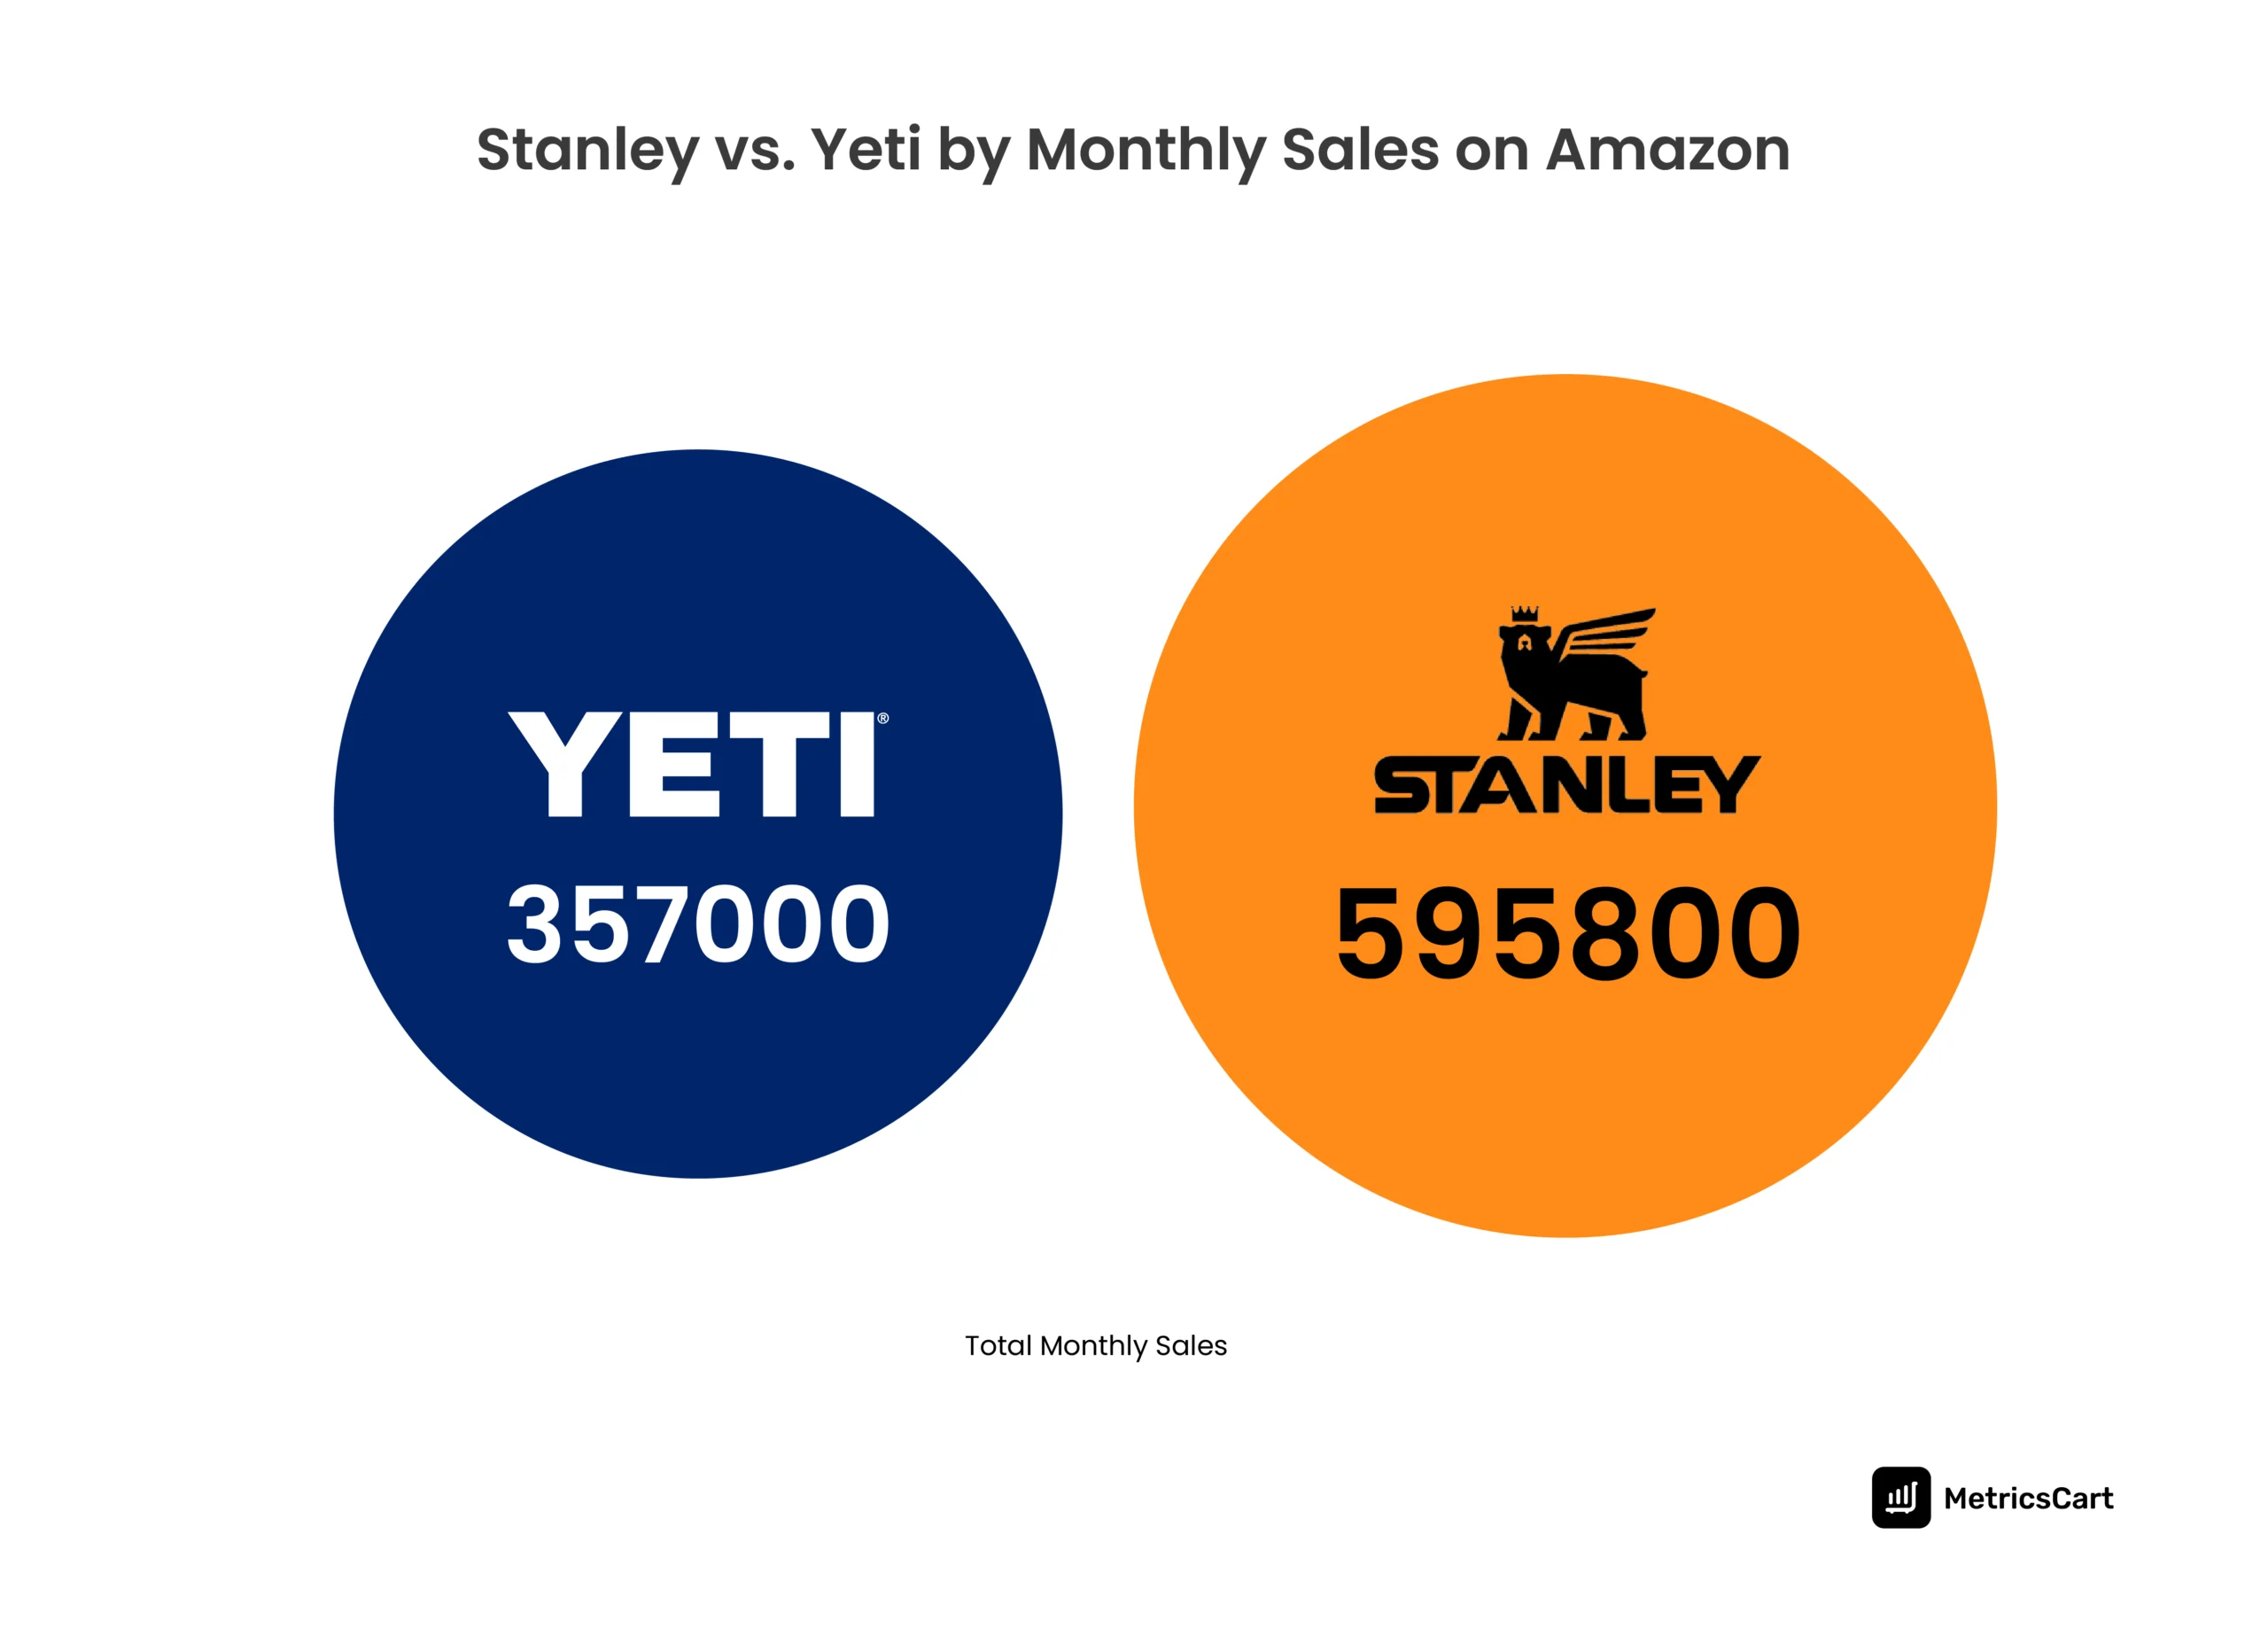
Stanley’s impressive lead in monthly sales on Amazon, with 595,800 units sold compared to Yeti’s 357,000, is a direct result of its ability to capitalize on the ongoing drinkware trends in the US, particularly the rising demand for stylish and functional products.
Stanley has effectively tapped into the millennial and Gen Z markets, who are drawn to its socially driven, aesthetic products, such as the 40 oz Quencher Tumblers. These products have gained viral attention, especially on TikTok, where limited-edition releases and influencer endorsements have created buzz and driven impulse buying.
As drinkware becomes a lifestyle statement, Stanley has positioned itself as the must-have brand, blending utility with trendiness. In contrast, Yeti, while maintaining a strong foothold in the premium outdoor gear market, has seen slower sales growth in the drinkware segment despite its established reputation for rugged durability.
READ MORE| Want your brand to capture Gen Z’s attention? Check out Decode How Gen Z Shops on Amazon: Supercharge Your Brand’s Sales Today.
Stanley vs. Yeti: Bestselling Products on Amazon
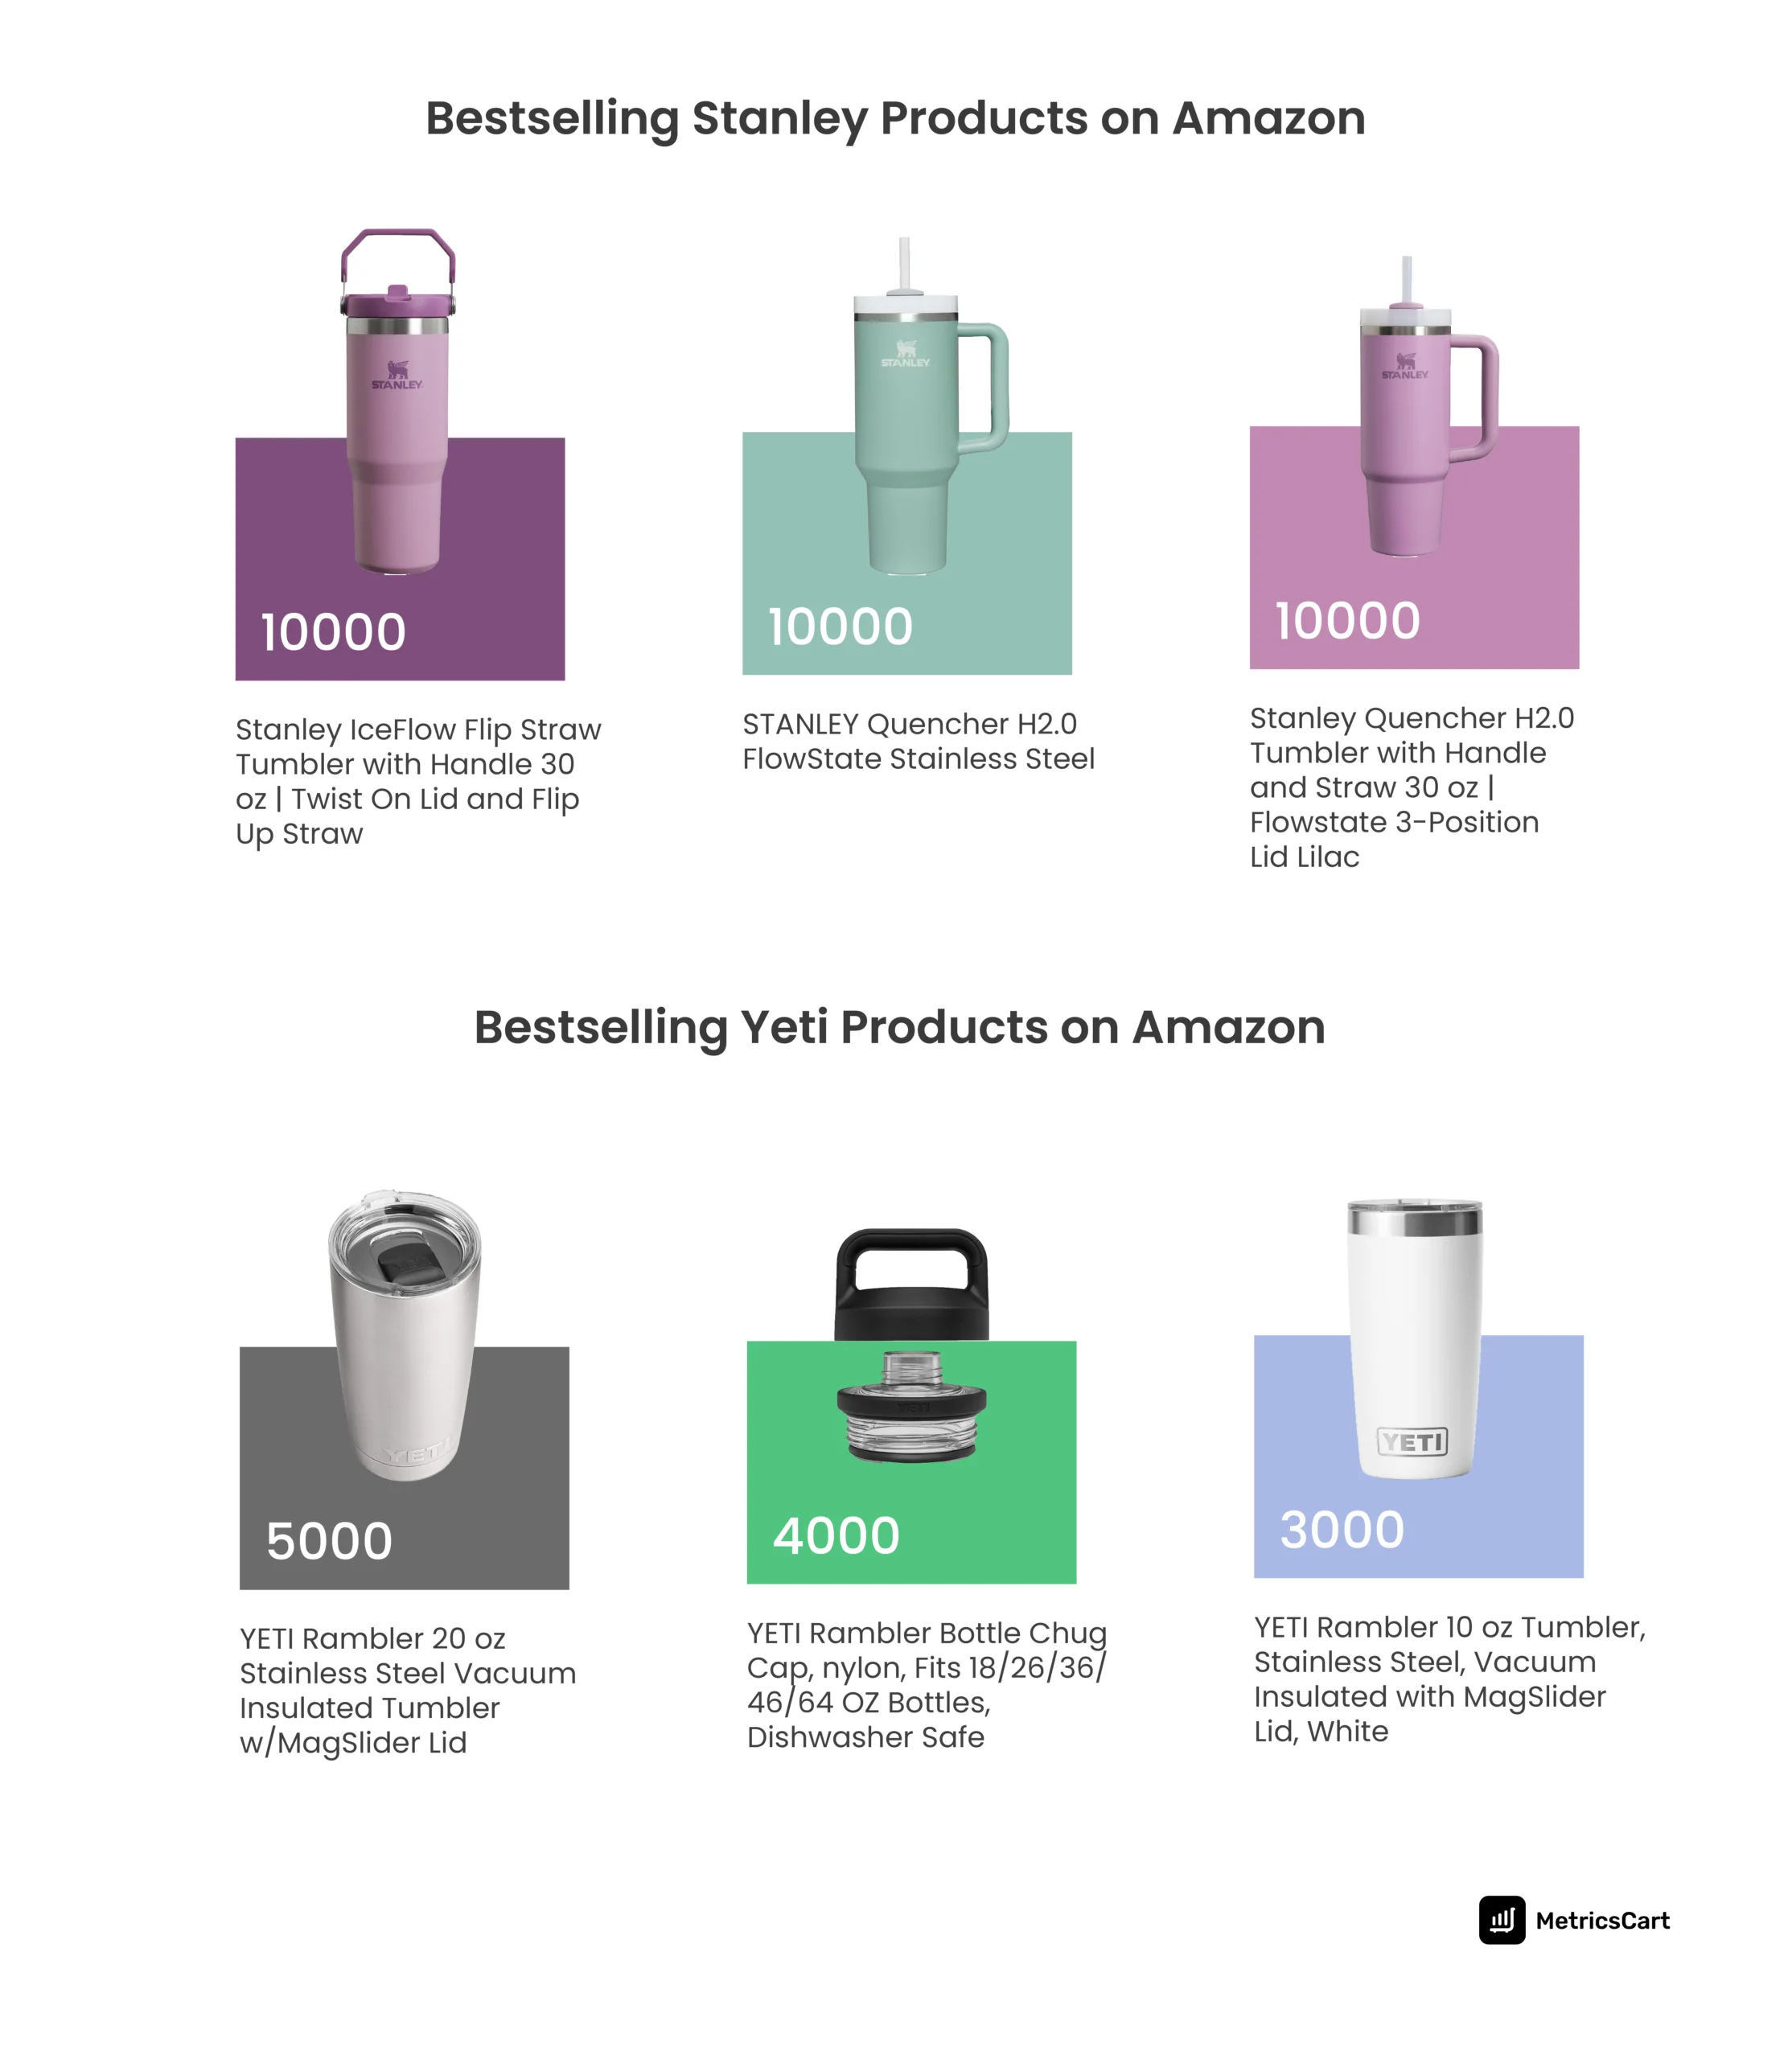
Stanley’s best-selling products, like the IceFlow Flip Straw Tumbler and Quencher H2.0 FlowState Tumbler, lead in monthly sales, with each selling around 10,000 units per month.
This success is a direct reflection of the growing demand for trendy, functional drinkware in the US, where consumers are seeking stylish, portable solutions for hydration that fit into a lifestyle of convenience and self-expression.
Stanley has made its products highly coveted among younger generations who prioritize aesthetics and exclusivity.
On the other hand, Yeti’s best-sellers, such as the 20 oz Rambler Tumbler and Chug Cap, focus on rugged durability and outdoor performance, reflecting its roots in the outdoor gear market.
These products, while strong in their performance-driven appeal, sell fewer units each month (ranging from 2,000 to 5,000) compared to Stanley.
Yeti’s premium positioning and emphasis on functional, long-lasting gear have established a loyal, niche customer base, but it’s less aligned with the lifestyle drinkware trend that Stanley dominates, which is driven by a younger, trend-sensitive demographic.
Most Expensive Stanley and Yeti Products on Amazon
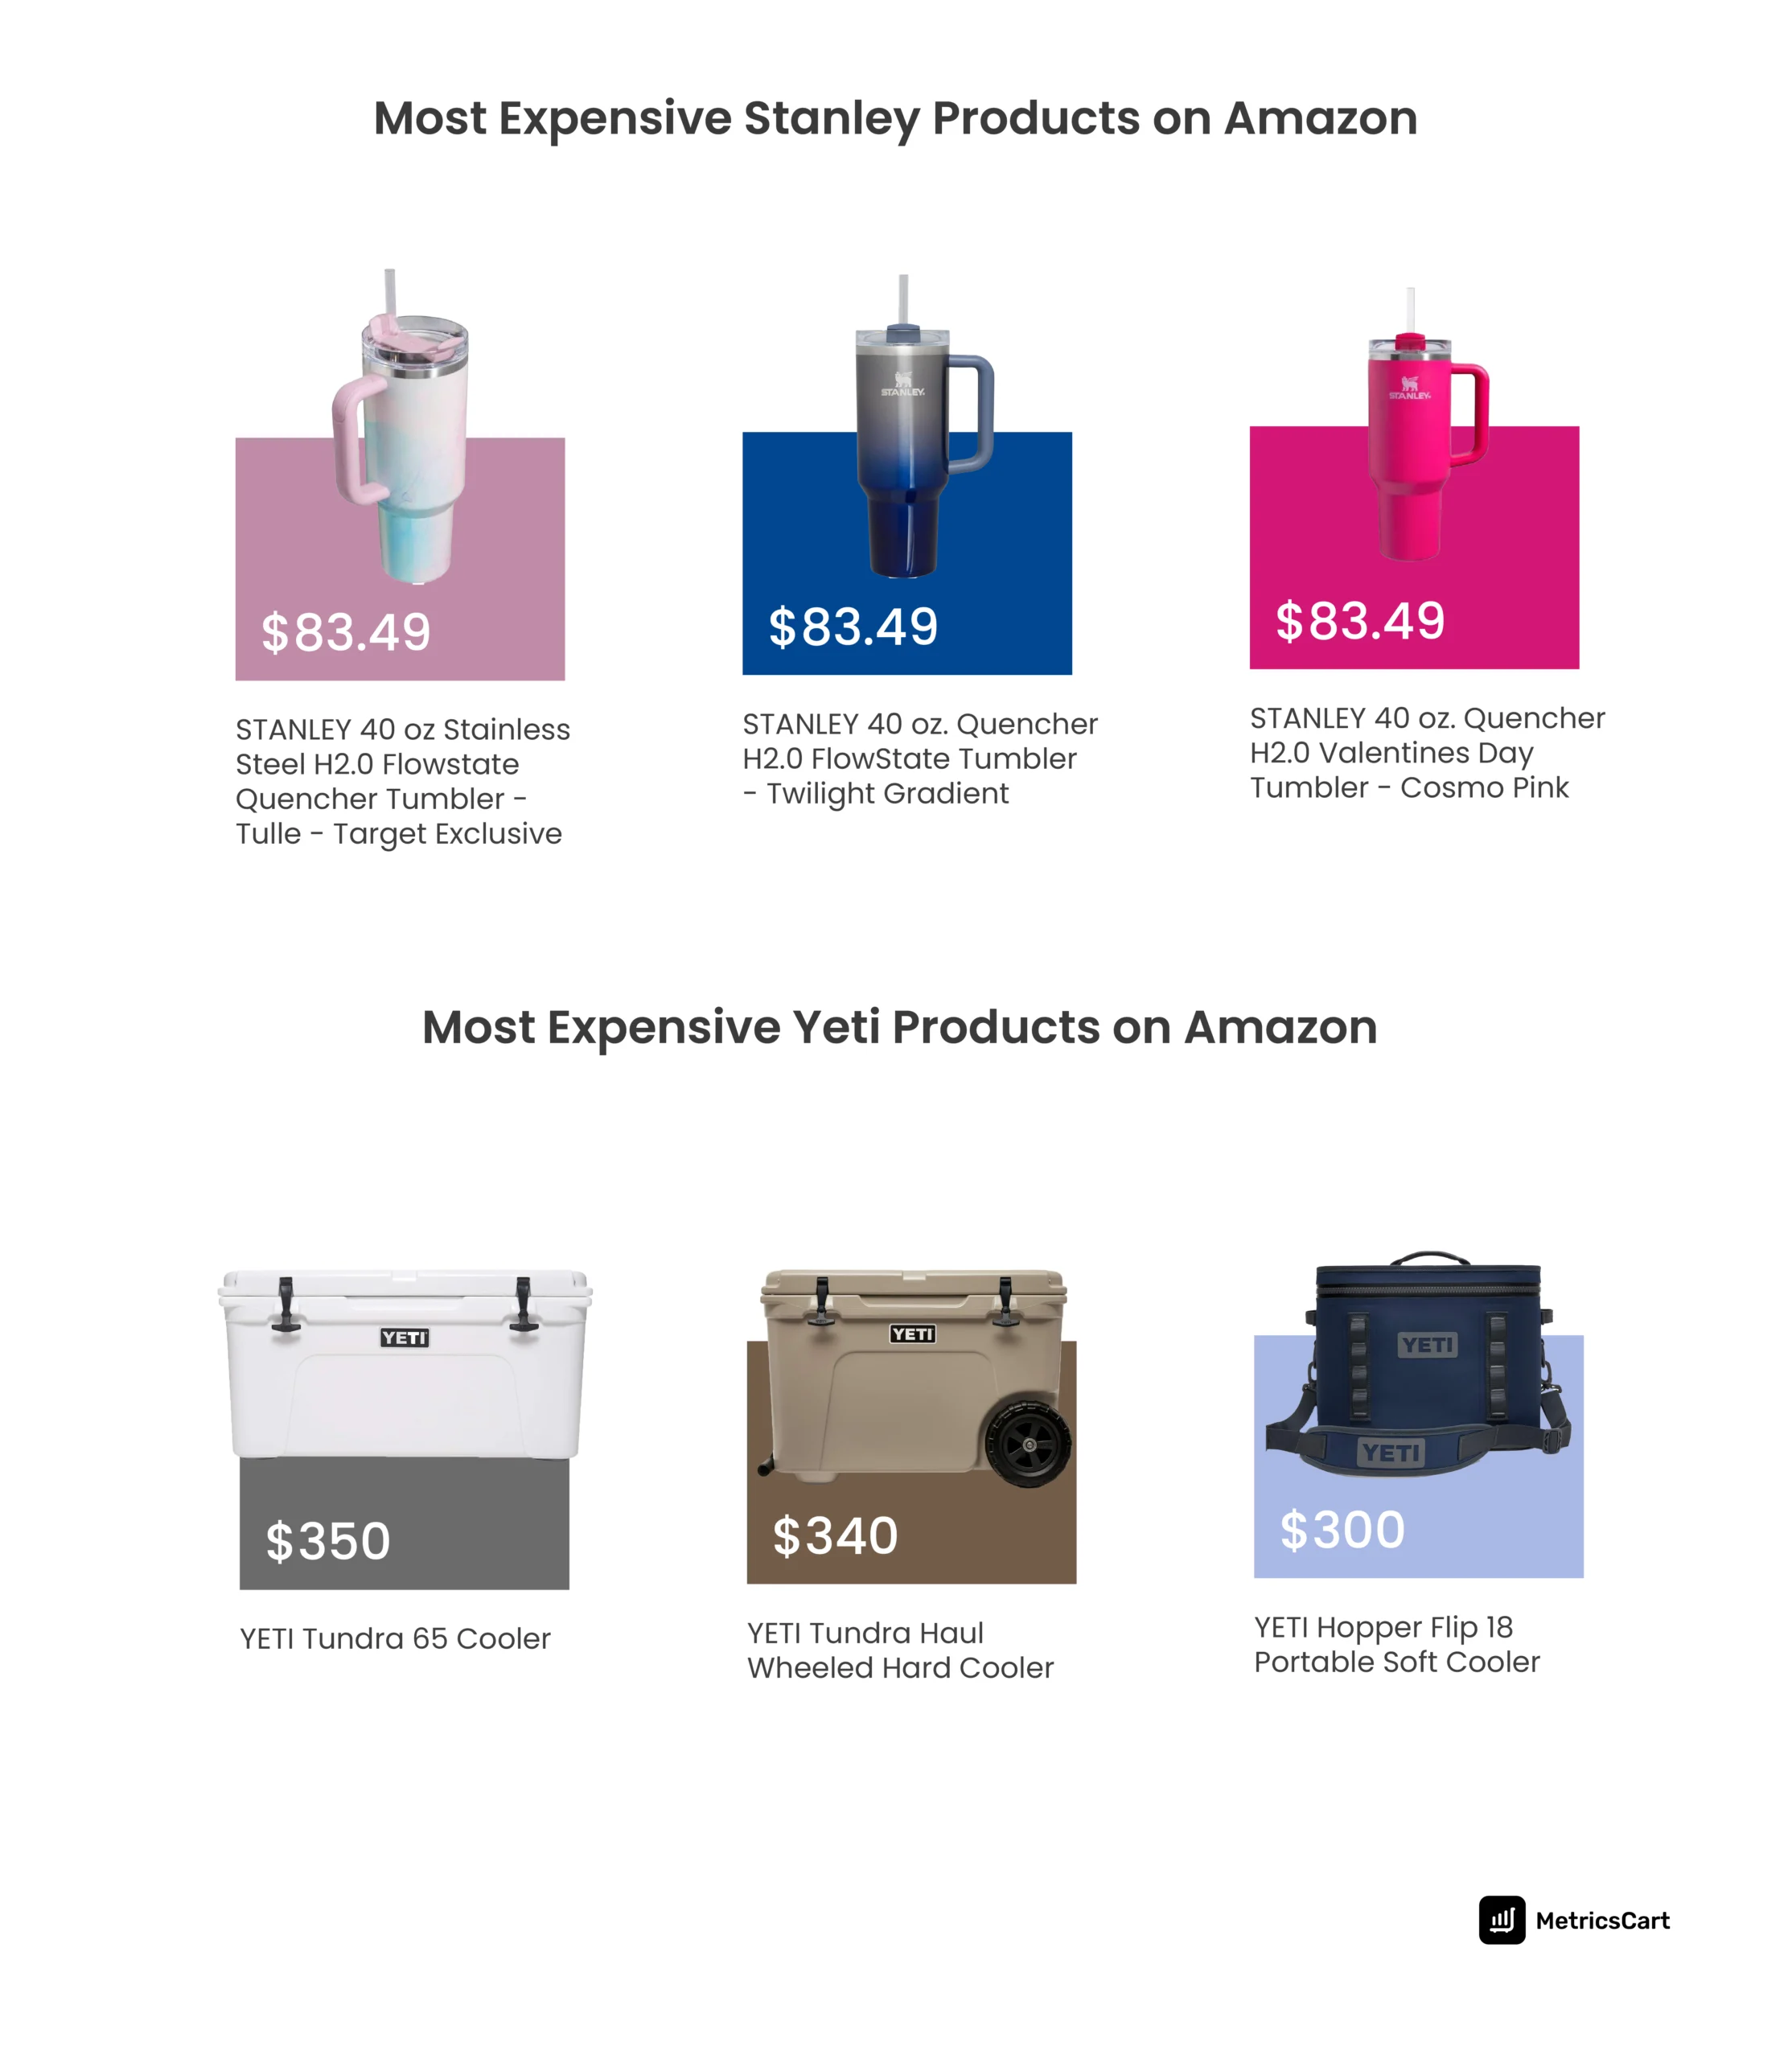
The pricing strategy behind Stanley’s and Yeti’s most expensive products on Amazon reflects their distinct brand positioning and consumer bases. Stanley’s 40 oz Quencher Tumblers, priced at $83.49, are positioned as premium lifestyle drinkware that taps into the growing demand for stylish, functional products.
The higher price is justified by the product’s premium build, innovative design features like spill-proof lids, and its aesthetic appeal, all of which resonate with consumers who are willing to invest in products that are not just functional but also part of a lifestyle trend.
In contrast, Yeti’s most expensive products, such as the Tundra 65 Cooler ($350) and Hopper Flip 18 Soft Cooler ($300), are priced higher due to their durable, high-performance materials.
These products are aimed at consumers who prioritize longevity, weather resistance, and outdoor utility. Yeti has established its premium positioning by designing outdoor gear that withstands harsh conditions, making it a go-to choice for adventurers and outdoor enthusiasts.
The premium price is supported by the long-term investment value these coolers offer, appealing to consumers who are willing to pay a premium for long-lasting performance rather than aesthetic appeal.
In both cases, consumers are willing to pay a premium because each brand’s products deliver distinct value.
READ MORE| Want to know how value-based pricing can work for your brand? Check out Everything You Need to Know About Implementing Value-Based Pricing.
Stanley’s Average Price at $24.74 is Higher Than Yeti’s at $21.13
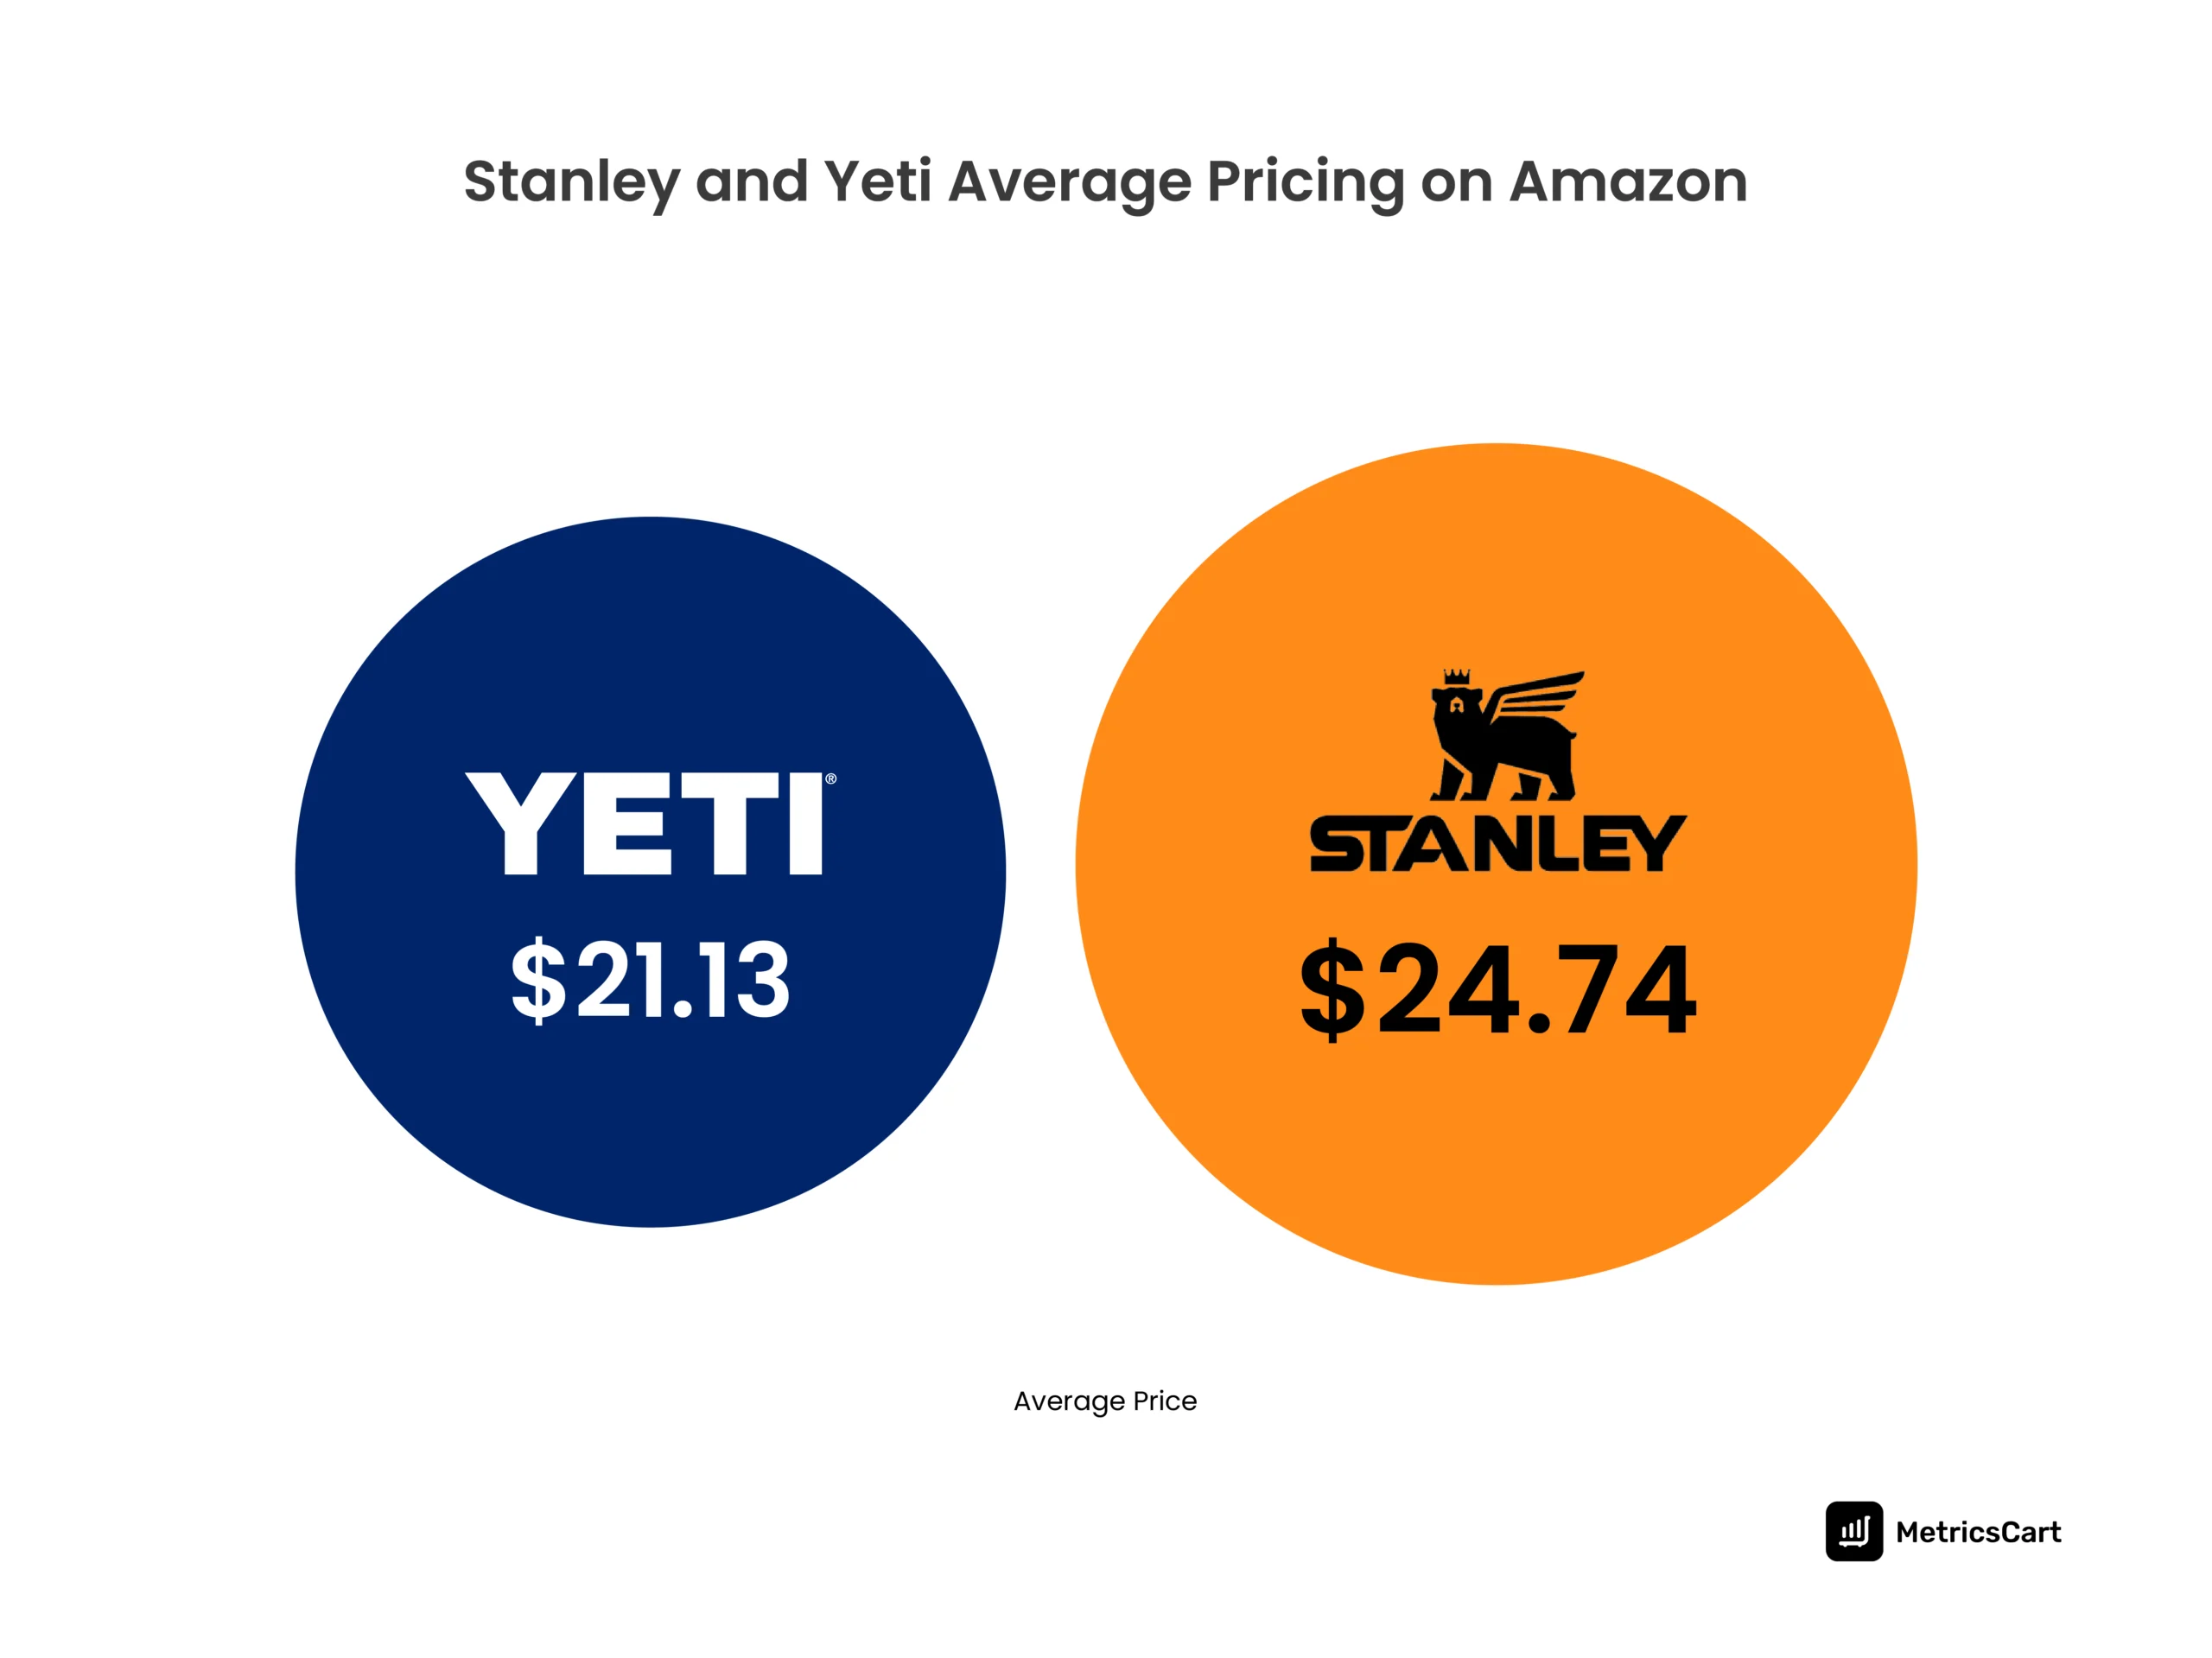
The average price of Stanley products on Amazon ($24.74) being higher than Yeti’s ($21.13) reflects a strategic positioning that aligns with Stanley’s brand identity as a premium lifestyle drinkware company.
The slightly higher price point allows Stanley to offer a combination of premium materials, innovative design, and aesthetic appeal. These are key attributes that resonate with consumers seeking drinkware that fits both their practical needs and personal brand.
The higher price reflects the increasing demand for stylish, customizable drinkware in the market, where consumers are willing to invest more in products that align with their lifestyle choices.
On the other hand, Yeti’s lower average price supports its focus on durability and performance. Yeti’s pricing is tailored to appeal to customers who prioritize functionality and ruggedness, key attributes for outdoor enthusiasts.
While Yeti’s product quality is undeniably high, its more accessible price point helps the brand reach a broader audience looking for high-performance gear at a slightly lower cost, making it more appealing for practical everyday use.
Overall, Stanley’s higher average price reflects its dual focus on both premium quality and lifestyle branding. At the same time, Yeti’s lower average pricing allows it to cater to its functionality-focused market without straying too far from affordability.
Stanley’s Average Discount at 1.34% is Higher than Yeti’s at 0.18%
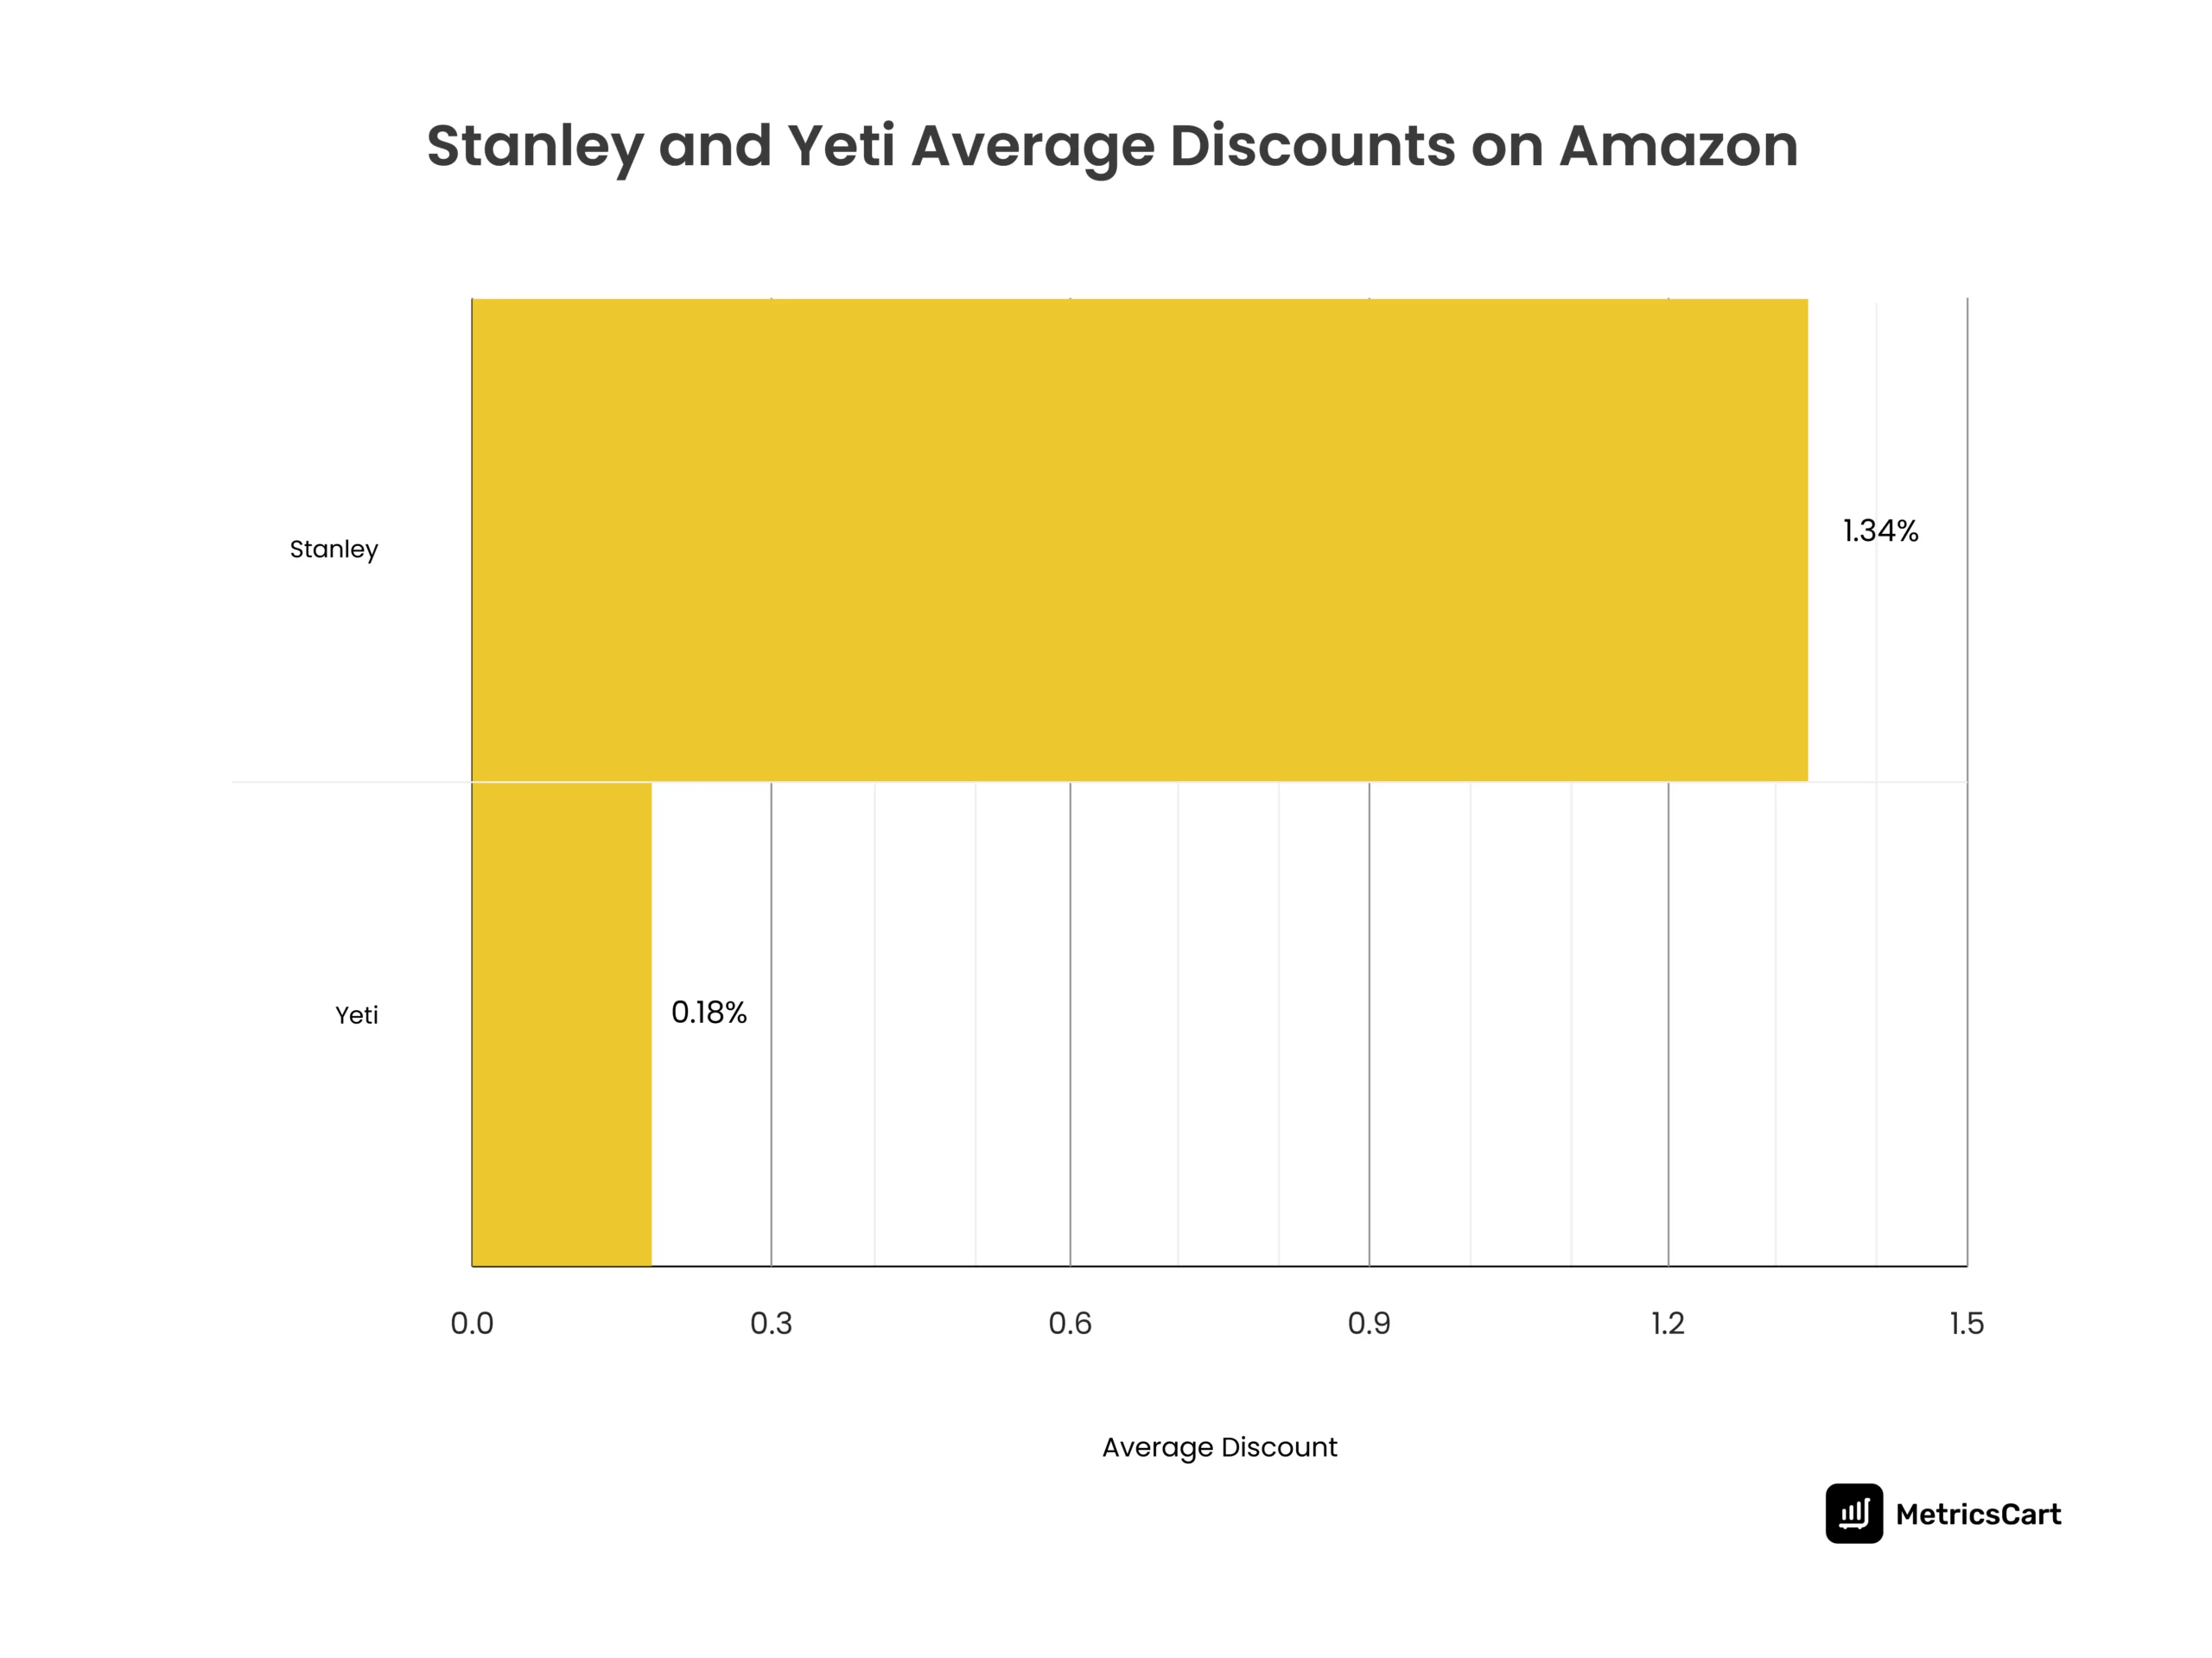
The average discount for Stanley on Amazon (1.34%) is significantly higher than Yeti’s (0.18%), reflecting a key aspect of each brand’s pricing strategy.
Stanley’s higher discount rate indicates that it is more aggressive in using promotions and discounts to drive volume sales and build brand awareness, especially in a highly competitive lifestyle drinkware market.
Stanley is focused on appealing to a broad, trend-sensitive audience. Therefore, Stanley’s higher discount rate reflects its strategy to use promotional pricing as a tool for rapid market penetration
In contrast, Yeti’s lower discount rate aligns with its premium outdoor positioning, where high-end durability and quality are emphasized over price.
By maintaining minimal discounts, Yeti preserves its luxury appeal, signaling to consumers that its products, though high in quality, are not reliant on discount-driven sales to uphold their premium status.
With MetricsCart’s data-driven pricing and promotion solution, get the right data to tune your pricing and discount strategies to align with market trends, customer expectations, and competitive positioning.
Stanley’s Leads In Review Volume, While Yeti Bags Higher Average Rating
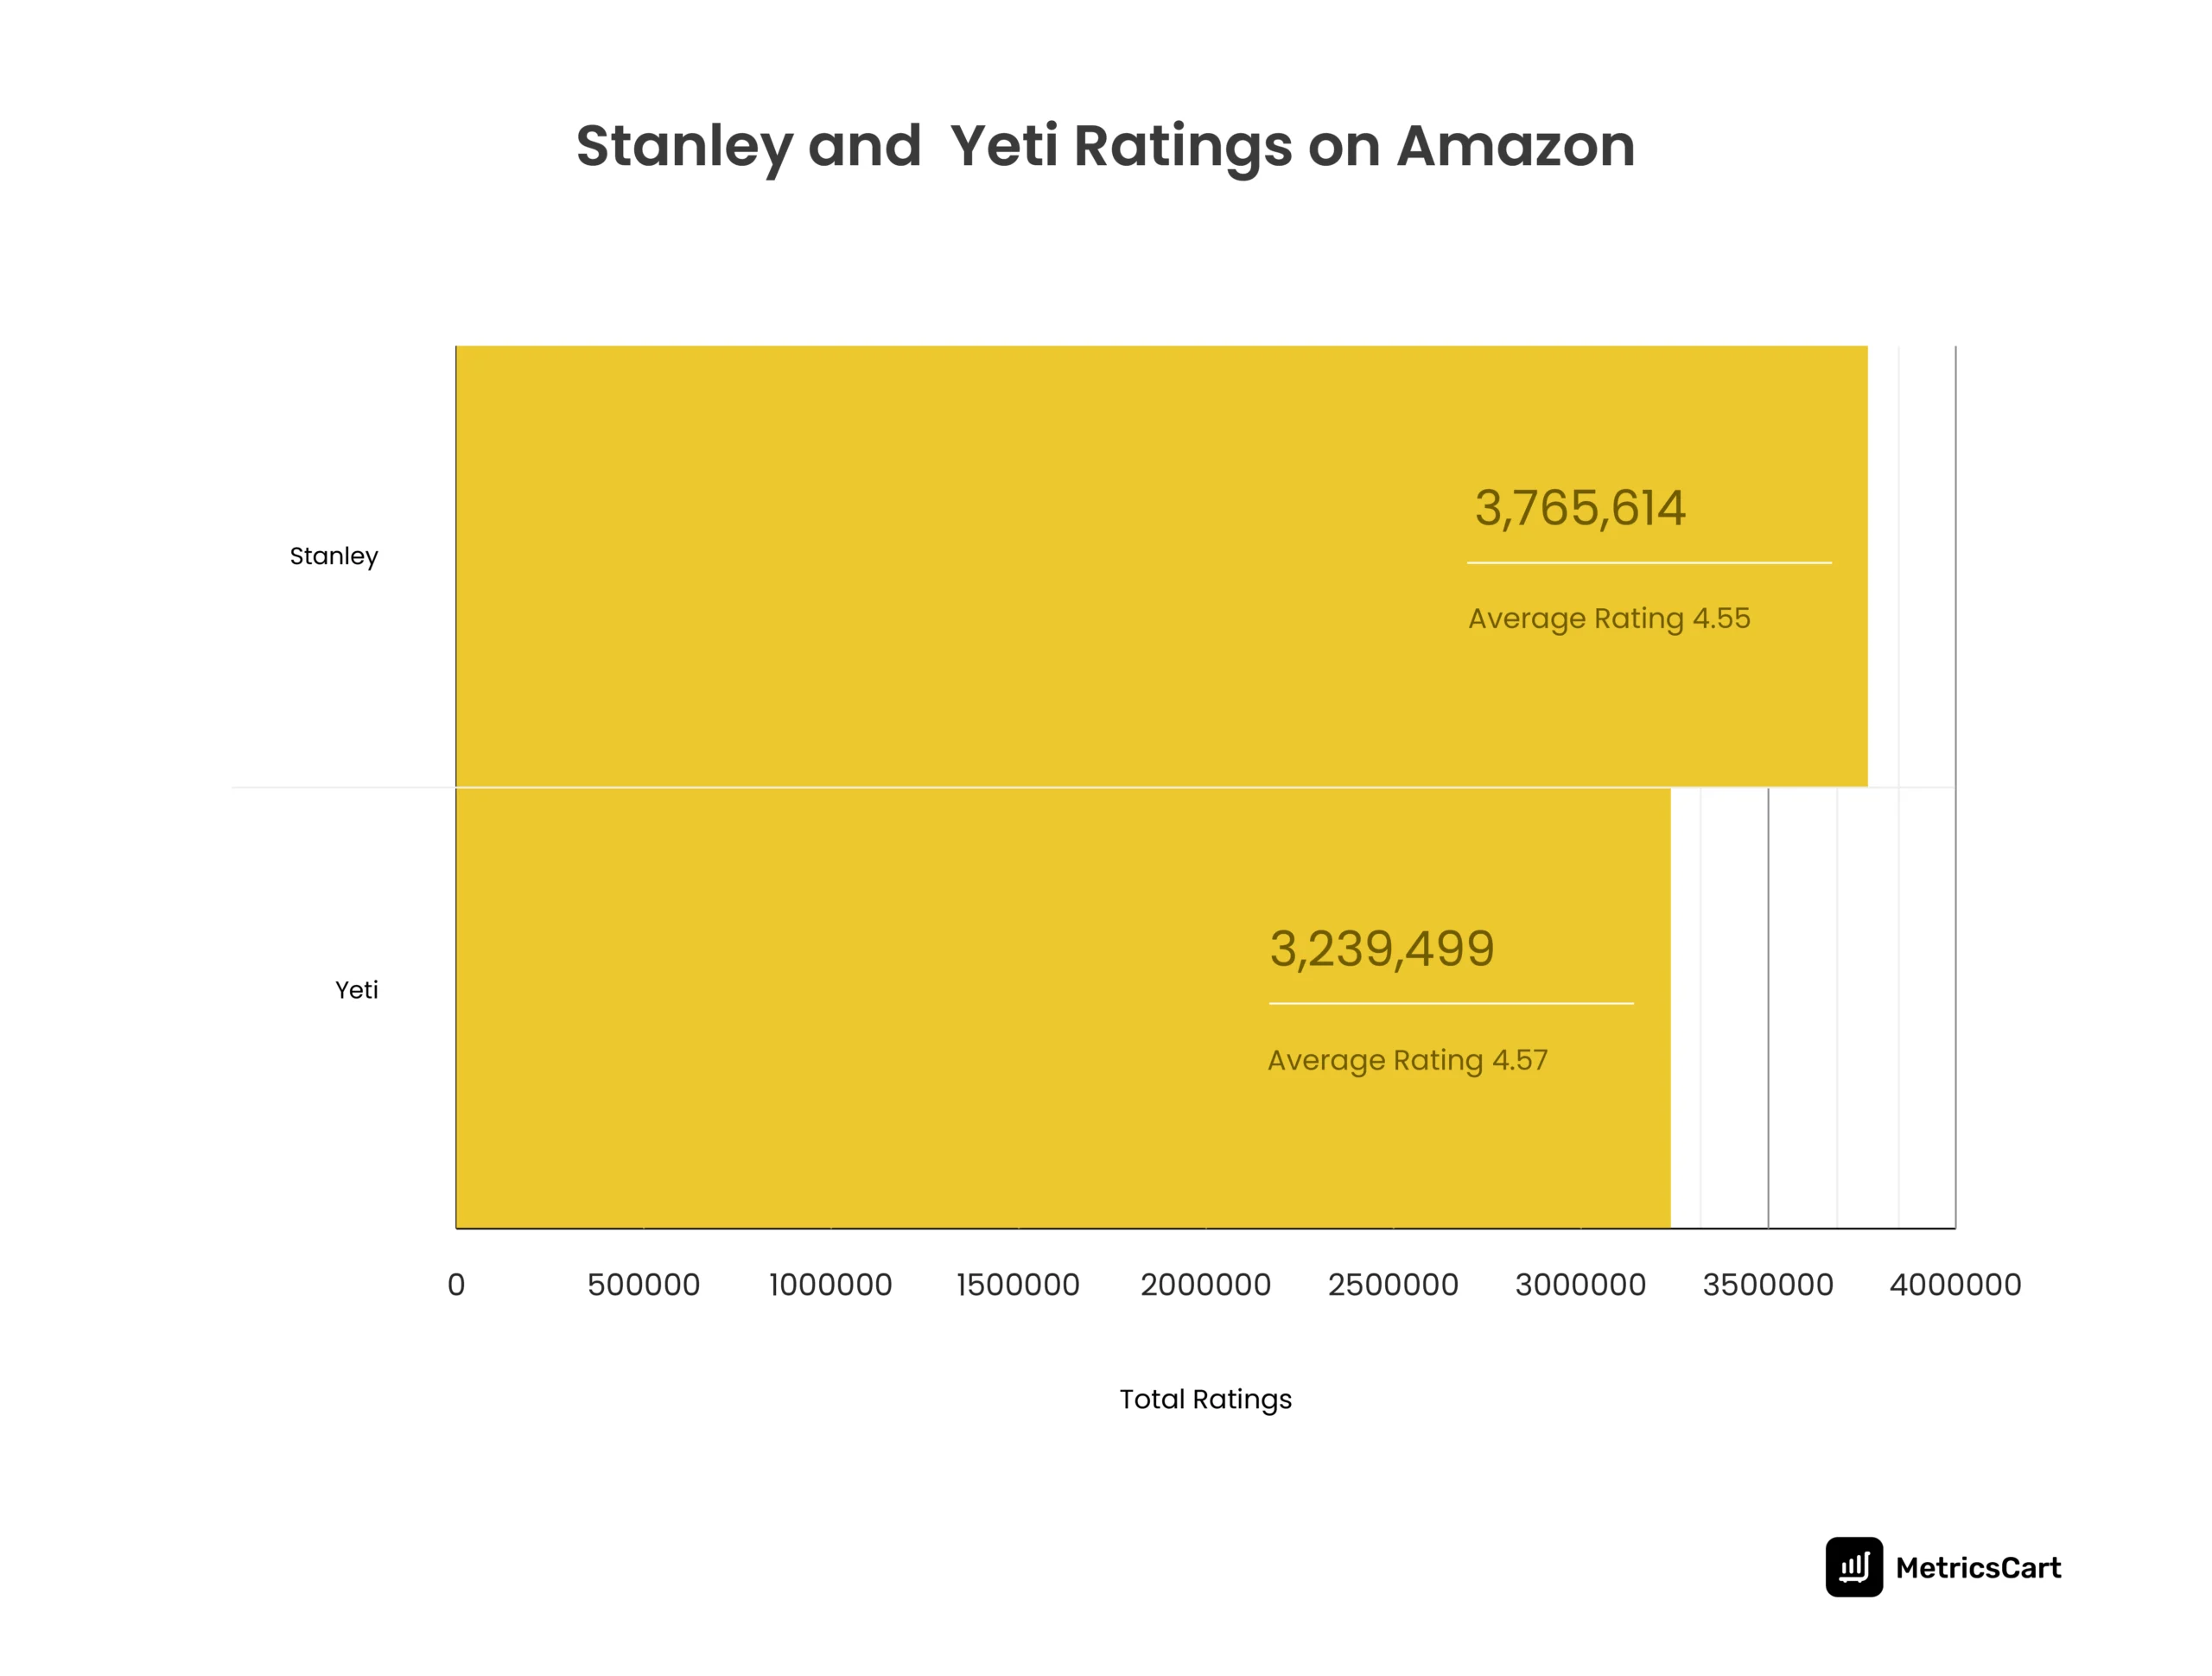
The data reveals that Stanley has garnered 3.76 million ratings, surpassing Yeti’s 3.24 million ratings, suggesting that Stanley is experiencing higher customer engagement on Amazon.
This could be due to Stanley’s more frequent product launches, social media trends, and the wide variety of design options it offers, which likely encourage more customer interaction.
The higher volume of ratings signals that Stanley is attracting a larger and more diverse customer base, engaging first-time buyers, and benefiting from word-of-mouth due to its visual appeal and trendy products.
However, Yeti’s average rating of 4.57, which is slightly higher than Stanley’s 4.55, indicates that while Stanley receives more feedback, Yeti’s customers are slightly more satisfied with their purchases.
This higher rating could reflect the consistency and reliability that Yeti customers experience, especially those purchasing for long-term use.
Yeti’s smaller but more dedicated customer base appears to show stronger loyalty and more overall satisfaction with the product, aligning with its reputation for providing quality and long-lasting value.
With MetricsCart’s ratings and review tracking, decode what customers think about your brand and fine-tune your product offerings to better meet consumer needs and boost sales.
What’s Next For Stanley vs. Yeti?
As the Stanley vs. Yeti showdown progresses, the US drinkware market is shifting, and both brands are adapting to new e-commerce trends and changing consumer preferences.
Stanley has found its sweet spot with social media-driven appeal, drawing in a younger, trend-savvy crowd that values exclusive, eye-catching designs. Expect more influencer partnerships, viral product releases, and a continued focus on stylish drinkware that speaks to the lifestyle of today’s generation.
Meanwhile, Yeti, with its strong outdoor performance heritage, faces a challenge in capturing the growing demand for fashionable yet functional products. As drinkware becomes not just about hydration but about expression, Yeti must decide whether to maintain its focus on rugged, performance-driven gear or adapt to this shift by adding more aesthetic options to its lineup.
With premium drinkware becoming a lifestyle accessory, both brands are tasked with balancing durability with style.
Let’s Wrap Up: So Who Won The Cup?
As consumer preferences evolve, the real question is: Can Stanley sustain its viral momentum and transition into long-term brand loyalty, or will it fade once the next trend hits?
On the other hand, can Yeti tap into the growing demand for stylish, everyday drinkware, or will it stick solely to its outdoor roots and risk being left behind?
The market is shifting, and both Stanley and Yeti will have to keep adapting if they want to stay at the top.
The cup is still up for grabs, but for brands that actively adapt to customer trends and e-commerce shifts.
With MetricsCart’s Digital Shelf Analytics, you can gain real-time insights into pricing, promotions, and customer sentiment, helping you stay competitive and make informed decisions. Ready to make your move? Contact MetricsCart and start optimizing your digital shelf strategy today!
Disclaimer: MetricsCart is the exclusive owner of data used in the Digital Shelf Insights reports. Any kind of third-party usage entails due credit to the source material.
Ready To Take Control of Your Brand Performance? Strategize With Our Digital Shelf Solutions!