Running is having a moment again. Big races are pulling in record demand, and participation keeps climbing. Reuters reported the New York City Marathon drew 200,000+ applications for 2025, up 22% year over year, and the 2024 race had 55,646 finishers.
When the category grows, expectations rise with it. People are not just buying shoes. They are buying injury prevention, comfort for long shifts, daily trainer reliability, and a product update that does not break what they already love.
This MetricsCart running shoes report is built to answer a practical question behind every “best running shoes 2026” list: Which brands are genuinely winning customer satisfaction, and why?
About The Report
This report analyzes customer feedback through MetricsCart’s voice of customer (VoC) analysis, delving into insights from 8,580 reviews across 15 running shoe models (November 2024 – November 2025) from five key brands: ASICS, Brooks, Hoka, New Balance, and Altra, collected across brand DTC sites, major retailers, and Google Shopping aggregation.
The goal is to identify what consumers truly value in running shoes for runners and understand where top brands excel or fall short. By evaluating customer sentiment, product strengths, and emotional language, this report offers an in-depth view of the best running shoes for 2026.
You can think of this report as three layers. First is the “what” layer: ratings, mention rates, and leaderboards (who ranks where). Second is the “why” layer: aspect drivers (comfort vs fit vs durability), issue clustering (toe box, heel, lacing), and use-case differences. Third is the “so what” layer: advocacy and churn signals, version regression warnings, and where the category is structurally vulnerable.
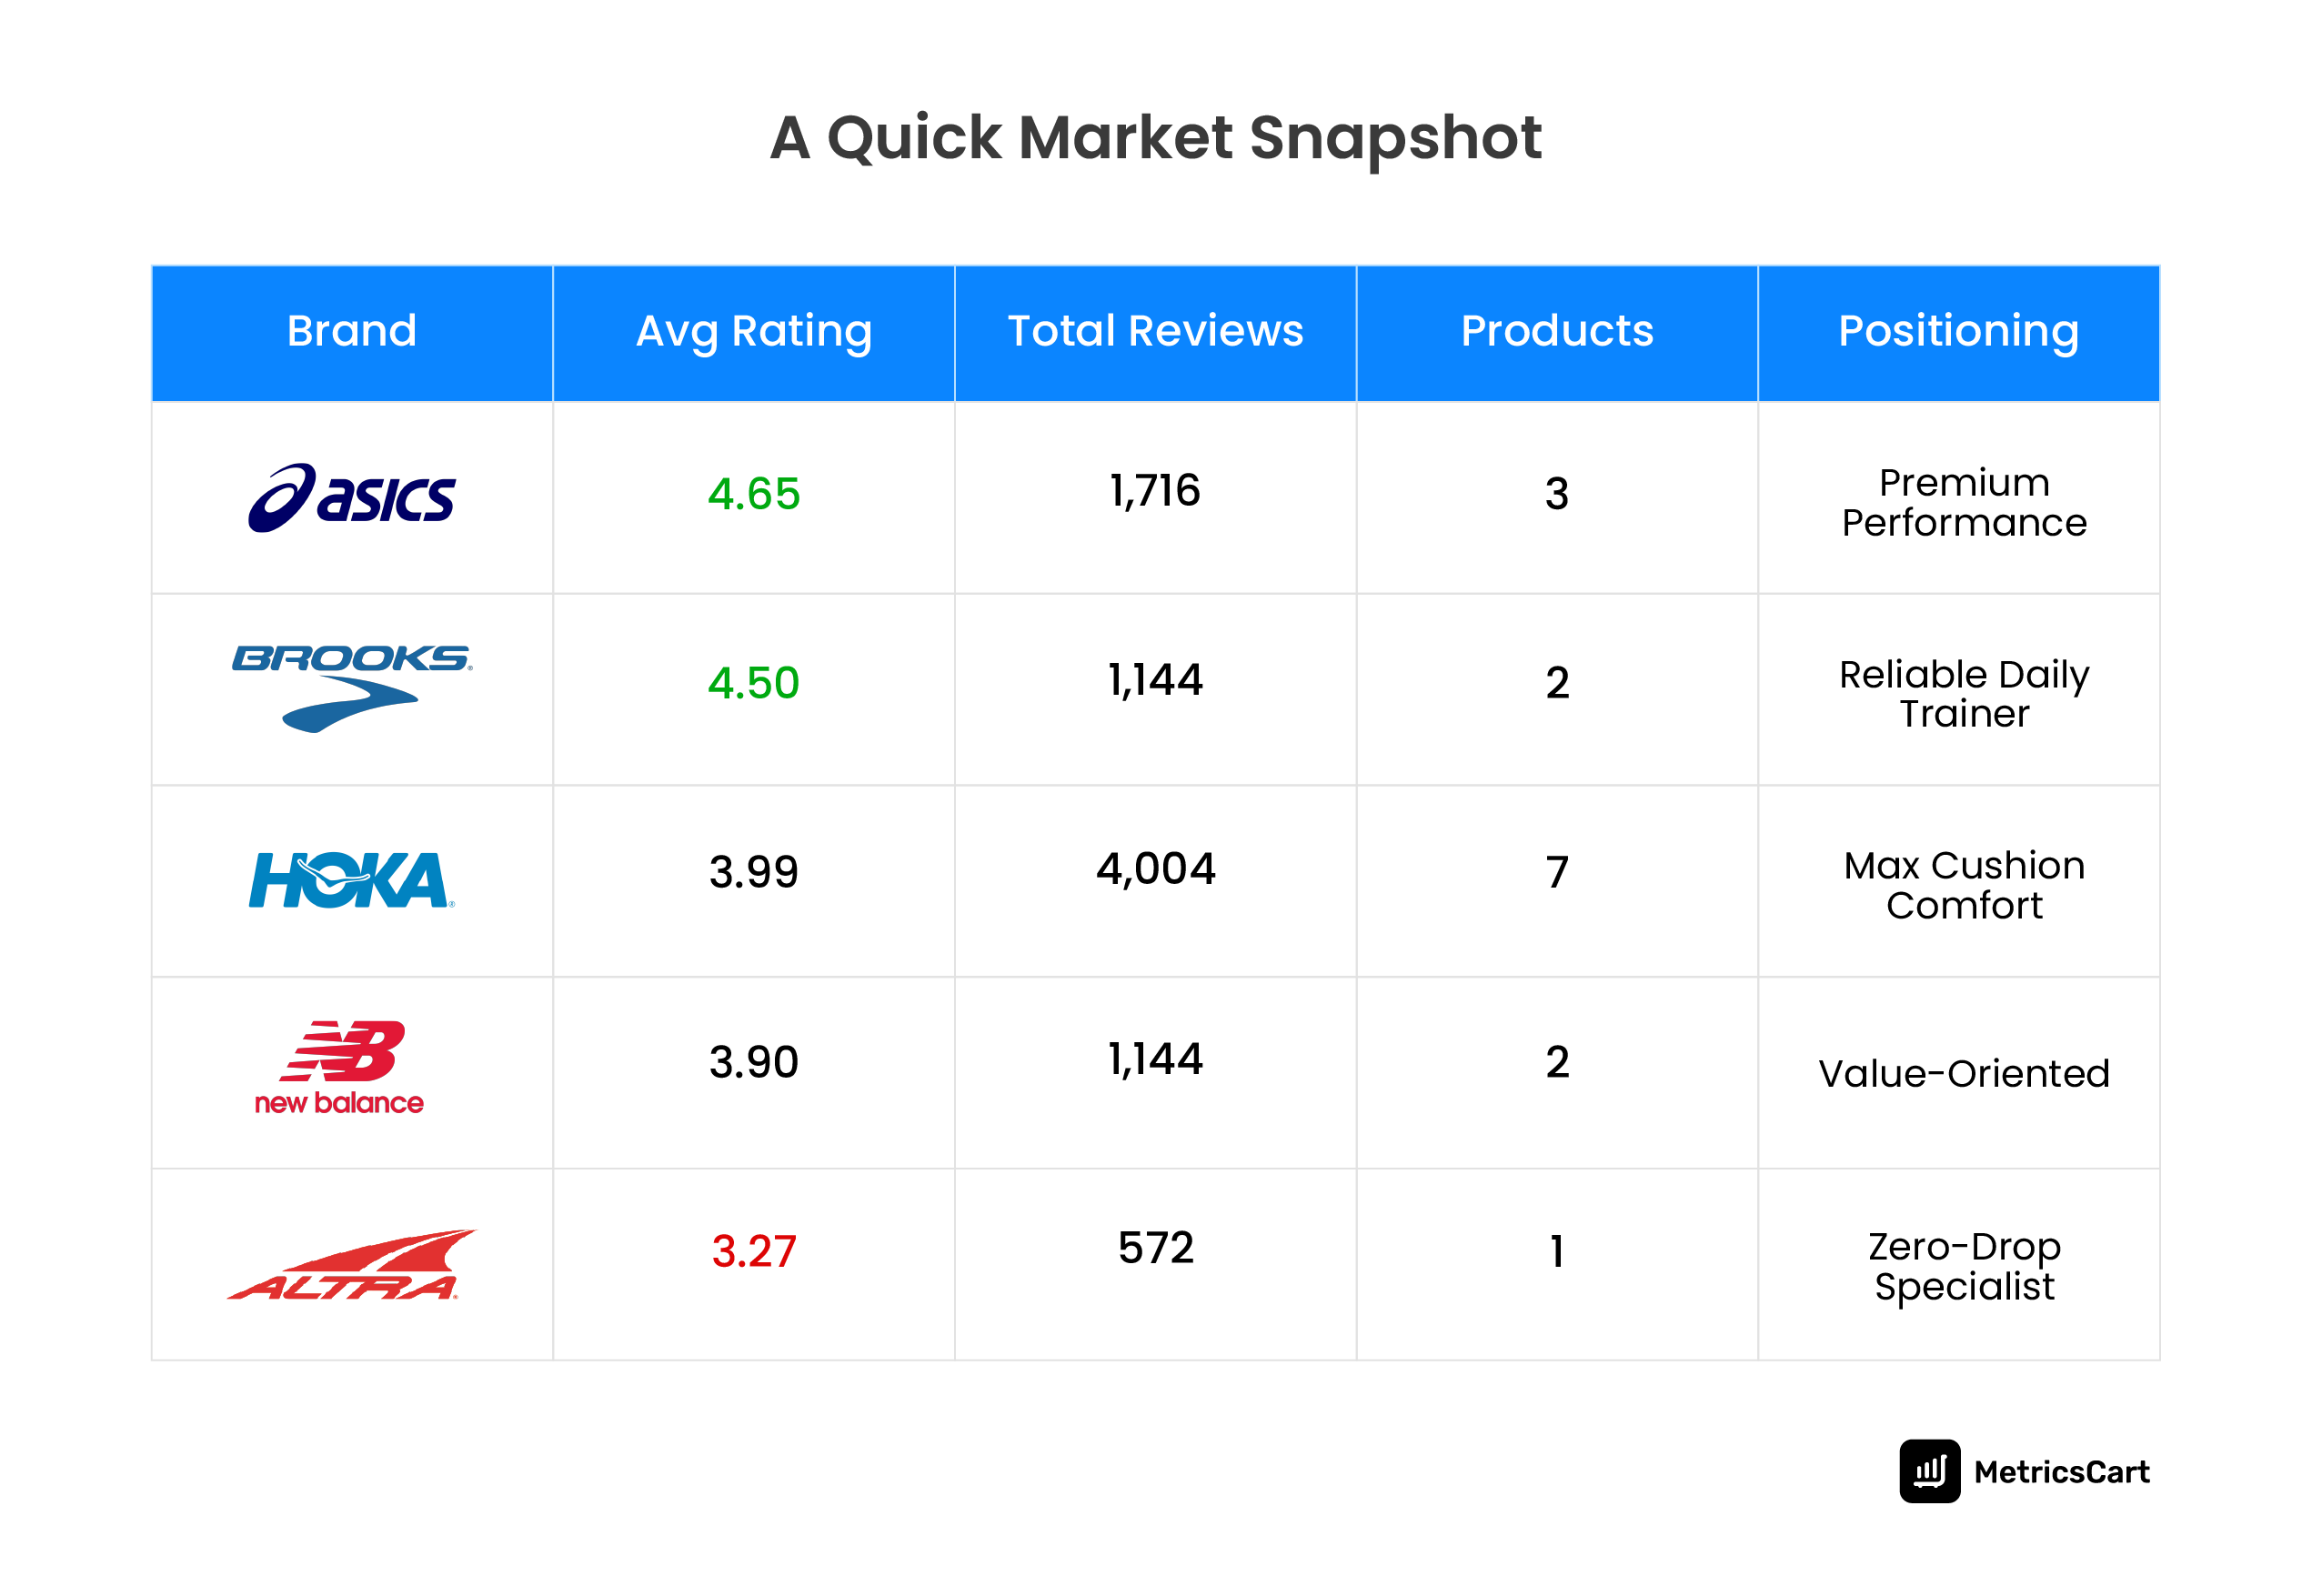
- ASICS emerges as the leader, with an average rating of 4.65, driven by the success of its models like the Novablast 4, which excel in comfort and durability.
- Brooks, while a strong competitor, holds an average rating of 4.50. The Brooks Glycerin Max stands out as a reliable choice for runners who prioritize consistent performance across different use cases.
- Hoka, with its aggressive marketing and high volume, falls behind in customer satisfaction, achieving a 3.99 average rating due to recurring issues with fit and regressions in its newer models.
- New Balance presents a mixed picture. While its models like the 1080v14 have garnered positive feedback, concerns around price perception and fit consistency result in an average rating of 3.90.
- Altra, particularly with the Torin 7, faces significant challenges, as its average rating of 3.27 reflects deep dissatisfaction, largely driven by fit issues and poor customer experience.
Best Running Shoes in 2026 by Customer Sentiment
| # | Product | Rating | Positive | Neutral | Negative | Reviews |
| 1 | ASICS Novablast 4 | 4.68 | 92.7% | 3.3% | 4.0% | 572 |
| 2 | ASICS Superblast | 4.65 | 90.9% | 3.3% | 5.8% | 572 |
| 3 | ASICS Noosa Tri 15 | 4.63 | 91.4% | 3.7% | 4.9% | 572 |
| 4 | Brooks Ghost 16 | 4.58 | 89.7% | 4.2% | 6.1% | 572 |
| 5 | Brooks Glycerin Max | 4.42 | 83.7% | 7.7% | 8.6% | 572 |
| 6 | Hoka Bondi 8 | 4.25 | 78.5% | 8.0% | 13.5% | 572 |
| 7 | Hoka Clifton 9 | 4.21 | 77.8% | 7.5% | 14.7% | 572 |
| 8 | Hoka Bondi 9 | 4.15 | 75.2% | 8.4% | 16.4% | 572 |
| 9 | New Balance 1080 v14 | 4.10 | 74.5% | 8.7% | 16.8% | 572 |
| 10 | Hoka Clifton 10 | 4.09 | 74.8% | 7.5% | 17.7% | 572 |
| 11 | Hoka Arahi 6 | 4.01 | 71.9% | 9.6% | 18.5% | 572 |
| 12 | Hoka Arahi 7 | 3.81 | 65.0% | 10.8% | 24.1% | 572 |
| 13 | New Balance Arishi v4 | 3.71 | 62.4% | 13.8% | 23.8% | 572 |
| 14 | Hoka Mach X 2 | 3.42 | 54.9% | 12.9% | 32.2% | 572 |
| 15 | Altra Torin 7 | 3.27 | 44.4% | 21.5% | 34.1% | 572 |
ASICS clearly leads. Novablast 4 (#1, 4.68), Superblast (#2, 4.65), and Noosa Tri 15 (#3, 4.63) combine very high ratings with 90%+ positive sentiment. That balance signals consistency. These shoes work for a wide range of runners with minimal downside, which is exactly what people expect when searching for the best running shoes for runners.
Brooks follows as the safe, dependable choice. Ghost 16 (#4, 4.58) and Glycerin Max (#5, 4.42) show strong satisfaction and controlled negatives. They may not dominate the top three, but they deliver predictable comfort and support, making them frequent picks in searches like Best Running Shoes for Men in 2026 and Best Running Shoes for Women in 2026.
The middle of the table captures Hoka’s uneven performance. While models like Bondi 8 and Clifton 9 sit in the upper half, satisfaction drops steadily across newer versions. Rising negative sentiment lower down the list shows how version changes are starting to erode trust, even though Hoka remains highly visible.
New Balance shows a split experience. 1080 v14 (#9, 4.10) performs reasonably well, while Arishi v4 (#13, 3.71) struggles, reinforcing that product choice within the brand matters significantly for shoppers evaluating the top running shoes 2026.
At the bottom, Hoka Mach X 2 and Altra Torin 7 stand out for the wrong reasons. With negative sentiment above 30%, both models act as caution flags in the category. In best-of research journeys, these products shape brand perception far beyond their individual sales.
READ MORE | Crocs Marketing Strategy: Insights Into The $4 Billion “Ugly Shoe” Brand
Aspect-Level VoC: What Actually Drives (or Hurts) Ratings
Understanding the key aspects that drive customer satisfaction is crucial for brands looking to make it into the list of best running shoes in 2026. By analyzing customer reviews through aspect-based filters, we can identify the core features that matter most to consumers.
Which Aspects Matter Most to Shoppers?
Aspect Mention Frequency & Sentiment
| Aspect | Mentions | % of Reviews | Avg Rating | Signal |
| Weight | 1,070 | 12.5% | 4.43 | Best driver |
| Comfort | 3,173 | 37.0% | 4.34 | Core value |
| Running Performance | 3,396 | 39.6% | 4.22 | |
| Cushioning | 1,910 | 22.3% | 4.21 | |
| Support | 1,891 | 22.0% | 4.14 | |
| Style/Appearance | 2,212 | 25.8% | 4.07 | |
| Fit | 2,515 | 29.3% | 3.96 | Watch |
| Durability | 1,326 | 15.5% | 3.92 | Watch |
| Pain Relief | 3,526 | 41.1% | 3.90 | Mixed |
| Value/Price | 775 | 9.0% | 3.66 | Friction |
The category’s most mentioned aspect is pain relief at 41.1% of reviews, but it has a lower average rating of 3.90, marked “Mixed.” This is a classic high-importance, inconsistent delivery signal. It tells you that customers actively shop to address pain points, but many products fail to deliver consistently.
Running performance is mentioned in 39.6% of reviews with a 4.22 average, and comfort is mentioned in 37% with a 4.34 average, signalling that comfort is a core value. It is one of the few aspects where the category average stays high, which means comfort is table stakes for being considered among the top running shoes of 2026.
The category’s strongest best driver is weight, with a 4.43 average rating. Lightweight feel is often where delight shows up quickly in reviews, especially for runners comparing multiple models and trying to avoid fatigue.
Where the Market Is Fragile
Our data unveiled that fit (3.96) and durability (3.92) are watch areas. In practical terms, that means these are frequent enough and weak enough to drag down ratings, even for otherwise strong products. That is reinforced by the long-term user finding: 6+ month users rate 3.87, below the overall average of 4.13.
The hardest friction point is value. Value/Price averages 3.66, and does not mean customers only care about low prices. It means that when the experience disappoints, price becomes the amplifier that turns dissatisfaction into strong negative language.
Best-In-Class vs Worst-In-Class by Aspect (Who Owns Comfort, Support, Durability, Fit)
Best-in-Class by Aspect
| Aspect | Best Product | Worst Product |
| Comfort | ASICS Novablast 4 (4.86) | Altra Torin 7 (3.48) |
| Support | Brooks Ghost 16 (4.82) | NB Arishi v4 (3.58) |
| Durability | ASICS Novablast 4 (4.74) | NB Arishi v4 (3.10) |
| Cushioning | ASICS Superblast (4.70) | Hoka Arahi 7 (3.61) |
| Fit | ASICS Novablast 4 (4.61) | Altra Torin 7 (3.30) |
| Weight | ASICS Superblast (4.89) | Hoka Mach X 2 (3.78) |
Here is where category ownership sits. ASICS Novablast 4 is best on comfort (4.86), durability (4.74), and fit (4.61), while Altra Torin 7 is worst on comfort (3.48) and fit (3.30). Brooks Ghost 16 is best on support (4.82). ASICS Superblast leads cushioning (4.70) and weight (4.89).
This distribution matters because it suggests ASICS is not winning by one feature. It is winning multiple decision moments in the shopper’s mind: fit confidence, comfort feel, and durability trust. Brooks wins the support reliability moment. Hoka and New Balance appear more exposed because their worst-in-class placements show up in high-sensitivity areas like cushioning and weight for certain products.
Product-Specific Issue Analysis: What’s Breaking the Experience
Which Product Has the Most Critical Design Flaw
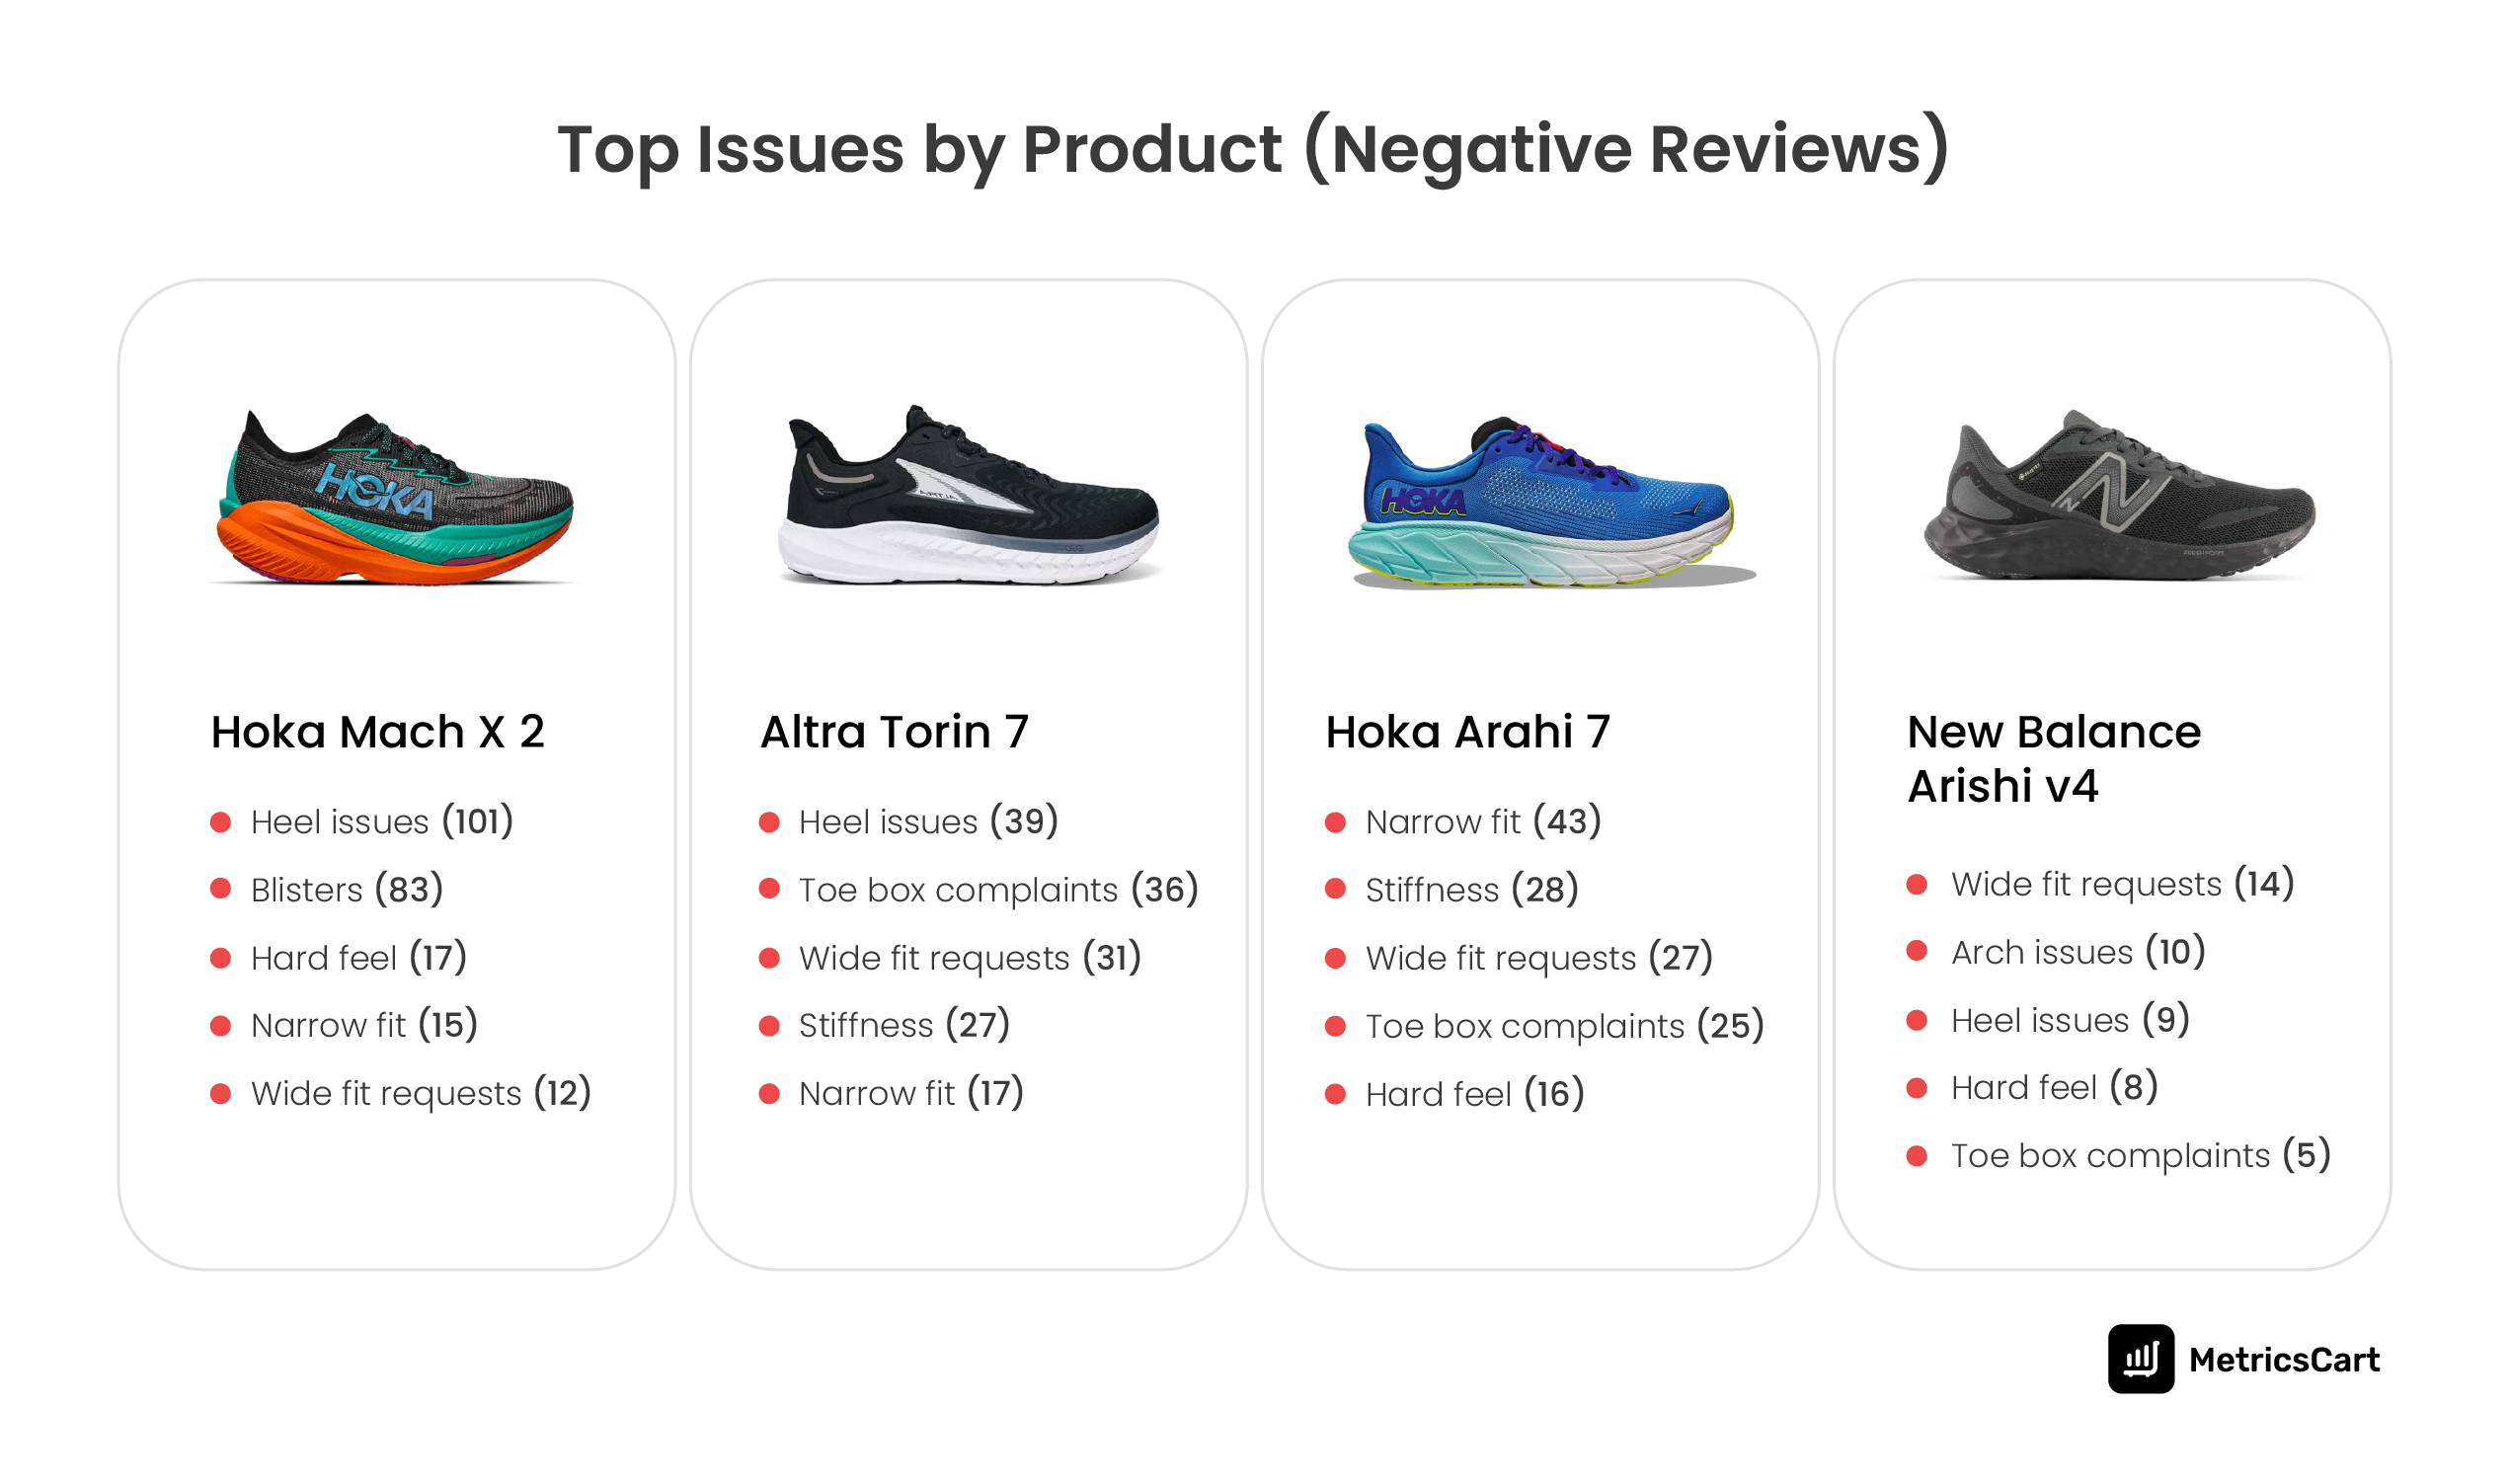
The most explicit stop and fix signal is the Hoka Mach X 2. MetricsCart data reveals that it is critical, with 101 heel complaints and 83 blister mentions in negative reviews, linked to an apparent heel counter design problem.
A defect this specific and this frequent tends to dominate review narratives, because heel pain is immediate and hard to “adjust to.” This kind of issue is also costly because it is not just a preference mismatch. It is a comfort failure. Comfort is a core value driver in the running shoes category, and heel discomfort undermines it directly.
If you are planning to make it to the list of best running shoes in 2026, this is the kind of signal that explains why some products fall off lists quickly despite marketing momentum.
Top Issues by Product (Negative Review Drivers)
The most severe products tend to have a cluster, not a single complaint. For Altra Torin 7, the negative drivers combine heel issues, toe box complaints, and stiffness, alongside conflicting fit requests.
For Hoka Arahi 7, the leading issues are narrow fit, stiffness, and repeated wide fit requests, which tie directly into why version regressions matter.
New Balance’s Arishi v4 issues cluster around wide fit requests, arch issues, and heel issues. That suggests a fit architecture problem, not just an isolated comfort complaint. When issues repeat across many reviewers, it becomes predictable enough to shape brand reputation.
Quick-Win Opportunities (Fixable Issues With High Frequency)
| Issue | Mentions | % Negative | Avg Rating | Priority |
| Wider toe box needed | 456 | 23.7% | 3.68 | HIGH |
| Lacing system issues | 272 | 26.5% | 3.49 | HIGH |
| Insole quality | 345 | 20.9% | 3.92 | MEDIUM |
| Better arch support | 141 | 18.4% | 3.97 | MEDIUM |
| Heel cup/fit issues | 68 | 14.7% | 3.66 | MEDIUM |
The largest opportunity is a wider toe box needed with 456 mentions, 23.7% negative, average rating 3.68, and high priority. The second is lacing system issues with 272 mentions, 26.5% negative, average rating 3.49, and high priority.
The key point is that these are not exotic fixes. Toe box and lacing improvements are design choices that can often be addressed without rebuilding the entire platform. Mid-tier opportunities include insole quality (345 mentions) and better arch support (141).
Heel cup and fit issues are lower frequency but still meaningful because heel pain generates intense negative language in customer reviews.
READ MORE | Product Development Using Customer Feedback: Must-Know Tips for Brands
Use-Case Segmentation: Who Buys Running Shoes & Who’s the Happiest
| Use Case | Reviews | % of Total | Avg Rating |
| Medical/Recovery | 683 | 8.0% | 4.44 |
| Gym/Cross-training | 620 | 7.2% | 4.42 |
| Walking/Daily Wear | 2,311 | 26.9% | 4.25 |
| Running/Racing | 2,989 | 34.8% | 4.24 |
| Work/Standing | 1,419 | 16.5% | 4.15 |
Which Use Cases Rate Highest vs Lowest
Use case is a major predictor of satisfaction. Medical/Recovery is the happiest segment at 4.44 (8.0% of reviews). Gym/Cross-training follows at 4.42 (7.2%). Walking/Daily Wear sits at 4.25 (26.9%). Running/Racing is the largest segment at 34.8%, but averages 4.24. Work/Standing is 16.5% of reviews and is the lowest at 4.15.
The first takeaway is that performance runners are not automatically the happiest. MetricsCart VoC data reveals that they are slightly less satisfied than medical and gym users. That often happens because performance users have narrower expectations and higher sensitivity to fit and feel changes across versions.
The second takeaway is that work and standing are large enough to matter, and low enough in satisfaction to represent a real gap. The report explicitly flags healthcare workers as a targetable niche within this segment.
What Segments Create Promoters
Medical and recovery users are promoters when shoes solve pain problems, and they become grateful and vocal. This aligns with the aspect data, where pain relief is the most mentioned topic but has mixed delivery. When a product does deliver pain relief, it creates satisfaction that often turns into strong recommendation behavior.
Gym and cross-training users also rate higher than runners, which suggests that multi-use stability and comfort can outperform narrow race-day benefits in day-to-day satisfaction. For brands, that is a strategic lever: versatility can widen the addressable market for products that still qualify as the best running shoes for runners.
Where the Opportunity Sits
Work/standing is the cleanest growth pocket in the dataset. It is not small, with 1,419 reviews, and it has the lowest satisfaction.
This matters because the product requirements are knowable: pressure distribution, fatigue reduction, heel stability, and fit comfort across long shifts. If brands treat work and standing as a first-class use case rather than a side effect of cushioning, the opportunity expands beyond running into a broader footwear demand.
It is a plausible path to grow share while still competing for top running shoes 2026 visibility.
Customer Profile Analysis: Who’s Talking & What Their Behavior Predicts
Customer profiles provide valuable insights into the behaviors, motivations, and purchasing decisions of different segments. By analyzing these profiles, brands can better understand who is most likely to leave positive or negative feedback and tailor their offerings accordingly.
Demographic Segments
| Segment | Reviews | % of Total | Avg Rating |
| Serious Runners/Athletes | 548 | 6.4% | 4.47 |
| Older Adults (50+) | 142 | 1.7% | 4.42 |
| Casual/Recreational | 352 | 4.1% | 4.30 |
| Wide Feet Users | 278 | 3.2% | 4.24 |
| Flat Feet/Overpronation | 155 | 1.8% | 4.11 |
| Healthcare Workers | 214 | 2.5% | 4.05 |
Serious runners and athletes make up 6.4% of reviews with a 4.47 average rating. Older adults (50+) are 1.7% with a 4.42 average. Wide feet users are 3.2% with 4.24 average, and flat feet/overpronation is 1.8% at 4.11, while healthcare professionals are 2.5% of the reviews with an average rating of 4.05.
Serious runners and athletes are the dominant demographic, consistently expressing high satisfaction with shoes that offer performance and comfort. These customers expect advanced technologies in their running shoes, such as superior cushioning, durability, and fit. However, the older adult and wide feet segments also represent key customer bases with specific needs, such as extra support and customized fit.
Two insights matter here. First, serious runners are satisfied overall, but they are also the segment most likely to penalize version regressions. Second, wide-feet and flat-feet signals align cleanly with the quick-win opportunities we discussed earlier. Toe box and arch support show up as repeatable, addressable needs.
Behavioral Patterns
| Behavior | Reviews | Avg Rating |
| Second pair buyers | 194 | 4.63 |
| Third pair buyers | 79 | 4.52 |
| Gift purchasers | 970 | 4.33 |
| Brief reviewers (<30 words) | 2,501 | 4.46 |
| 6+ month users | 892 | 3.87 |
| Detailed reviewers (75+ words) | 1,542 | 3.55 |
Behavioral signals are strong predictors of satisfaction. Second pair buyers rate 4.63, and third pair buyers rate 4.52, showing loyalty is meaningful when experience stays consistent. These customers are more likely to recommend the product to others, as they are generally satisfied with their purchases, and brand loyalty is high.
In contrast, gift buyers, who represent a significant portion of the market, tend to leave ratings of 4.33. These buyers are generally less concerned with performance and more interested in aesthetic appeal and value.
Long-term users, especially those who have used a brand for multiple years, tend to show a higher dissatisfaction rate if the product does not meet expectations. Brands that fail to maintain consistency over time risk alienating these loyal customers.
What Review Length Reveals About Satisfaction
The length of a review can be a key indicator of customer satisfaction. Longer reviews, often exceeding 75 words, tend to indicate negative sentiment, with these reviews averaging a 3.55 rating.
Conversely, shorter reviews, which are typically positive or neutral, show an average rating of 4.46. This suggests that dissatisfied customers are more likely to elaborate on their experiences, while satisfied customers tend to leave concise, positive feedback.
This matters for VoC operations because it suggests that long reviews can be treated as a prioritization filter. They are more likely to contain actionable defect narratives and version comparisons. That becomes especially important for brands dealing with regression concerns or high-frequency issues like toe box and lacing.
READ MORE | Decoding Reviews and Customer Behavior: How Positive Feedback Drives High-Intent Purchases
Retailer Channel Analysis: Where Ratings Rise or Fall
Channel performance plays a crucial role in customer satisfaction. Many brands see discrepancies between their DTC (Direct-to-Consumer) ratings and those on third-party retail sites. This section explores how these channels influence customer feedback and satisfaction levels.
Channel Leaderboard (Brand DTC vs Third-Party)
| Retailer | Reviews | Avg Rating | Channel Type |
| Scheels.com | 76 | 4.79 | Sporting Goods |
| asics.com | 1,453 | 4.64 | Brand DTC |
| brooksrunning.com.au | 175 | 4.63 | Brand DTC |
| DSW.com | 112 | 4.56 | Footwear Retail |
| roadrunnersports.com | 171 | 4.44 | Specialty Running |
| dickssportinggoods.com | 395 | 4.38 | Sporting Goods |
| brooksrunning.com | 341 | 4.28 | Brand DTC |
| newbalance.com | 812 | 3.84 | Brand DTC |
| hoka.com | 2,704 | 3.80 | Brand DTC |
| REI | 184 | 3.67 | Outdoor Retail |
| Kohls.com | 59 | 3.36 | Department Store |
Channel differences are not subtle here. Third-party retailers show higher satisfaction at the top: Scheels.com 4.79, DSW.com 4.56, Road Runner Sports 4.44, Dick’s 4.38.
Brand DTC sites vary but generally trend lower: asics.com 4.64, brooksrunning.com.au 4.63, brooksrunning.com 4.28, newbalance.com 3.84, hoka.com 3.80.
The Hoka and New Balance DTC scores stand out because they align with the broader brand-level satisfaction story. They are materially lower than the best third-party experiences. Meanwhile, ASICS holds strong even on DTC, suggesting its satisfaction is not dependent on retailer experience or return policy framing.
What Lower DTC Ratings May Indicate
The observation fits a common VoC pattern: DTC reviews include more loyal users and repeat buyers, and those customers are more likely to compare versions and notice regressions.
Lower ratings on DTC channels may indicate that loyal customers have higher expectations and are more likely to voice dissatisfaction when the product doesn’t meet those expectations.
This suggests that brands selling directly to consumers need to ensure their customer service and return policies are impeccable to manage customer frustrations effectively.
There is also a purchase psychology effect. On DTC, the product is judged more directly as the brand’s “promise”. On retail sites, the product experience can be buffered by shipping speed, retailer service, and return policies.
READ MORE | Role of Customer Feedback in Supply Chain: Why It Matters More Than Ever
Loyalty & Churn Analysis: Who’s Staying, Who’s Switching, and Why
Loyalty and churn signals are critical for understanding a brand’s long-term sustainability. In this section, we explore the loyalty broken signals that highlight products at risk of losing customers and the brand promoters who are driving growth.
Net Promoter Proxy
| Segment | Reviews | Avg Rating | Signal |
| Strong Promoters (‘highly recommend’) | 403 | 4.69 | Advocacy |
| Detractors (‘do not recommend’) | 99 | 2.82 | Churn risk |
NPS proxy segments reviews into promoters and detractors. Strong promoters (“highly recommend”) are 403 reviews with a 4.69 average rating. Detractors (“do not recommend”) are 99 reviews with a 2.82 average rating.
This gap is useful because it separates “generally satisfied” from “active advocacy.” Many products can maintain a 4.1 to 4.2 average without creating promoters. Promoters usually require a combination of comfort delivery, fit certainty, and low long-term regret. That is exactly where ASICS and Brooks stand out in the earlier tables.
Top Recommended Products
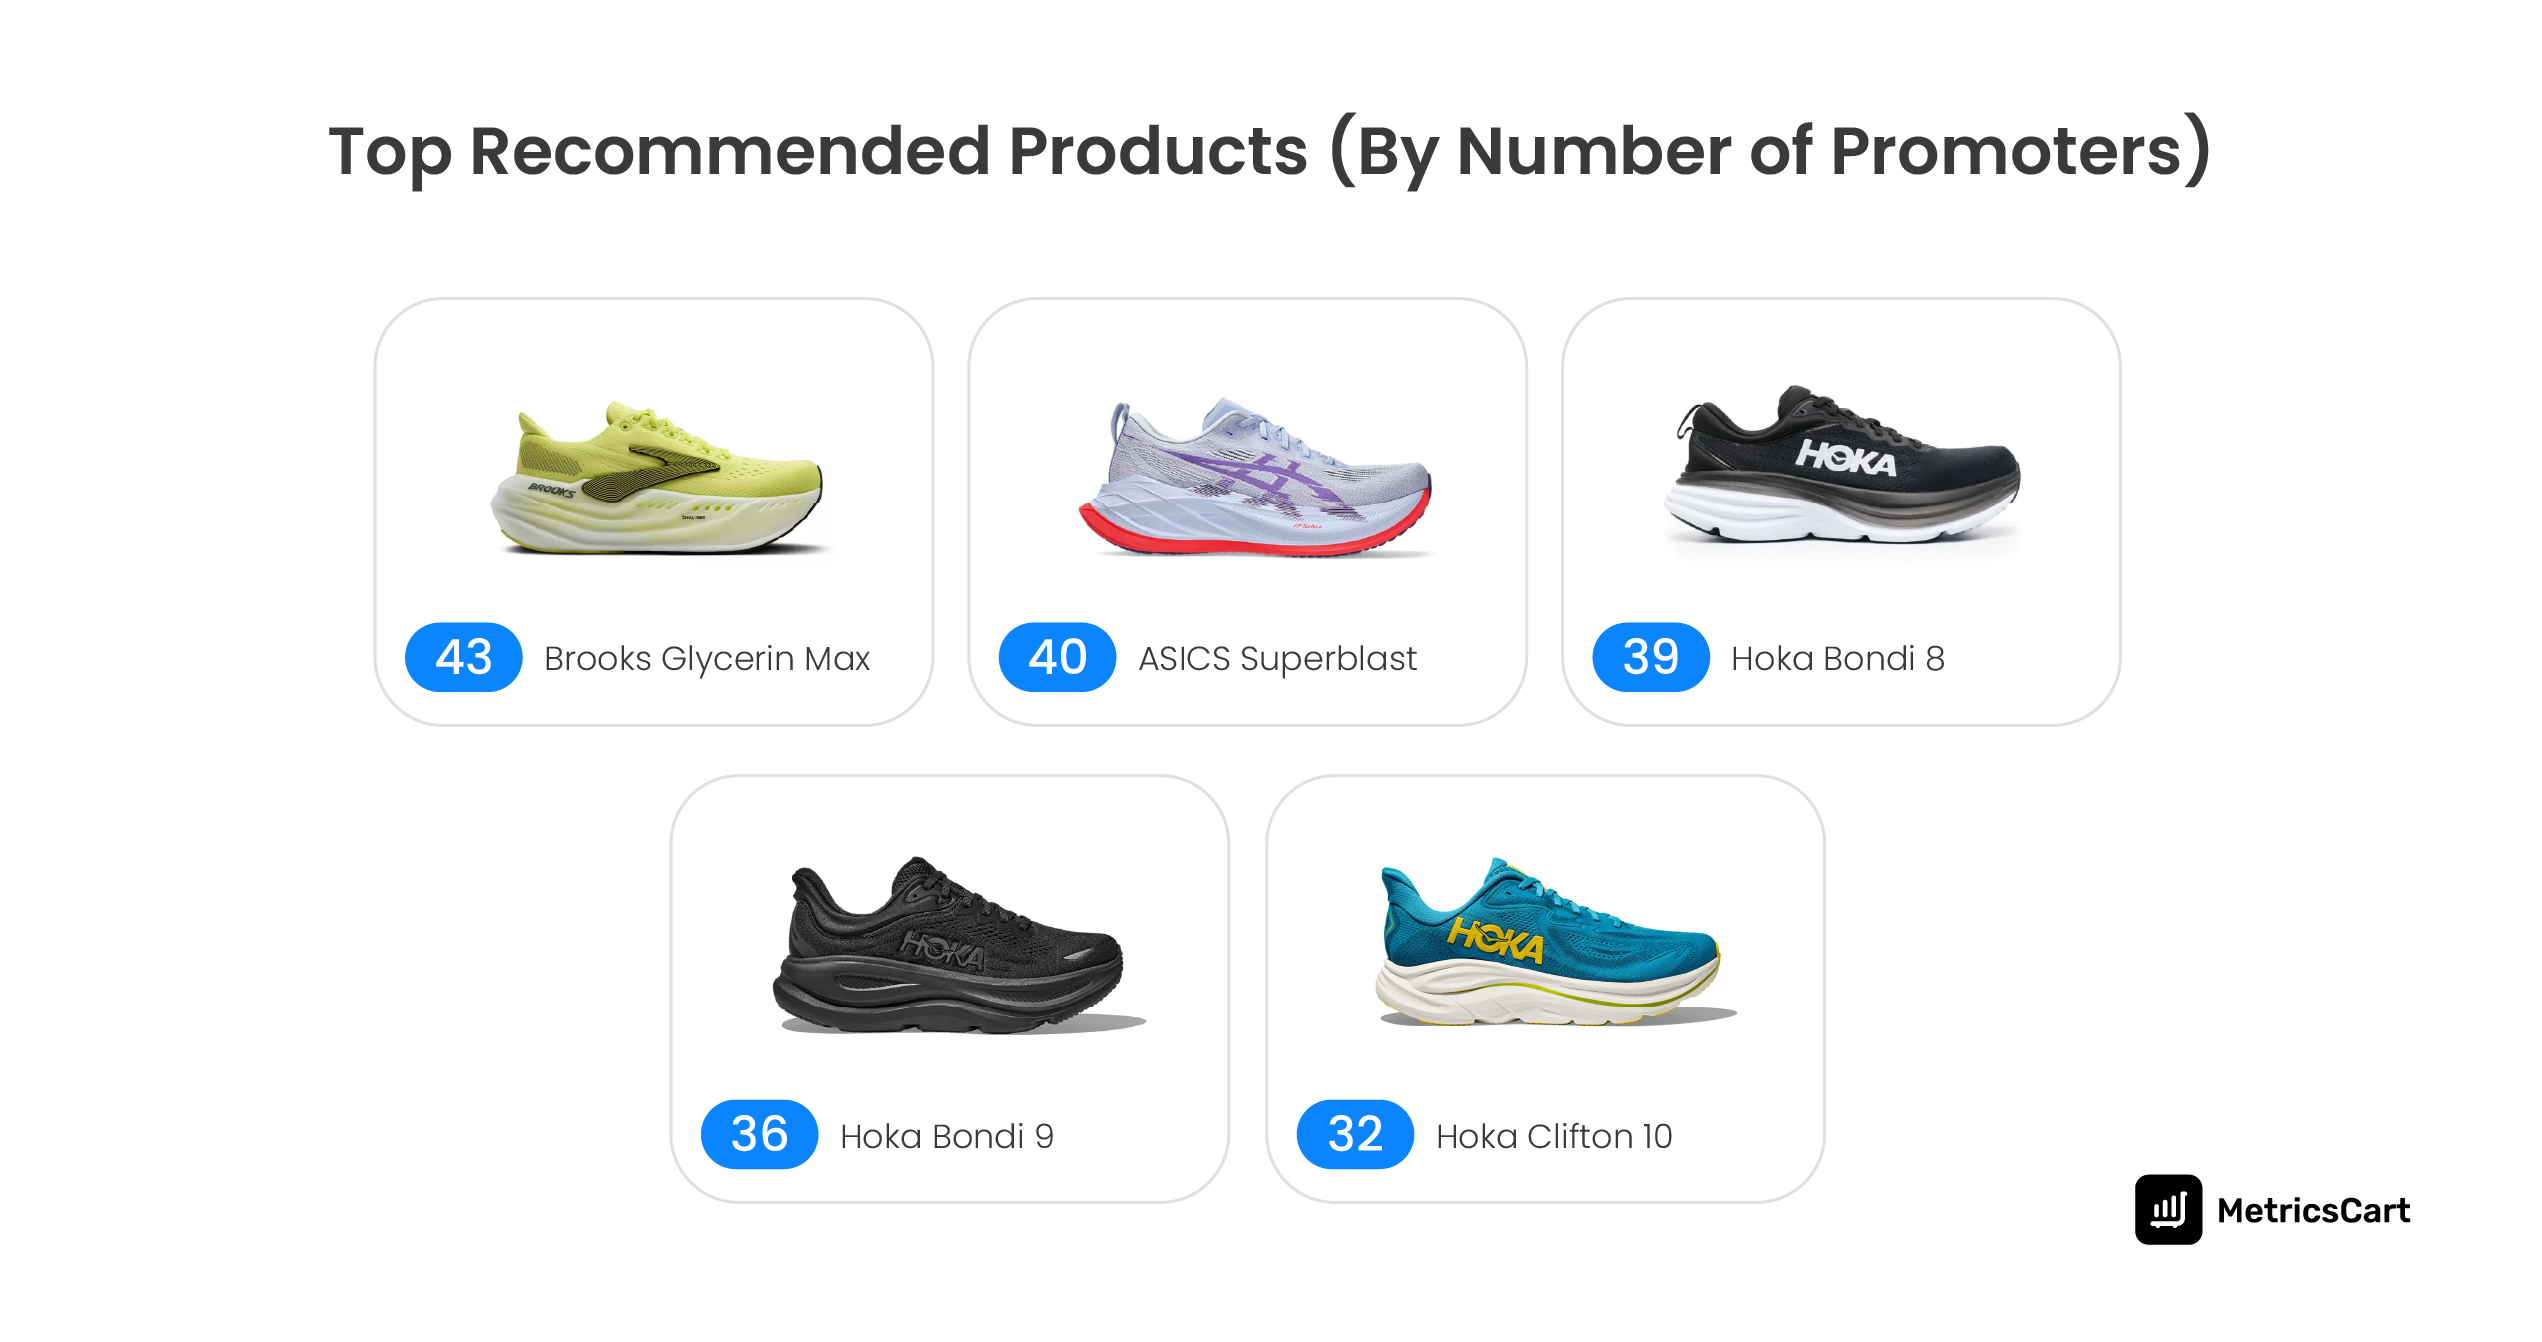
ASICS Superblast and Brooks Glycerin Max lead this cohort, each accumulating more than 40 explicit advocacy signals. These products consistently score above 4.6 and show strong alignment across the core drivers of satisfaction: comfort, cushioning, and durability.
What is notable is not just their high ratings, but the consistency of positive feedback across time and use cases. These products are not driven by novelty spikes. Instead, they benefit from repeat validation across running, gym training, and long-term usage scenarios.
In VoC terms, these are low-volatility products that convert satisfaction into advocacy, which is critical for organic growth in competitive categories like top running shoes in 2026.
In contrast, products with weaker advocacy signals often show fragmented sentiment. They may score well on one attribute, such as lightweight feel, but fail on durability or fit. This imbalance limits their ability to generate recommendations, even if average ratings appear acceptable on the surface.
Loyalty Broken Signals (Product-Level Churn Risk)
| Product | Signals | Risk Level |
| Altra Torin 7 | 48 | CRITICAL |
| Hoka Arahi 7 | 47 | CRITICAL |
| Hoka Clifton 10 | 41 | HIGH |
| New Balance 1080 v14 | 34 | HIGH |
| Hoka Mach X 2 | 31 | HIGH |
The churn signal is explicit. 394 reviews contain “loyalty broken” language such as “used to love,” “won’t buy again,” “switching,” and the average rating for these reviews is 2.57.
Altra Torin 7 leads this list with 48 loyalty broken signals, followed closely by Hoka Arahi 7, Hoka Clifton 10, and New Balance 1080 v14. What connects these products is not a single defect, but perceived regression. Customers frequently reference prior versions and express disappointment that updates removed features they valued, such as flexibility, fit consistency, or cushioning balance.
Broken loyalty reviews often come from repeat buyers who historically had positive sentiment. Losing this cohort has a disproportionate impact on long-term revenue and brand credibility, especially in a category where trust and habit play a major role in purchase decisions for choosing among the best running shoes in 2026.
Emotional Language Analysis: How Customers Feel When Products Succeed or Fail
Beyond ratings and structured feedback, emotional language provides critical context into how customers experience running shoes.
Words That Dominate 5-Star Reviews (What Delight Looks Like)
According to MetricsCart VoC data, in 5-star reviews, the most common emotional terms are “Love” (23%), “Perfect” (10.7%), “Best” (9.9%), and “Amazing” (5.3%). These are not technical words. They are emotional shortcuts that typically appear when the experience is frictionless. The shoe fits, it feels right quickly, and it delivers on the buyer’s goal without demanding adjustment.
Notice how this connects back to the aspect table. Weight is the best driver. Comfort is a core value. When those show up strongly, you get “best” and “perfect” language. In a crowded market, this emotional language is what makes a product memorable in social proof.
Words That Dominate 1-2 Star Reviews (Frustration Cues)
In 1 to 2 star reviews, the dominant terms are “Disappointed” (12.8%), then “Worst” (3.1%), “Terrible” (2.8%), “Horrible” (2.5%).
This is the vocabulary of broken expectation, not just discomfort. It often appears when customers expect a safe purchase, especially after prior positive experiences with earlier versions.
This language aligns with the “loyalty broken” section. When someone moves from being a repeat buyer to a churn risk, the language usually shifts with stronger negative sentiment.
What the 2026 Running Shoes VoC Tells Us Moving Forward
The data behind the best running shoes 2026 makes one thing clear. Customer satisfaction in this category is not driven by novelty or volume. It is driven by consistency. Brands that repeatedly deliver comfort, reliable fit, and durability over time earn trust and advocacy. Brands that miss on these fundamentals see dissatisfaction surface quickly and often publicly.
Across the top running shoes 2026, ASICS and Brooks stand out not because they dominate every innovation cycle, but because they minimize regret. Their highest-ranked models show strong sentiment balance, fewer recurring issues, and stable performance across use cases.
This is why they are more likely to appear in conversations around the best running shoes for runners, as well as gender-led searches like best running shoes for men in 2026 and best running shoes for women in 2026.
Version regressions, unresolved fit issues, and durability concerns are no longer isolated problems. They show up at scale in review data and translate directly into churn signals and “loyalty broken” language. In a category where many buyers return to brands they trust, losing repeat customers has long-term consequences that go beyond a single product cycle.
What this MetricsCart running shoes report ultimately highlights is the value of listening early and often. Reviews do not just explain what happened after launch. They show where products are drifting away from expectations and where small design or execution changes could materially improve satisfaction.
Start Listening Early with MetricsCart
Brands that treat VoC as a continuous signal, rather than a retrospective metric, are better positioned to compete as the market for running shoes becomes more crowded and more transparent.
Beyond marketplace reviews, social listening and sentiment analysis add another layer of clarity. Conversations on forums, social platforms, and community discussions often surface dissatisfaction earlier than ratings alone. Sentiment trends, emotional language, and sudden shifts in tone frequently signal emerging problems before they escalate into rating declines or churn.
MetricsCart brings these signals together in one view. By combining ratings and review analysis, theme and sub-theme classification, sentiment tracking, and social listening, MetricsCart helps brands understand not just what customers are saying, but why they are saying it and how those opinions are changing.
For brands navigating the 2026 running shoes market, MetricsCart turns scattered customer conversations into structured insight for smarter, faster decisions.
Disclaimer: MetricsCart is the exclusive owner of data used in the Consumer POV reports. Any kind of third-party usage entails due credit to the source material.
Maximize Your Brand’s Visibility in 2026!