In modern enterprise CPG organizations, the failure of consumer research rarely stems from bad data, poor sample sizes, or flawed statistical methodology.
It fails at translation.
Insights leaders routinely present 80-slide decks densely packed with regression models, conjoint utility curves, MaxDiff preference matrices, and verbatim quote collages. To a CEO or CFO, these artifacts represent operational details rather than strategic clarity.
Executives do not operate in methodology; they operate in capital allocation, portfolio risk, enterprise growth, and market defense.
To earn a permanent seat at the decision table, insights leaders must master the art of narrative synthesis: converting disparate quantitative metrics, primary qualitative research, and real-time digital shelf intelligence into decisive, risk-weighted business narratives.
How the C-Suite Listens
Before structuring an insight presentation, researchers must understand each executive’s cognitive lens in the room. Every C-suite member filters information through a distinct operational mandate:
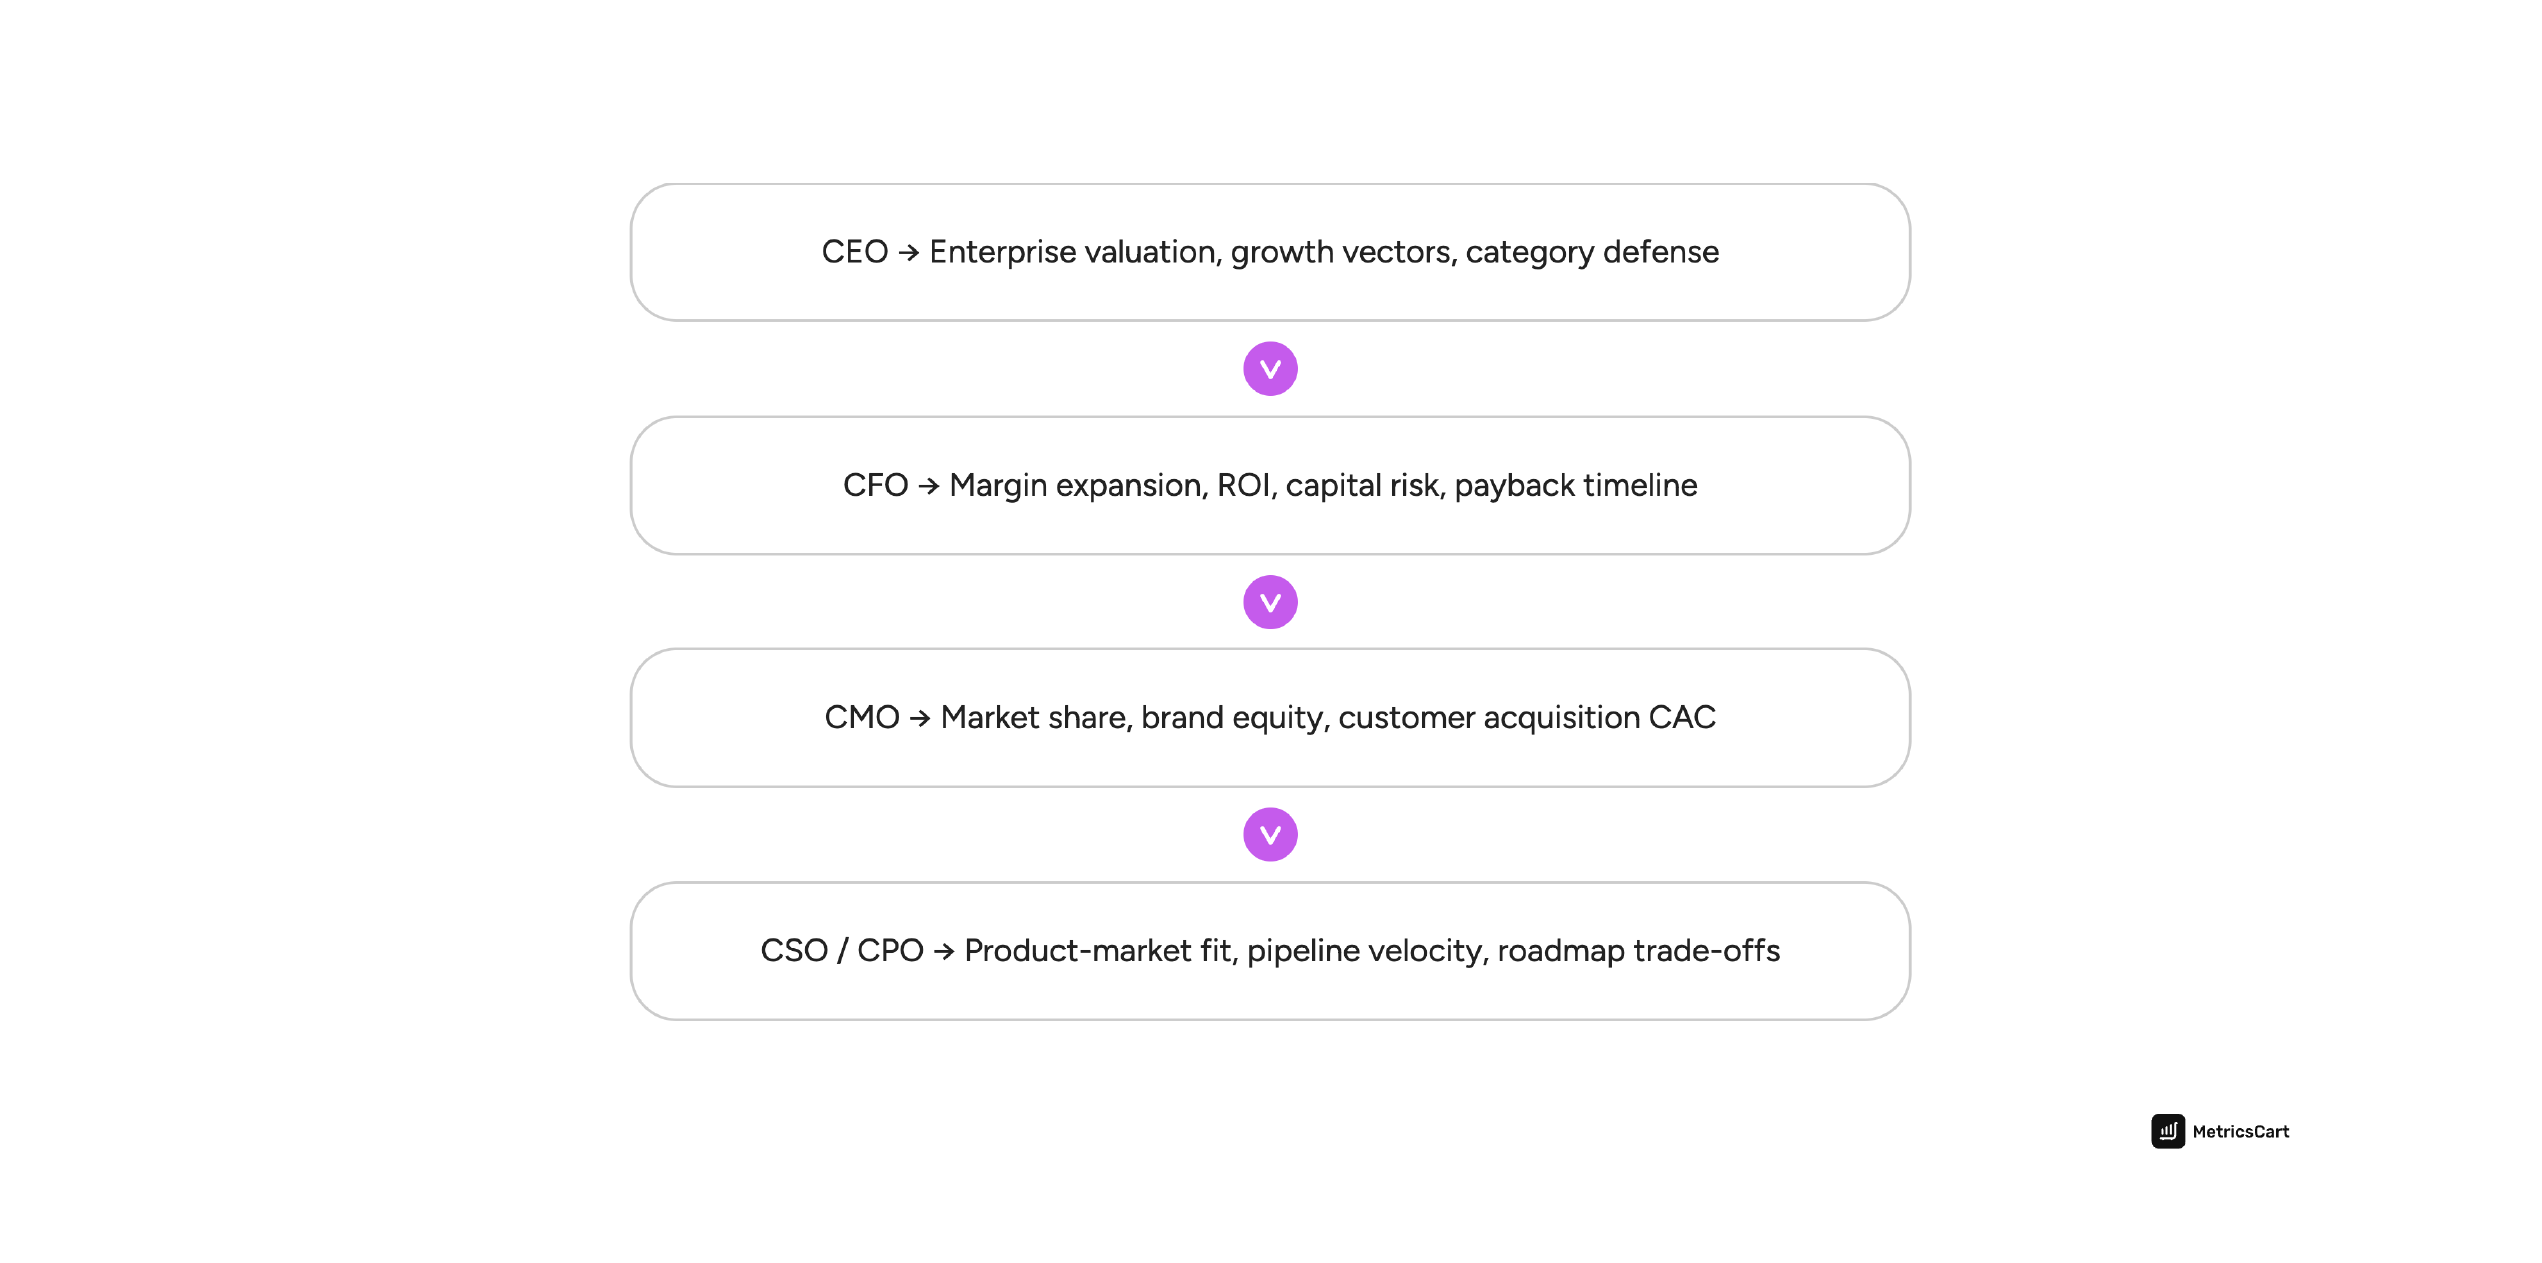
A common pitfall is treating all executive stakeholders as a homogenous “senior audience.” If a presentation emphasizes high consumer sentiment without modeling margin risk, the CFO disengages. If it outlines operational distribution hurdles without framing the strategic brand moat, the CEO loses interest.
Unifying Scale, Context, and Live Shelf Reality
Strategic narrative synthesis requires structuring quantitative data, qualitative context, and real-world market signals into a cohesive hierarchy:
Layer 1: The Quantitative “What” (The Foundation)
- Sizing the opportunity, proving statistically significant demand, and establishing risk boundaries.
- Key Inputs: Total Addressable Market (TAM) models, price elasticity bounds, category switching matrices, top-box purchase intent, and cross-retailer POS velocity.
Quant proves that an issue is large enough to warrant executive time and capital investment.
Layer 2: The Qualitative “Why” & Scaled Sentiment (The Human Reality)
- Providing the underlying psychological driver, emotional friction, or unarticulated consumer need behind the numbers.
- Key Inputs: In-depth interviews, Jobs-to-be-Done (JTBD) friction points, and AI-driven thematic review intelligence via MetricsCart.
Traditional qualitative research (e.g., 20 focus group participants) is often dismissed by CFOs as “anecdotal.” Platforms like MetricsCart bridge this gap by clustering tens of thousands of verified customer reviews across multi-retailer digital shelves (Amazon, Walmart, Target). This equips insights teams to deliver rich qualitative depth backed by large-scale, statistically robust post-purchase volume.
Layer 3: The Strategic Narrative (The Commercial Imperative)
- Fusing Layers 1 and 2 into a binary or high-conviction strategic recommendation.
- Key Inputs: Commercial risk trade-offs, required capital allocation, timing sensitivity, and competitive window-of-opportunity.
3-Step Translation Protocol
Moving from raw research findings to boardroom-ready assets requires a disciplined reframing process.
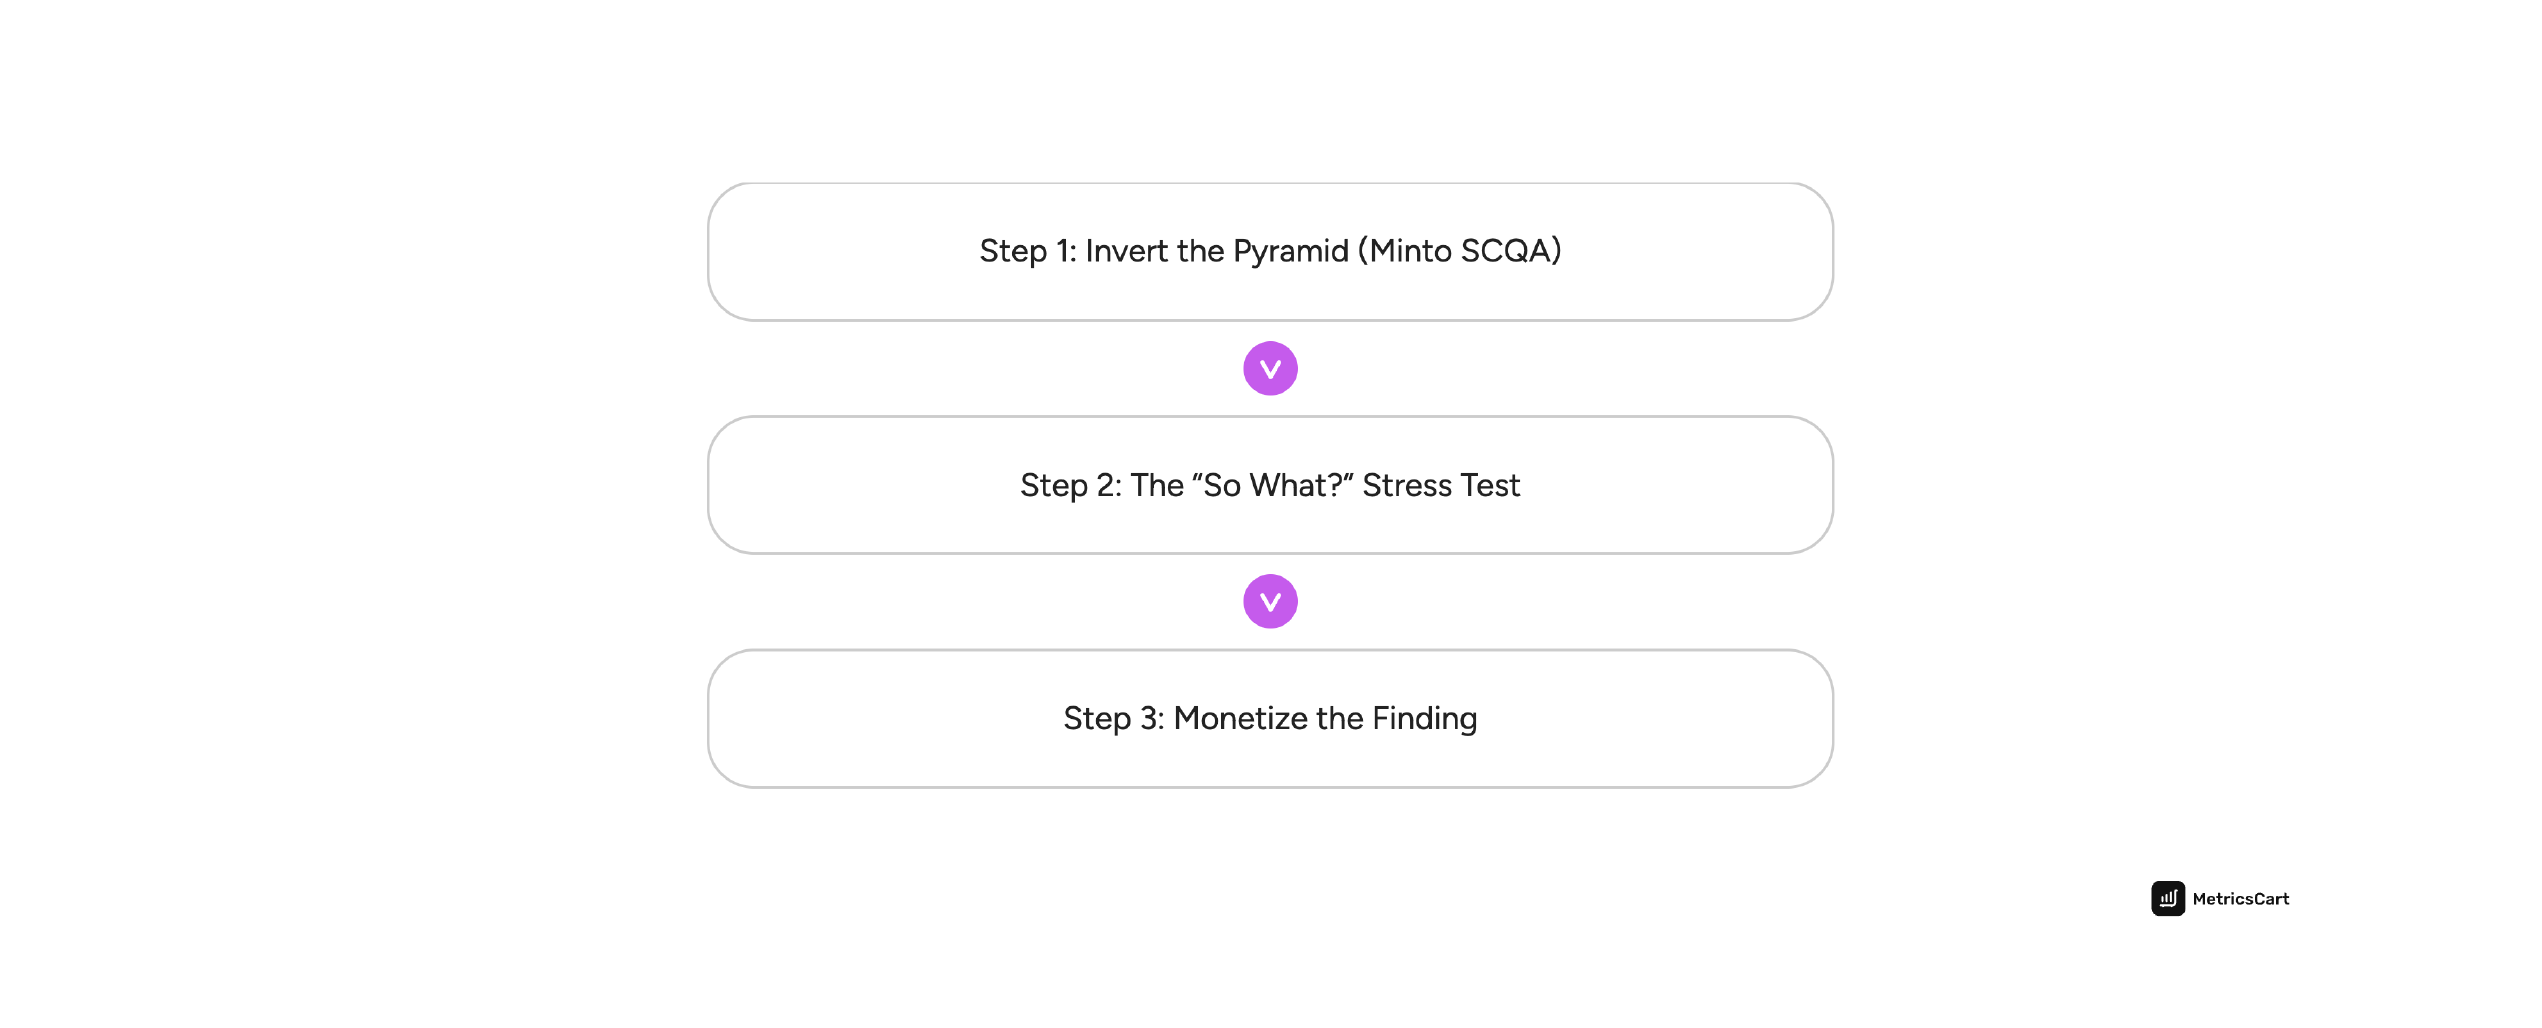
Step 1: Invert the Presentation Pyramid (Minto SCQA)
Traditional research decks build chronologically:
- Methodology
- Sample Demographics
- Quantitative Charts
- Verbatim Quotes
- Recommendations.
Boardrooms require the exact reverse.
Utilize the SCQA Framework (Situation, Complication, Question, Answer):
- Situation (Context): A stable truth about the current business state. (“Our core ready-to-drink protein line generates $40M ARR at a 28% gross margin across major retail partners.”)
- Complication (The Market Shift): The friction or emerging risk revealed by your data. (“While syndicated scan data shows baseline velocity flattening, MetricsCart review analysis reveals a 34% surge in negative packaging sentiment on Amazon and Target due to a brittle cap design.”)
- Question (The Core Decision): The explicit strategic choice facing the business. (“Do we retool the cap mold across the supply chain now, or risk losing organic search rank and Buy Box velocity into Q3?”)
- Answer (The Recommendation): Your data-backed strategy, complete with capital expenditure requirements, upside projections, and downside risk models.
Step 2: Apply the “So What? Now What?” Stress Test
Before any consumer chart, survey finding, or digital shelf metric enters an executive document, run it through the dual-filter test:
| Raw Research & Digital Shelf Finding | The “So What?” (Strategic Interpretation) | The “Now What?” (Boardroom Mandate) |
| Primary Testing: MaxDiff analysis shows ‘Clean Energy’ outperforms ‘Zero Sugar’ by 2.2x in consumer preference share. | Positioning on dietary restriction limits audience expansion; positioning on functional energy broadens consumption occasions across afternoon dayparts. | Shift primary front-of-pack claims and reallocate 30% of paid retail media search spend from diet keywords to sustained energy search terms. |
| MetricsCart Review Intelligence: AI clustering of 4,500+ multi-retailer reviews reveals an emerging 1-star trend regarding leaking seals during shipping. | Packaging fragility during direct-to-consumer and retail fulfillment is dragging product ratings down from 4.6 to 3.8 stars, threatening visibility in retail algorithms and repeat purchase rates. | Allocate $180k in packaging re-tooling for the upcoming production run to protect an estimated $2.4M in marketplace baseline revenue. |
| Competitor Teardown: MetricsCart’s analysis of the category leader’s 1-star reviews shows that 42% of churned buyers report a chalky aftertaste. | The dominant market incumbent has a verified sensory vulnerability that consumers actively voice after purchase. | Position our upcoming product launch explicitly against texture and smoothness, framing our proprietary filtration process as the hero proof-point. |
Step 3: Monetize the Finding
Qualitative soundbites and p-values mean little until they are tied to enterprise unit economics:
- Frame consumer friction as a revenue leak: Instead of reporting “Consumers complain our packaging is fragile,” frame it as “Fulfillment damage identified in multi-retailer review streams is driving a 0.8-star rating drop, risking an estimated $1.4M in lost marketplace sales.”
- Frame unmet consumer needs as market-share capture: Instead of reporting “80% of target consumers prefer sustainability claims,” frame it as “Capturing the eco-conscious segment represents a $6M whitespace opportunity with a 15% pricing power premium.”
When Consumer Data Clashes with Executive Intuition
One of the greatest challenges for insights leaders is presenting findings that contradict an executive’s long-held hypothesis or a Founder’s product vision.
When delivering counter-narratives:
1. Acknowledge the Prior Logic First: Establish why the original assumption made sense in past market conditions before demonstrating how consumer behavior or channel dynamics have shifted.
2. Depersonalize the Friction with Unfiltered Shelf Reality: Surveys can occasionally be challenged for sample bias or leading questions. Grounding your case in live, multi-retailer review intelligence from MetricsCart provides impartial, post-purchase proof of consumer sentiment across thousands of real transactions—shifting the debate from personal opinion to market reality.
3. Present Decision Trees, Not Dogma: Instead of saying “The proposed packaging update failed,” present risk-weighted paths:
- Option A (Status Quo): Avoids upfront re-tooling costs, but risks a projected 22% dip in repeat purchase velocity based on digital shelf sentiment trends.
- Option B (Recommended Pivot): Requires a 4-week tooling delay and $180k capex, but protects baseline ratings and secures long-term retail search placement.
Summary
The true measure of a consumer insights team’s maturity is not the complexity of its analytical toolkit, but its ability to influence high-stakes executive decisions.
By grounding strategic narratives in quantitative scale, verifying consumer reality through scaled digital shelf intelligence, and speaking the boardroom language of capital allocation and risk management, insights teams evolve from back-office research functions into indispensable enterprise co-pilots.