Best Stanley products on Amazon in January 2026

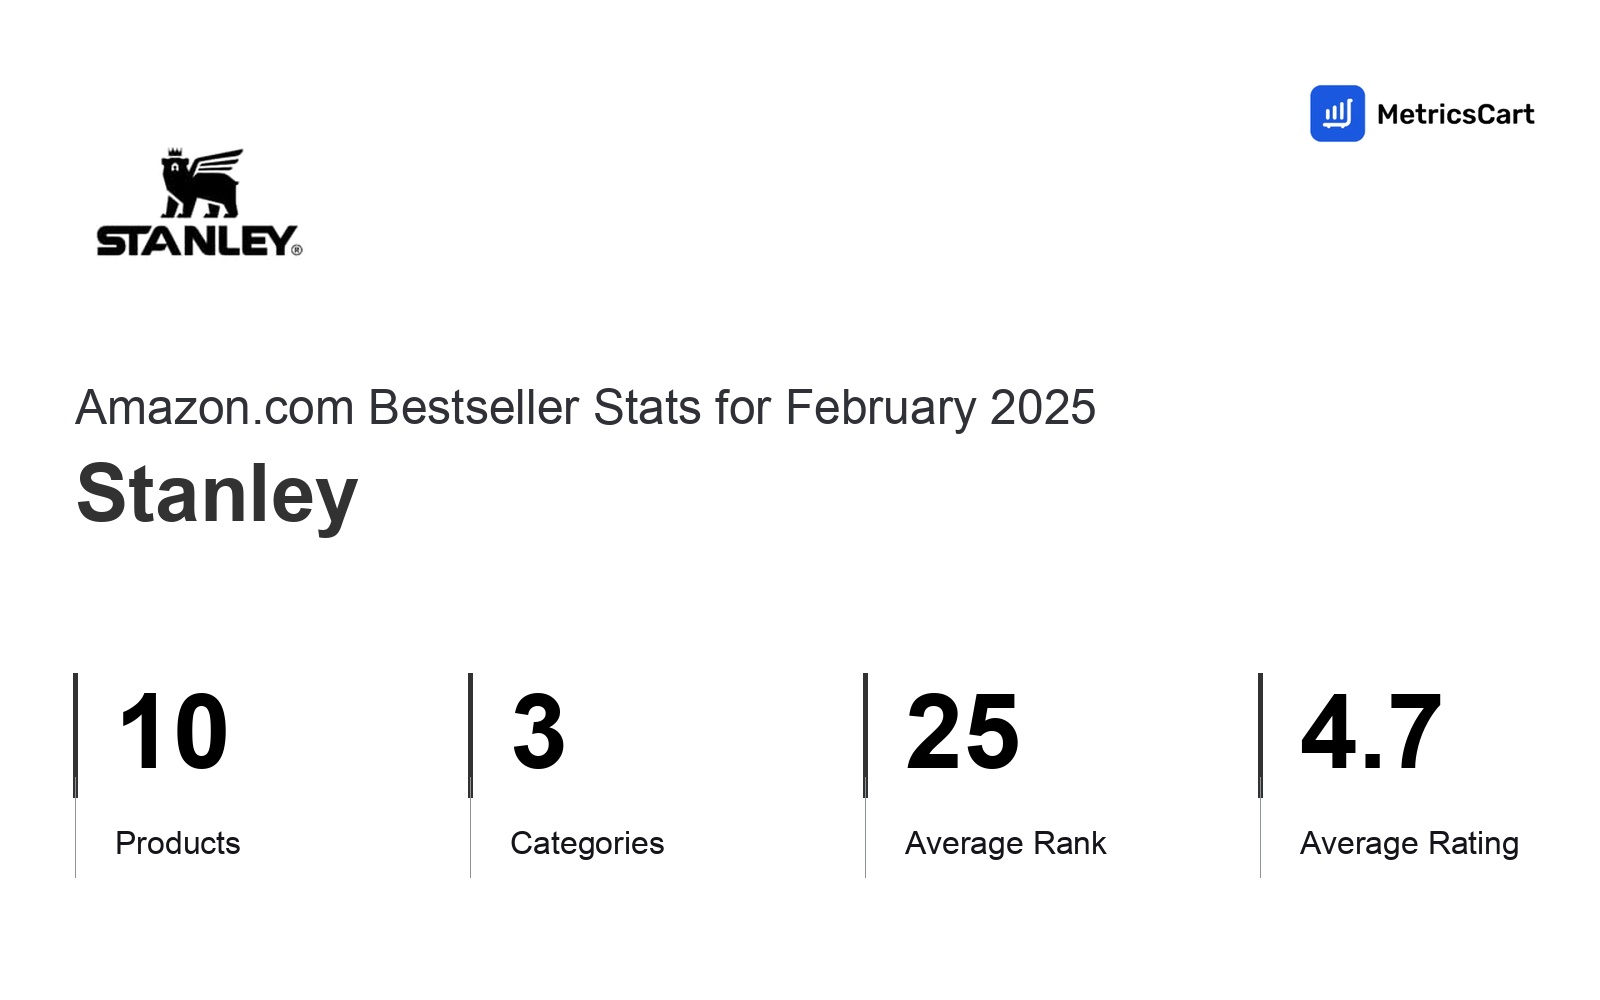
In January 2026, Stanley appeared on Amazon's bestseller lists with 23 unique products across 3 categories. These products appeared in categories including Kitchen & Dining, Home & Kitchen, and Sports & Outdoors. The brand's products on the bestseller lists were priced between $8.35 and $55.00, with an average price of $27.70. These bestselling products maintained an average rating of 4.7 based on 1.0M total ratings from customers who purchased products that appeared on the bestseller lists.
Products
Categories
Average Price
Average Rank
Category Performance
This section outlines product count, average rank, pricing, and customer ratings by category. A clear reference point for tracking brand visibility on the Amazon digital shelf.
Considering the data across product categories, the Kitchen & Dining category is a clear leader, exhibiting the highest product volume (16 listings), the highest average price ($28.29), and the strongest customer ratings (4.7 stars).
| Category | Products | Average Rank | Average Price | Rating |
|---|---|---|---|---|
16 | 11.6 2 — 98 | $28.29 $8.35 — $45 | 4.7 (808,343 ratings) | |
13 | 23.1 7 — 98 | $28.12 $18.85 — $45 | 4.7 (786,502 ratings) | |
7 | 49.3 9 — 100 | $25.65 $13.94 — $55 | 4.7 (220,461 ratings) |
Top Products
The highest-rated product has 4.8 stars, while the lowest has 4.6 stars. In terms of pricing, the most expensive product is $55.00, and the least expensive is $8.35.
Overall, the following are the highest-ranked products from this brand, measured by performance, pricing, and customer feedback. As top Amazon performers, they show what resonates with shoppers and help the brand spot what's working on the digital shelf. The highest average rank is 4.5, and the lowest is 39.6. The highest-rated product has 4.7 stars, while the lowest is 4.7 stars. In terms of pricing, the highest is $39.80, and the lowest is $22.50.
| Product | Average Rank | Average Price | Rating | |
|---|---|---|---|---|
23.4 6 — 55 | $24.32 $18.85 — $26 | 4.7 (12,716 ratings) | ||
6.2 2 — 11 | $32.6 $22.5 — $42.7 | 4.7 (89,752 ratings) | ||
8.1 3 — 16 | $35 | 4.7 (92,070 ratings) | ||
7.3 2 — 15 | $33.75 $29.25 — $45 | 4.7 (11,648 ratings) | ||
9.9 3 — 19 | $22.5 | 4.7 (92,170 ratings) | ||
8.4 3 — 15 | $29.25 | 4.7 (11,203 ratings) | ||
7.5 2 — 14 | $39.8 | 4.7 (91,861 ratings) | ||
4.5 2 — 7 | $30.68 $22.5 — $38.85 | 4.7 (101,134 ratings) | ||
39.6 9 — 76 | $29.52 $25.38 — $35 | 4.7 (68,678 ratings) | ||
22.8 8 — 38 | $34.89 $29.75 — $40 | 4.7 (12,298 ratings) |
Content Compliance
Focusing on text, video, and image content, as well as the overall content score, this analysis guides the brand in meeting Amazon's content benchmarks and improving product visibility.
The values shown are median figures. The average title length across this brand is 168 characters, and the description length is 437 characters. Additionally, the average count of images and videos in the Amazon bestseller product listings for this brand is 7 images and 5 videos.
Title
Title Length
Title Score
No Special Characters
Proper Capitalization
Product Identification
Character Count
Spelling & Grammar
Proper Numerals
Content
Total Score
Description Length
Bullet Points
Bullet Average Length
Has Enhanced Content
Images
Total Images
Graphics Images
Silo Images
Alternate Images
Lifestyle Images
Detail Images
Centered
No White Border
Not Enlarged
Valid Dimensions
Has 360° Images
Videos
Total Videos
Has Videos
About Amazon Best Seller Category Reports
Our Amazon Bestseller Brand Monthly Reports track key changes in product performance on the Amazon digital shelf, giving e-commerce teams a clear view of market shifts. Using our machine learning model, we analyze your brand's performance on the Amazon digital shelf, helping you stay ahead. Brands already relying on this information are better equipped to optimize their strategies and improve their competitive positioning.
Disclaimer: Data on this page is based on publicly available amazon.com information and compiled using proprietary analysis. All trademarks and brand names belong to their owners. This report is for informational purposes only and is not endorsed by Amazon or featured brands.
What If You're Missing Something That's Costing You Sales?
With MetricsCart, track and analyze:
- Price movements
- Keyword trends
- MAP violations
- Product listing content
- Customer sentiment
Access everything across Amazon, Walmart, and every other marketplace in one unified view.
See what's powering your category or slowing your brand down and where you're losing revenue.