The Amazon Seller Report of 2024 reveals some interesting facts:
- 35% of small to medium-sized Amazon sellers turn a profit in less than six months.
- Conversely, 77% of enterprise brands and retailers see a profit on Amazon in 3 months.
In order to achieve these profit margins and success on Amazon, businesses must continuously monitor their performance on the platform. Here are some key Amazon seller metrics every brand and third-party (3P) seller must monitor to improve sales and customer satisfaction.
Why is it Important to Monitor Amazon Seller Metrics?
Amazon metrics are a set of criteria and standards established by Amazon to analyze the performance of brands and third-party (3P) sellers. It enables brands to identify areas for improvement and make data-driven decisions to optimize their performance.
However, if a particular seller consistently fails to meet Amazon’s standards, the consequences can be severe. Amazon can adopt corrective actions like penalties, account suspension, or deactivation.
Thus, by regularly tracking the Amazon seller performance metrics, brands can:
- Analyze the overall sales and determine the highly profitable products
- Optimize the product listings and improve customer experience
- Understand inventory levels and ensure proper product stock to meet demands
- Ascertain customer satisfaction levels and maintain a positive brand image
Top Amazon Performance Metrics For Sellers
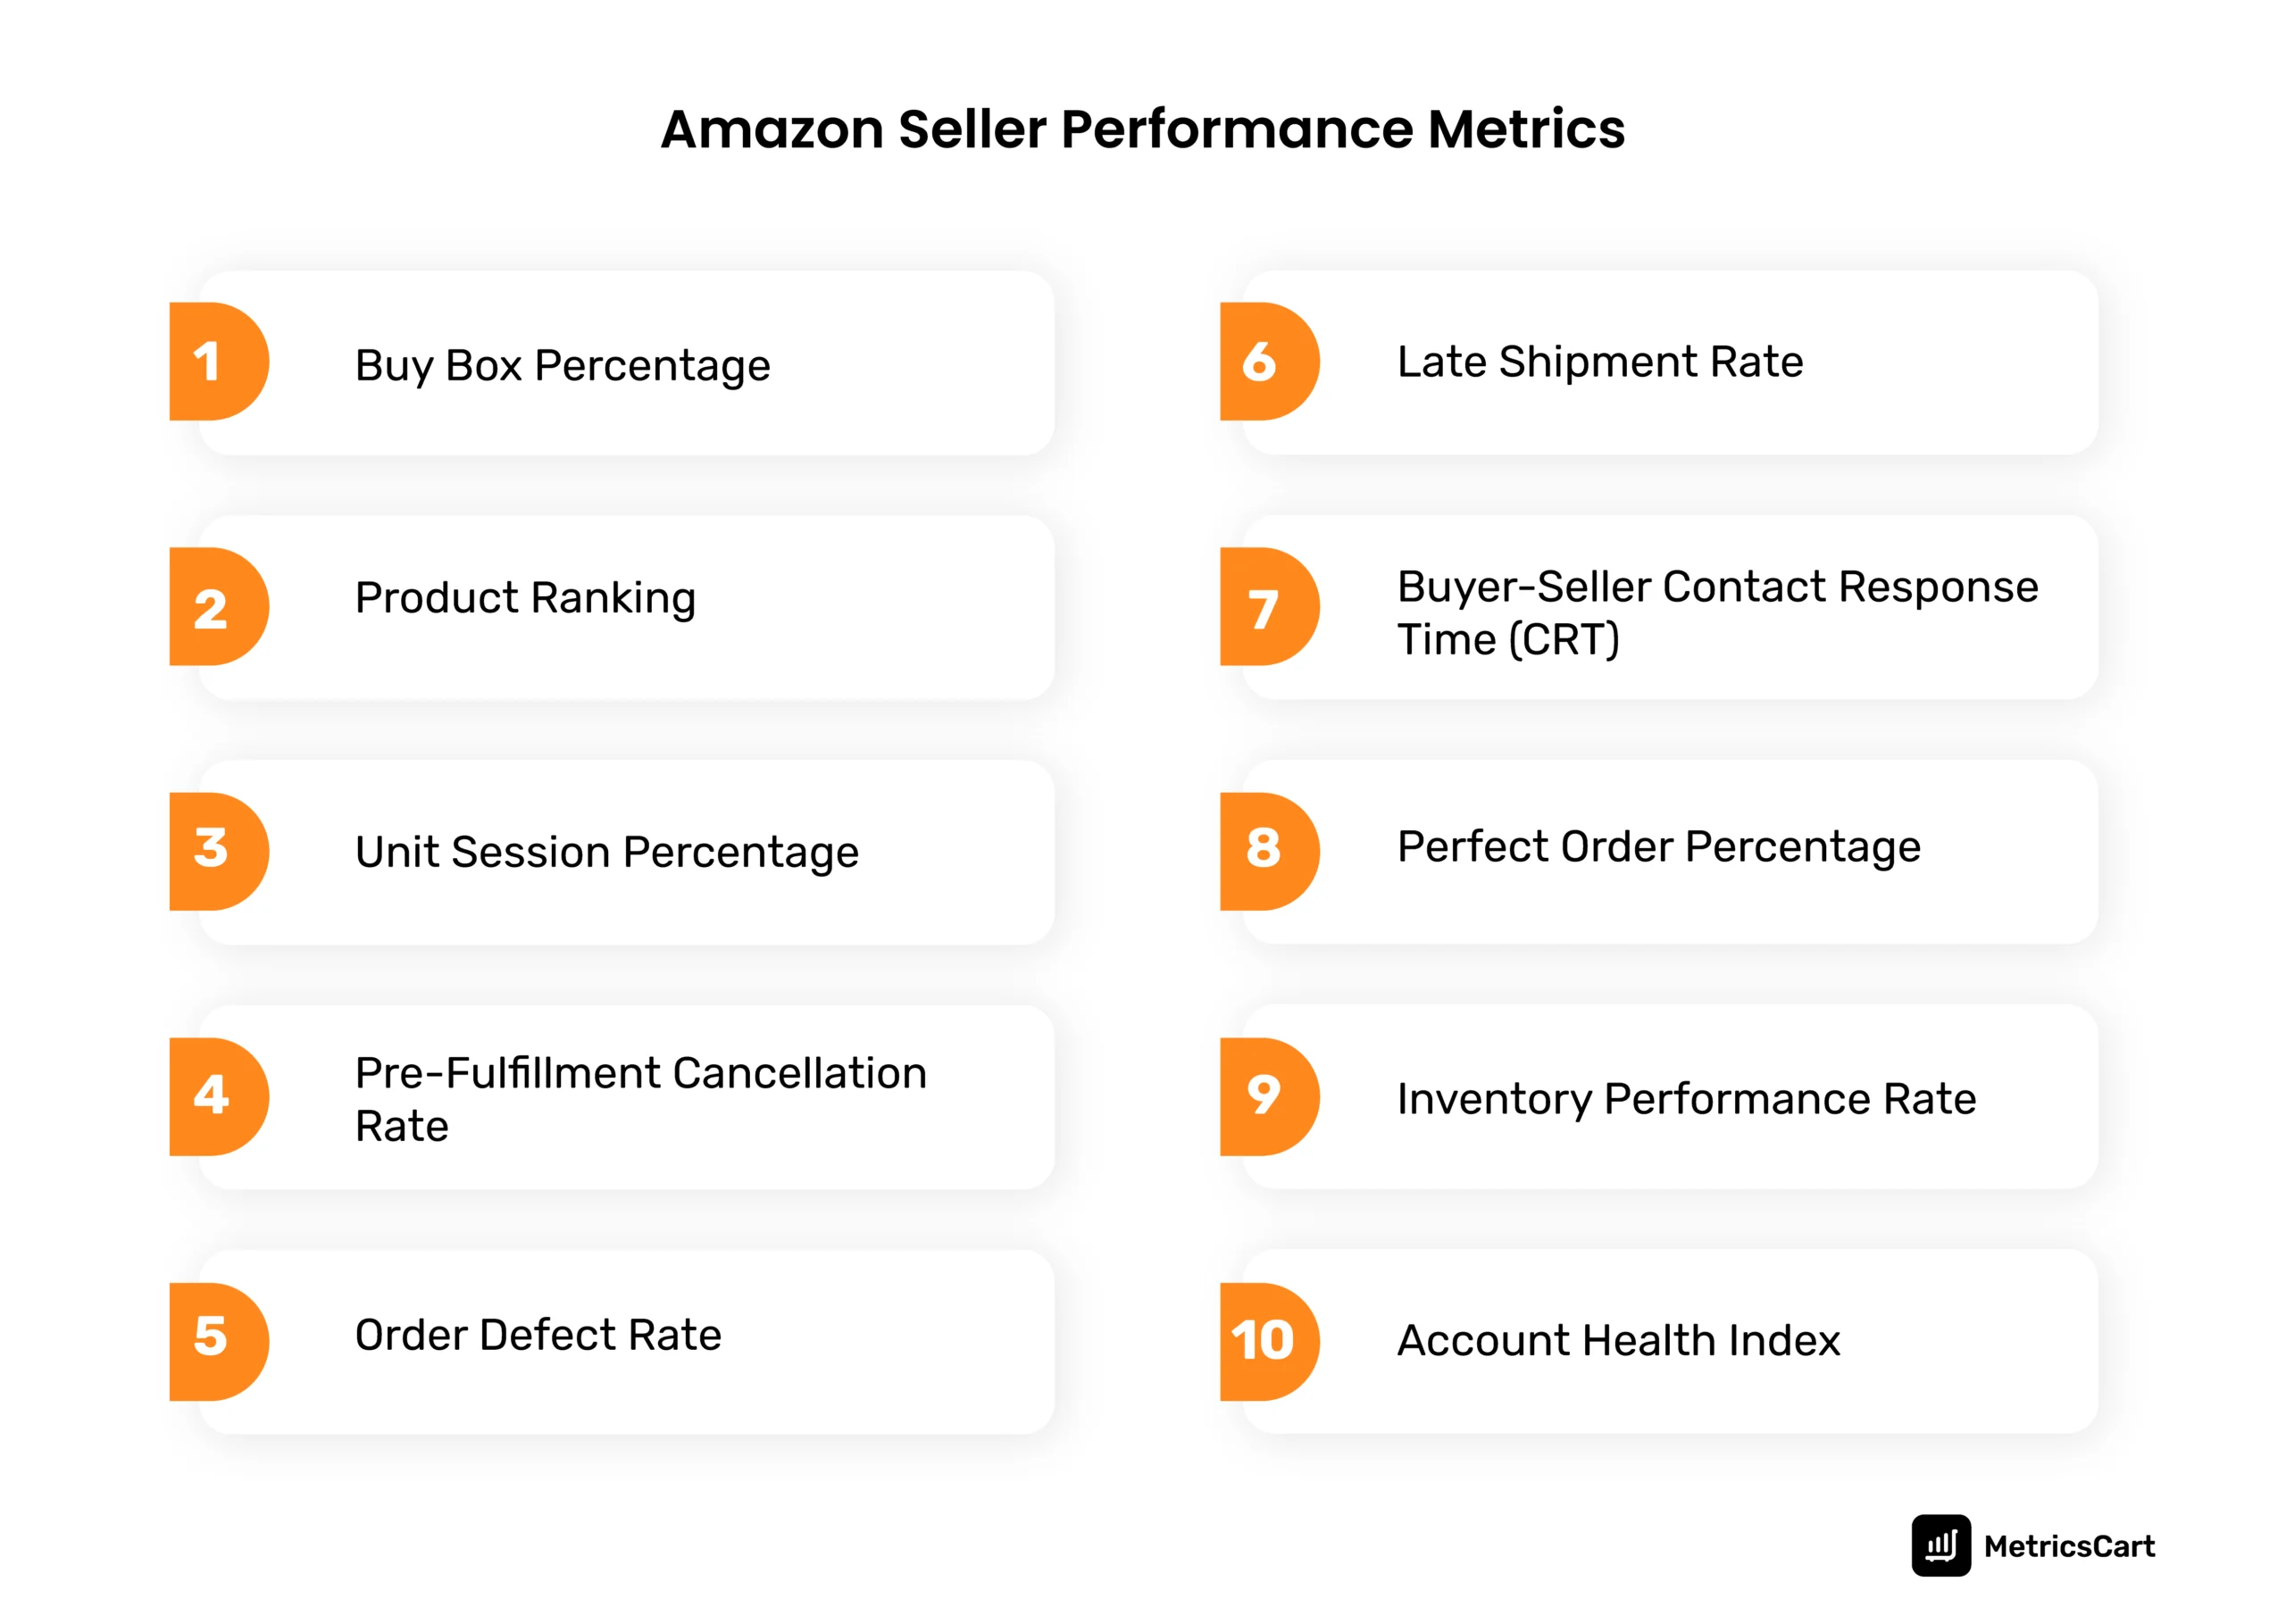
Enlisted below are the top Amazon seller performance metrics every brand must monitor.

Buy Box Percentage
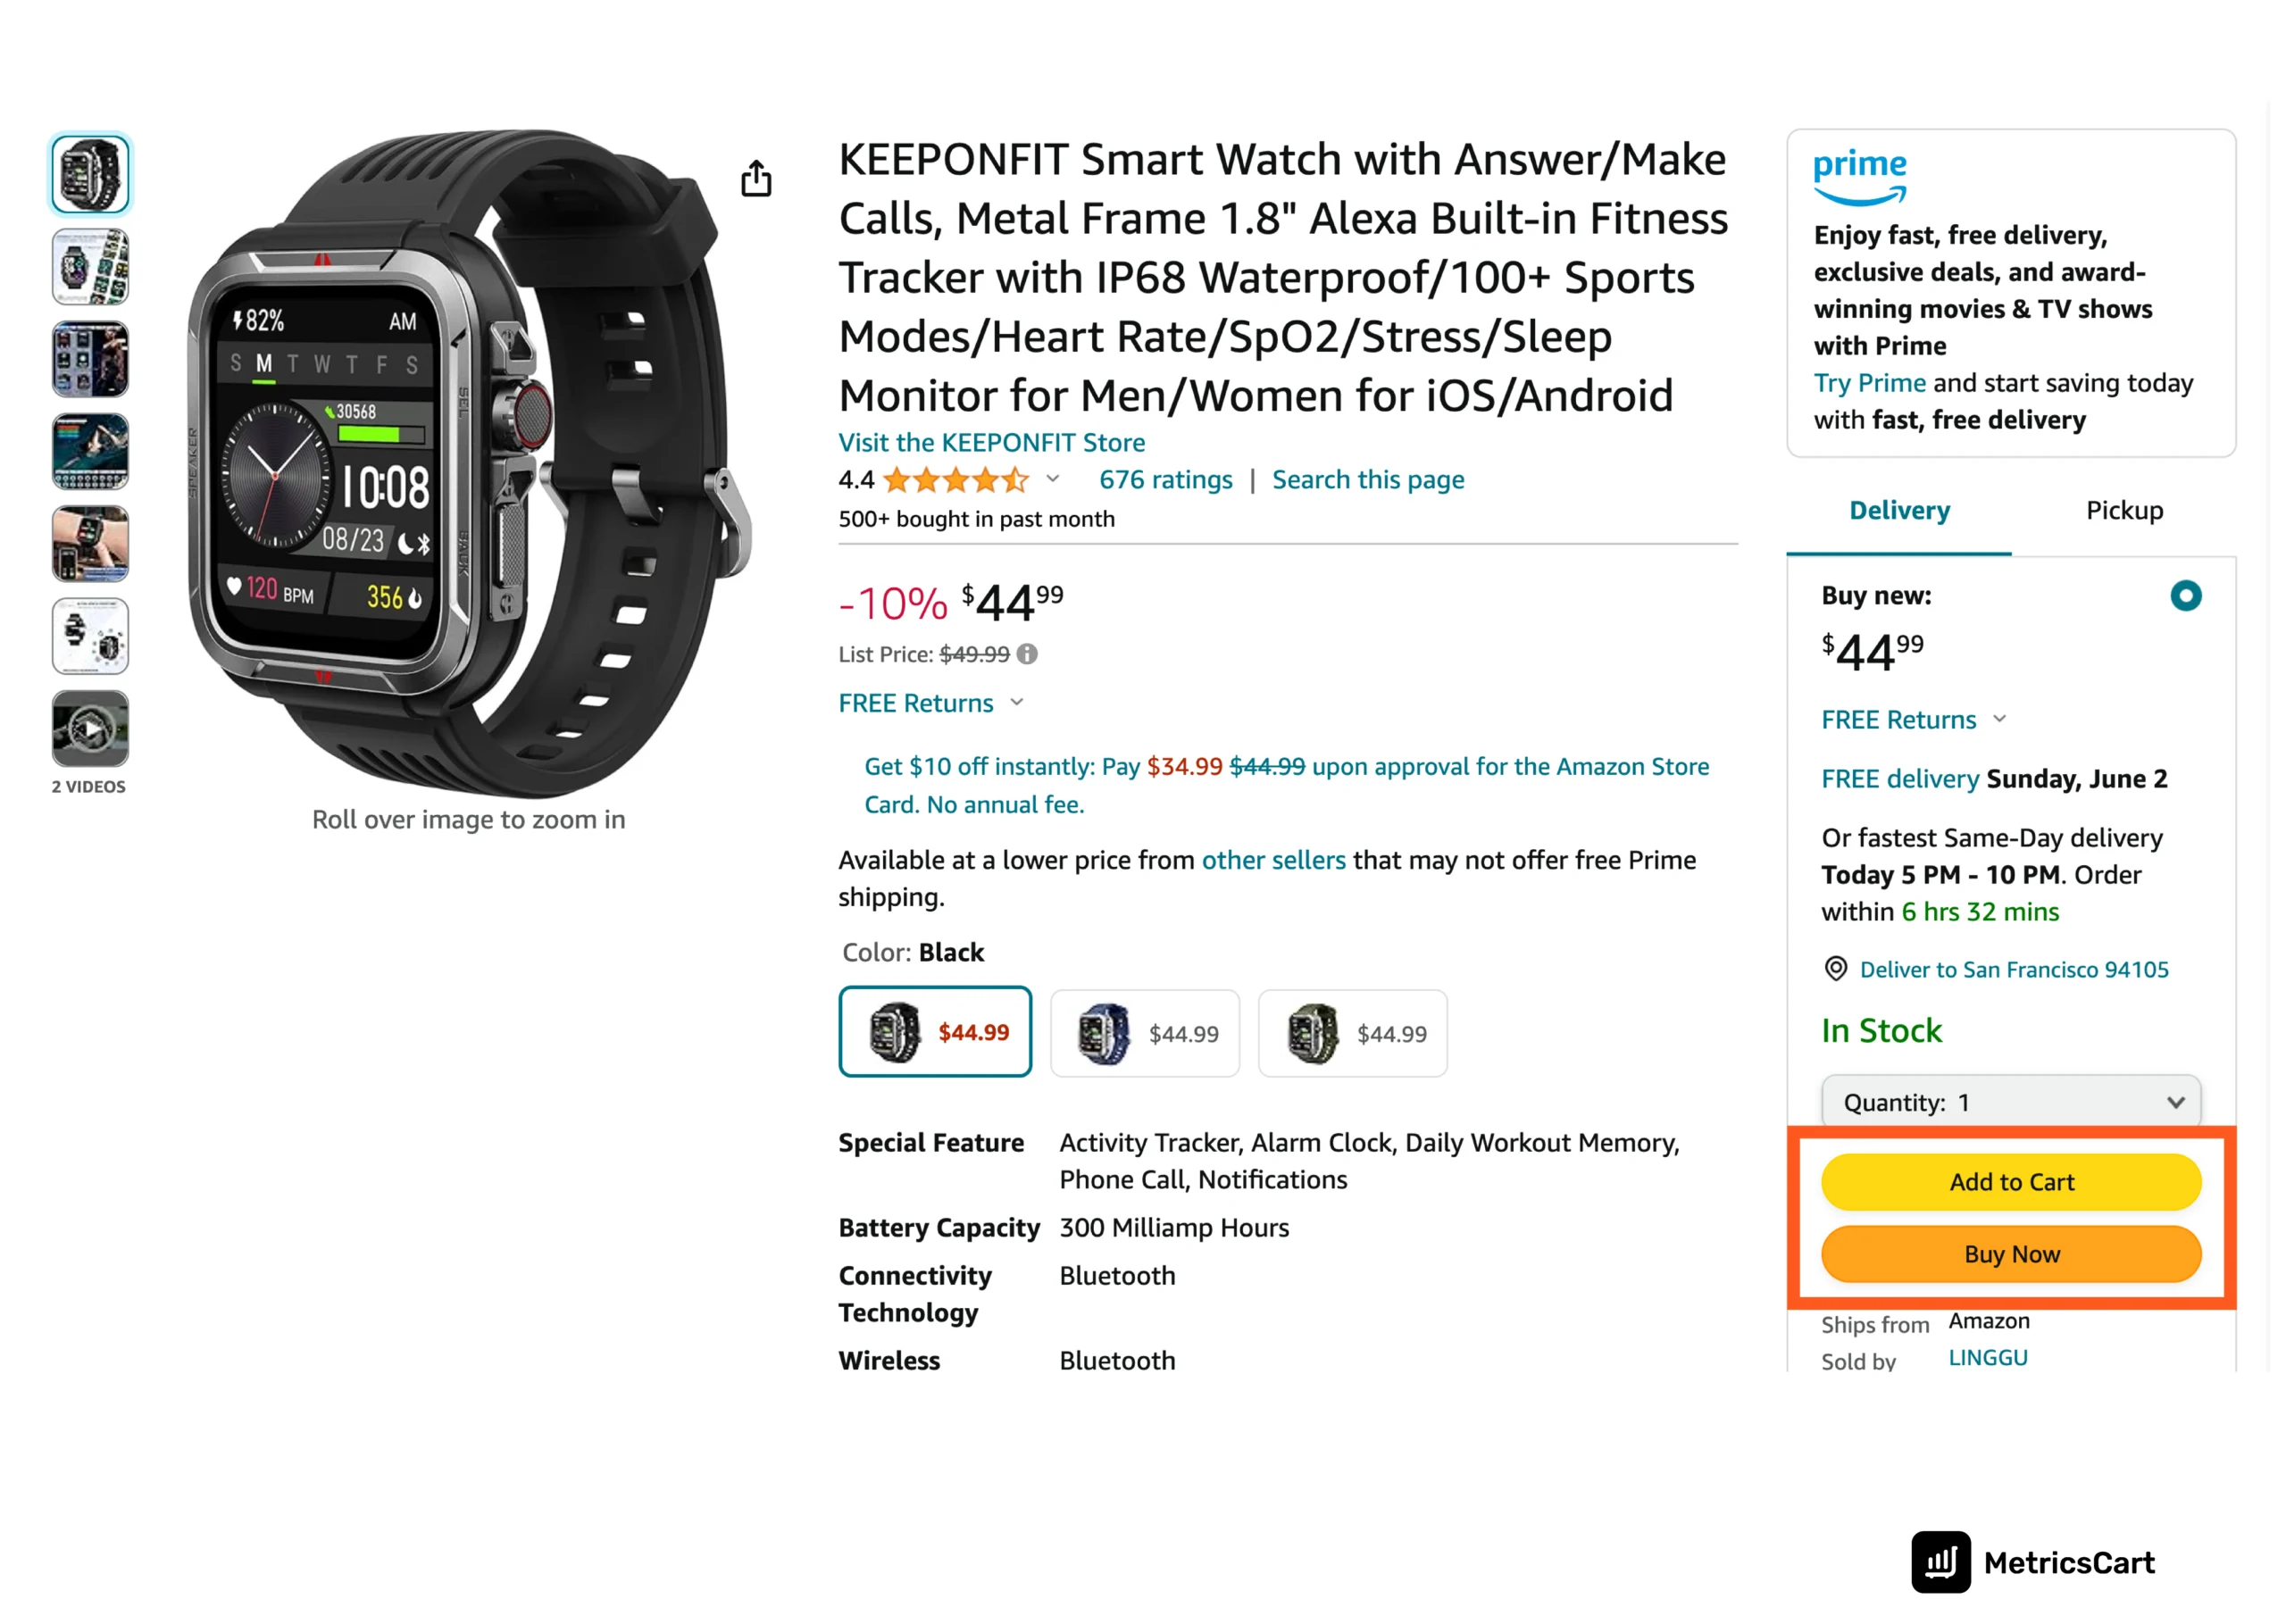
Buy box percentage or buy box wins refers to the number of times a particular brand or seller won the Amazon buy box. It is the box on the right-hand side of a product detail page that offers customers the options to “Add to Cart” or “Buy Now.”
Increasing the buy box percentage is important because 83% of Amazon sales come from the Buy Box.
 If a seller doesn’t win the buy box, consumers won’t see them as an option and probably won’t buy from them. As a result, it is optimal to keep the buy box percentage above 90% to prevent sales loss.
One of the primary reasons for Buy Box loss is MAP violations. When a third party or unauthorized seller violates the MAP pricing policy of the brand, there is a high chance that they will lose the buy box. Thus, it is essential for brands to utilize MAP monitoring software to track their MAP policies to increase the buy box wins. Some of the best MAP monitoring software right now include MetricsCart, Wiser, MAPTRAPP and more.
Other factors that can affect buy box percentage are:
- Negative customer reviews
- High product prices
- Incomplete product information, etc.
Product Ranking
Unlike casual browsing on other sites, Amazon users primarily use the search option with the intent of purchasing their desired product. With a plethora of options available for a single search, customers find what they need within the first couple of pages. In fact, studies reveal that 70% of Amazon customers never click past the first page of Amazon SERPs.
Therefore, brands must ensure that they secure the top product ranking. One of the first ways to ensure a higher ranking is through sales –the more sales, the higher the rank. This comes full circle as the brand on top will sell more items.
However, if you launch a new product on Amazon, brands can leverage various types of ads like Amazon PPC campaigns, sponsored product ads, and sponsored brand ads to improve the ranking.
Additionally, to improve organic product ranking, brands must:
- Add relevant keywords on the titles, product features, descriptions, etc.
- Offer competitive pricing for the product
- Ensure proper stock availability
- Increase the number of 4-star or 5-star customer reviews
Unit Session Percentage
Unit session percentage is Amazon’s version of the conversion or view-to-buy rate. It refers to the percentage of units sold in comparison to the product detail page views.
 Unit sold refers to the number of units sold to a unique visitor in the session.
A session refers to a unique customer viewing a brand’s product detail page once or more.
If the Unit Session Percentage Rate of a particular brand’s products is high, it indicates that the products are good and consumers are buying them regularly. A good unit session percentage on Amazon is between 7-15%.
On the other hand, a low unit session percentage indicates the need to adopt a better strategy to improve product performance. Some of the primary causes of low unit session percentage are:
- Unclear title or product description
- Bad or few customer reviews
- Under/over pricing
Therefore, brands must optimize the product listing and improve customer experience to increase the unit session percentage.
It is also worth noticing that Amazon will not suspend a brand’s seller account if the unit session percentage is low.
Pre-Fulfillment Cancellation Rate
The pre-fulfillment cancellation rate is the number of orders the seller cancels before shipment divided by the total number of orders for the week. This Amazon KPI counts every order.
 This usually happens when the online seller does not have declared stock to meet the customer demand. It can lead to poor customer satisfaction and retention. As a result, Amazon suspends the seller accounts with a more than 2.5% pre-fulfillment cancellation rate.
To avoid this, brands need to ensure proper inventory management. They can leverage assortment and availability monitoring software to keep track of the product stock and reduce the number of pre-fulfillment cancellations.
Order Defect Rate
Order defect rate (ODR) is the number of people with a negative experience/received a defective from a seller. It is calculated by dividing the number of negative orders by the number of orders over a period. Amazon uses this KPI to analyze the seller’s customer service standards.
 An order is considered defective by Amazon for:
- A-to-Z Guarantee claims
- Card chargebacks
- Negative reviews (1 or 2 stars)
Brands need to keep the ODR under 1%. If the ODR exceeds 1%, the seller will initially lose the Buy Box, receive a warning message, and subsequently lead to account suspension.
Therefore, brands must analyze and respond to all the reviews, and A-to-Z claims to identify the gaps in their customer service process and bridge them properly.
Conversely, if the claims made by the customer are fraudulent, Amazon will also protect the seller.
Late Shipment Rate
Late shipment rate (LSR) refers to the orders shipped after the expected shipment date by total orders. It is only applicable for seller-fulfilled orders.
 Since customers can view their order statuses in real-time, late shipment can affect positive customer experience, resulting in negative reviews, chargeback claims, etc. Therefore, brands need to keep their LSR rate below 4%.
An increased LSR can result in account deactivation. Once sellers receive the notification from Amazon Seller Control, they must submit a plan of action for reactivation.
Buyer-Seller Contact Response Time (CRT)
Buyer-Seller Contact Response Time is an Amazon KPI that measures the number of client queries processed by the seller within 24 hours, including weekends. This does not include auto-responses; a person must respond to the customer through emails.
A slow response time will negatively impact customer service and a brand’s product ranking.
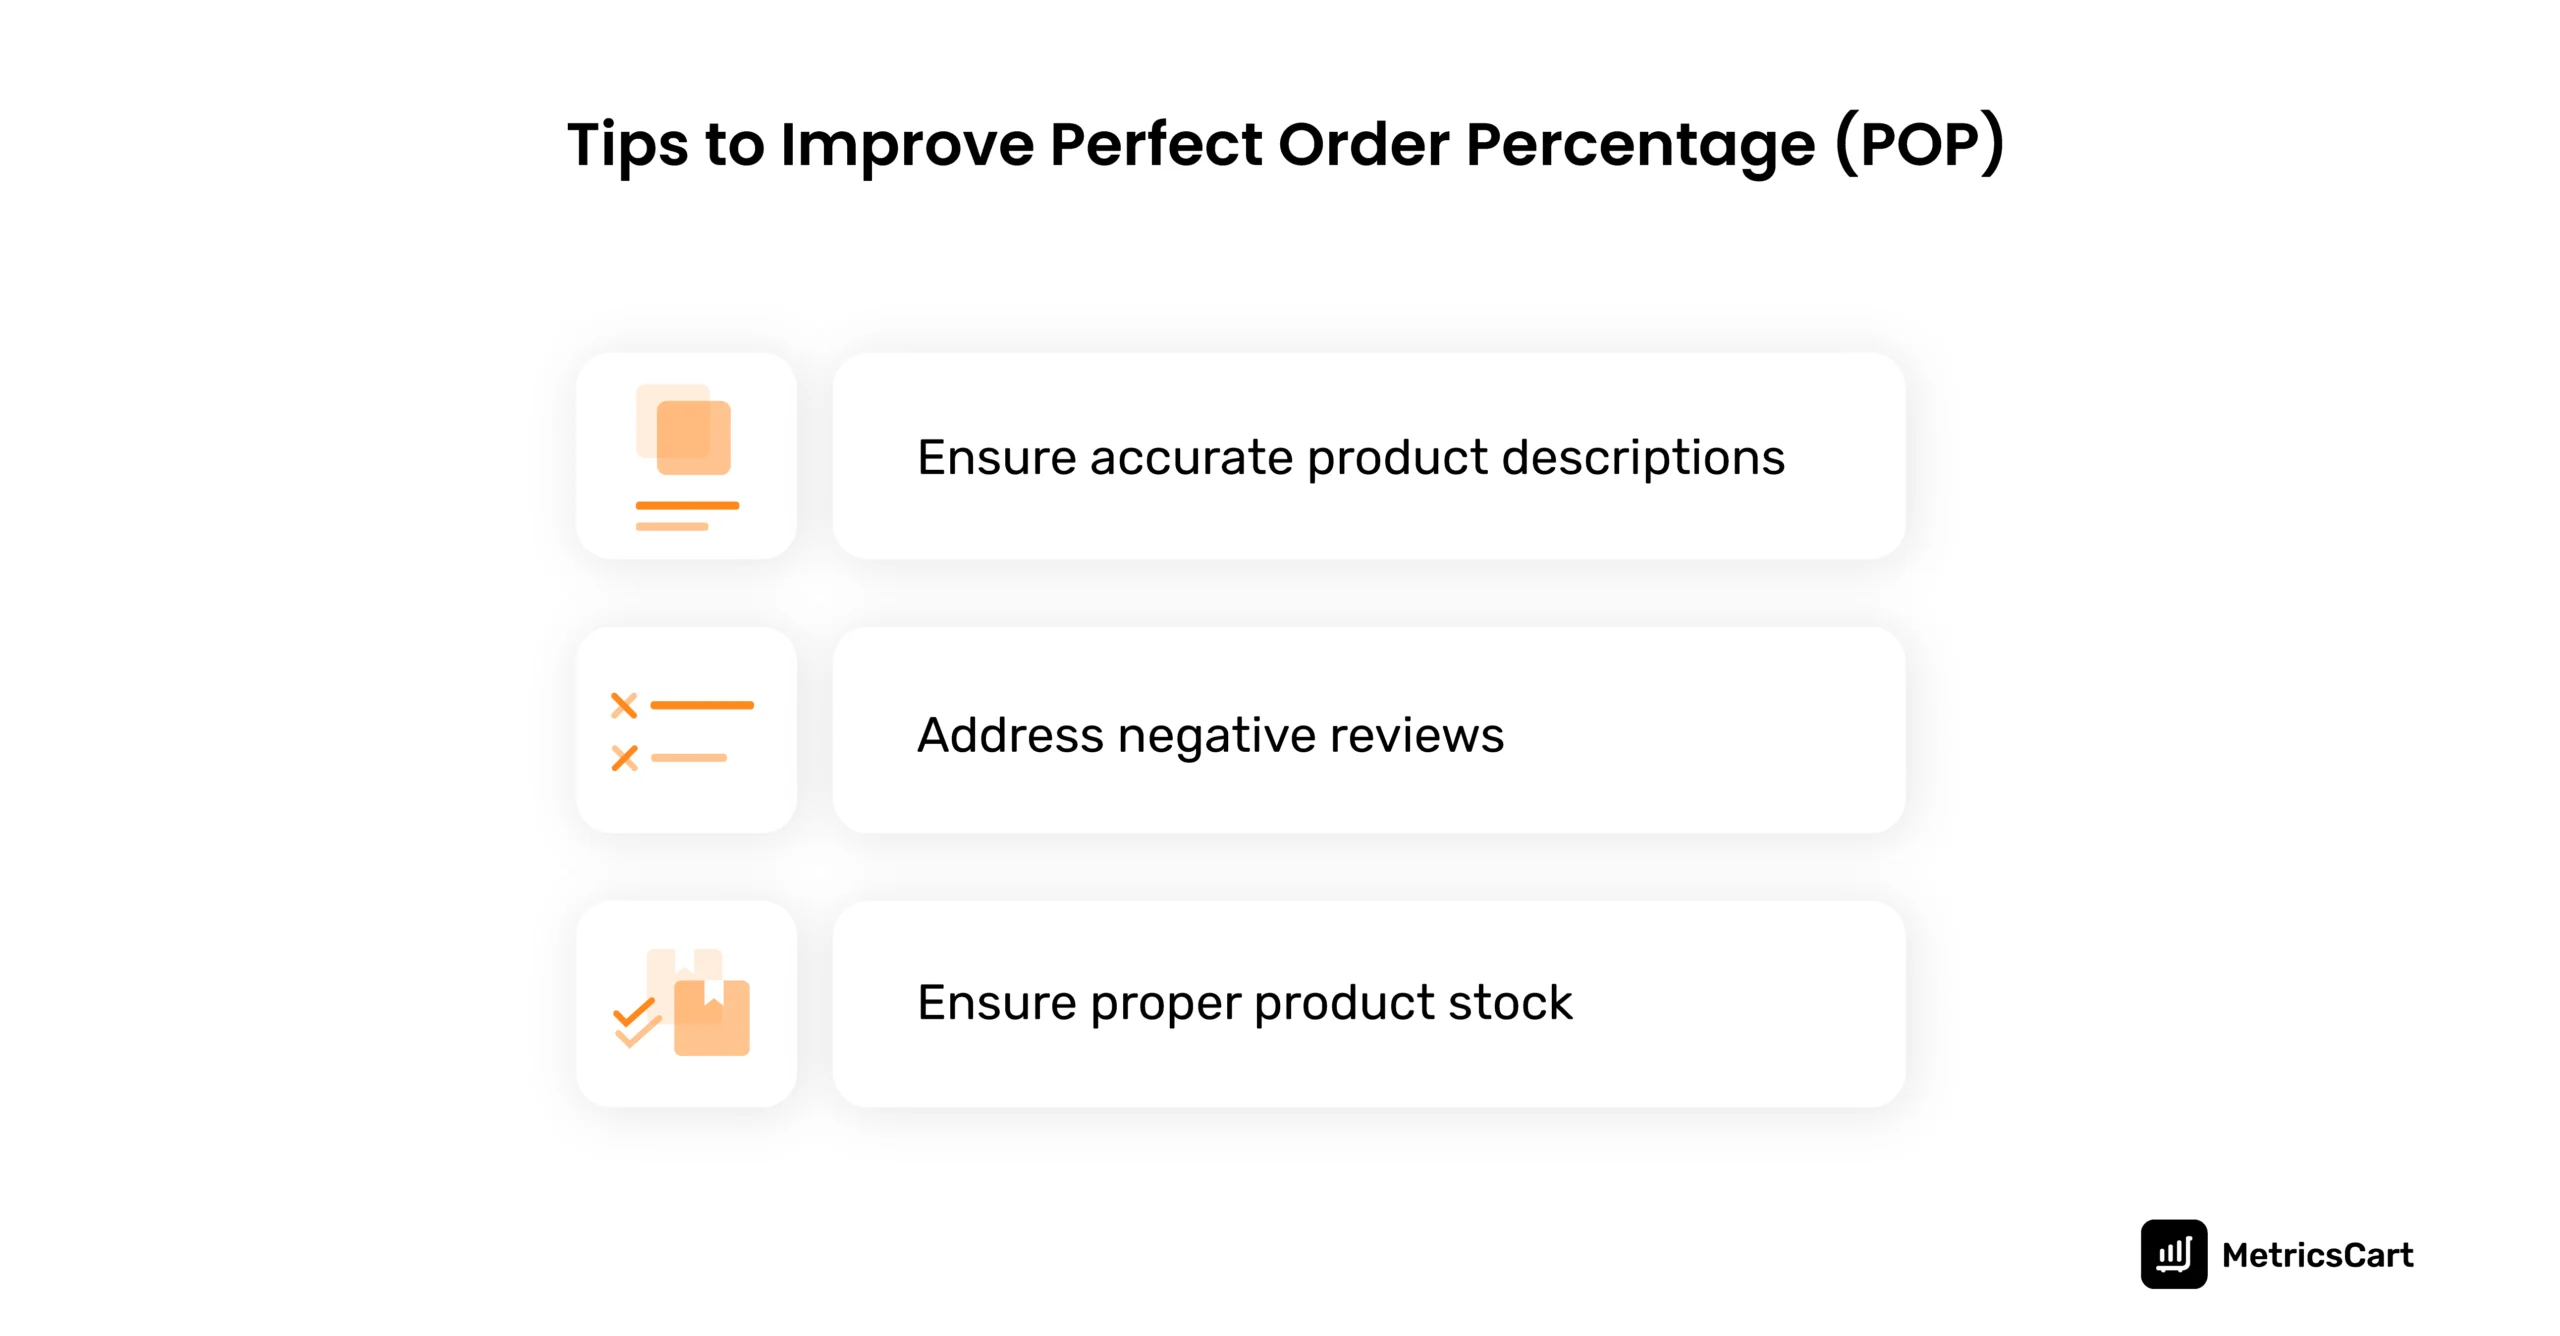
Perfect Order Percentage
Perfect order percentage (POP) reflects how well a company meets customer expectations by delivering orders correctly and on time.
The following factors can impact the perfect order percentage of a seller:
- A-to-Z Guarantee Claims
- Buyer-initiated messages
- Cancellations
- Chargebacks
- Late shipments
- Negative feedback
- Refunds
 If a seller’s POP score falls below 95 percent due to Order Defect Rates (<1%), Pre-fulfillment Cancel Rates (<2.5%), and Late Shipment Rates (<4%), Amazon takes action for not meeting performance goals.
Inventory Performance Rate
Inventory Performance Index(IPI) is an Amazon seller metric that determines how well a brand manages its inventory and stock up on products in demand. The score ranges from 0 to 1000.
According to Amazon, “An IPI score above 450 means your Fulfilled by Amazon(FBA) inventory is performing well, and a score above 550 indicates your inventory is a top performer. If your score is below 350, you may be subject to storage fees or limitations.”
The Inventory Performance Rate is analyzed based on the following factors:
- Excess inventory
- Standard inventory
- Sell-through rate
- In-stock inventory
This metric allows sellers to maintain an optimum inventory level and avoid out-of-stock situations.
Account Health Index
Account Health Index (AHI) is a measure Amazon uses to evaluate a seller account’s overall health and performance. It helps sellers understand how well they meet Amazon’s performance standards and policies.
This metric assesses your compliance with Amazon’s rules and standards. It considers factors such as:
- Product policy compliance
- Order defect rate
- Shipping performance
- Customer feedback and reviews
- Cancellations
It is a critical seller metric because a low account health index could lead to account suspension.
Enhance Your Amazon Seller Performance with MetricsCart
As we discussed above, each of these Amazon seller metrics is dependent on multiple factors like MAP monitoring, content compliance, inventory management, review analysis, and more.
With Metricscart’s robust digital shelf analytics software, you can seamlessly monitor every aspect of your e-commerce performance on one platform. Here’s how we can help:
- MAP Monitoring: Identify MAP violations and buy-box losses instantly.
- Review and Rating Tracking: Stay on top of product ratings and customer reviews to improve buyer-seller response time and account health
- Content Compliance: Optimize the listing with relevant titles, descriptions, and information to enhance product ranking.
- Inventory Management: Ensure stock availability for your products to reduce late shipments and improve perfect orders.
- Amazon Bestseller Reports: Gain insights into various brands and categories.
Contact us now to improve your performance as an Amazon Seller!!


