Imagine you’re selling on the biggest e-commerce retailer in the US. Consumers will be looking for the perfect deal, and your products check all the right boxes.
But here’s the catch: there are hundreds of brands just like yours competing for those same shoppers.
Winning on Amazon, Walmart, or Target’s online shelves is like being a digital wizard; it’s not just about having great products; it’s about knowing the tools that make them shine!
That’s where e-commerce Key Performance Indicators for digital shelf or KPIs come in. These tools don’t just measure clicks or views, but they tell you exactly how well you’re performing on that all-important “digital shelf.”
If you want to get your products in front of eager shoppers, keep them in stock, competitively priced, and loaded with those five-star reviews, then you’ve got to track the right KPIs.
So buckle up because, by the end of this, you’ll be armed with everything you need to make sure your brand owns that digital shelf, maximizing visibility and conversions just in time for the busiest shopping season of the year.
Digital shelf analytics software is a great way to streamline and monitor e-commerce KPIs and maintain a consistent brand identity.
What Are E-Commerce KPIs?
E-commerce KPIs can be defined as quantifiable measures that help businesses track their progress toward specific goals in digital commerce. Unlike general metrics, KPIs focus on high-level goals, offering valuable insights into overall business health and strategic progress.
For digital shelf management, e-commerce KPIs help brands understand how well they are performing in areas such as visibility, pricing, and customer engagement across online retail platforms.
READ MORE | Interested in knowing about product content KPIs? Check out our blog on 7 Product Content KPIs You Can’t Afford to Ignore
Digital Commerce KPIs vs. Metrics: What’s the Difference?
Though e-commerce KPIs and metrics are both used to track performance, they serve different purposes:
Digital commerce KPIs are high-level, strategic indicators that assess progress toward specific business objectives. In the case of digital shelf management, overarching goals include improving product discoverability, maximizing conversion rates, decoding reviews, or increasing competitive positioning.
On the other hand, e-commerce or digital shelf analytics metrics are detailed data points that provide insights into specific activities but are not tied to strategic goals. For instance, page views, search results, or average session duration are metrics that indicate user behavior but don’t necessarily reflect the business’s success in reaching its strategic goals.
In short, KPIs reflect performance toward business goals, while metrics offer granular data to inform those KPIs.
6 Essential E-Commerce KPIs for the Digital Shelf
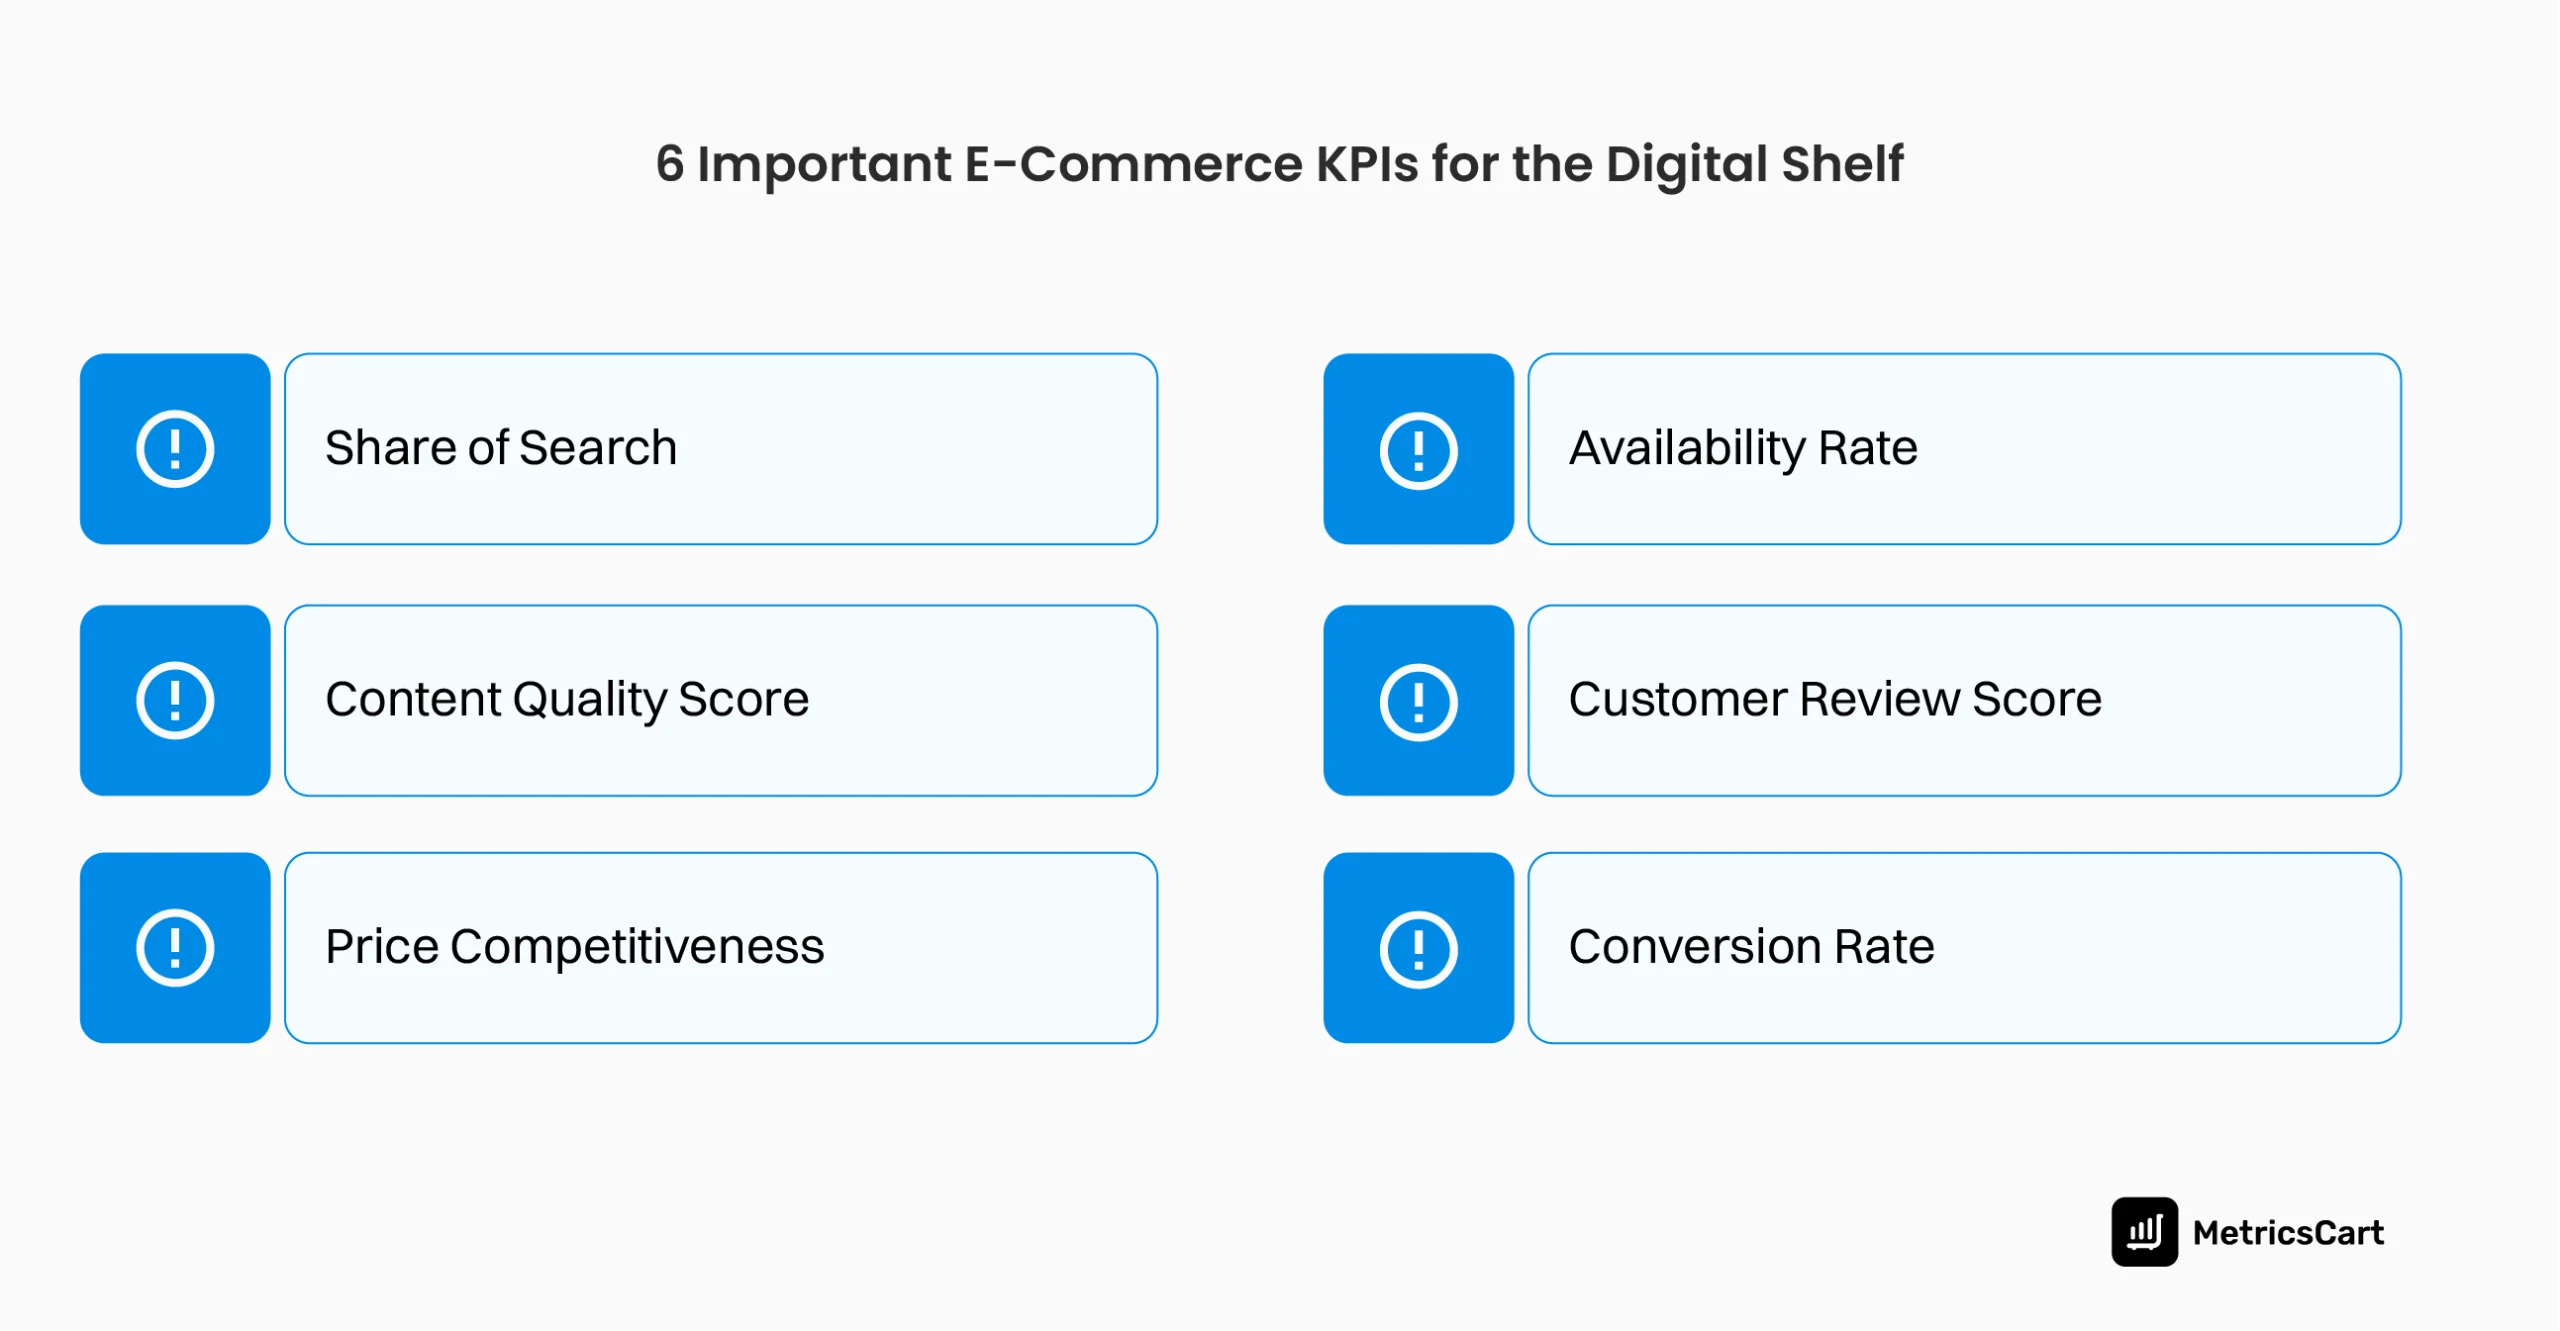
There are numerous e-commerce KPIs that we can use as indicators for different aspects of your digital commerce business. But here are the six important ones to keep in mind:
Share of Search (SoS)
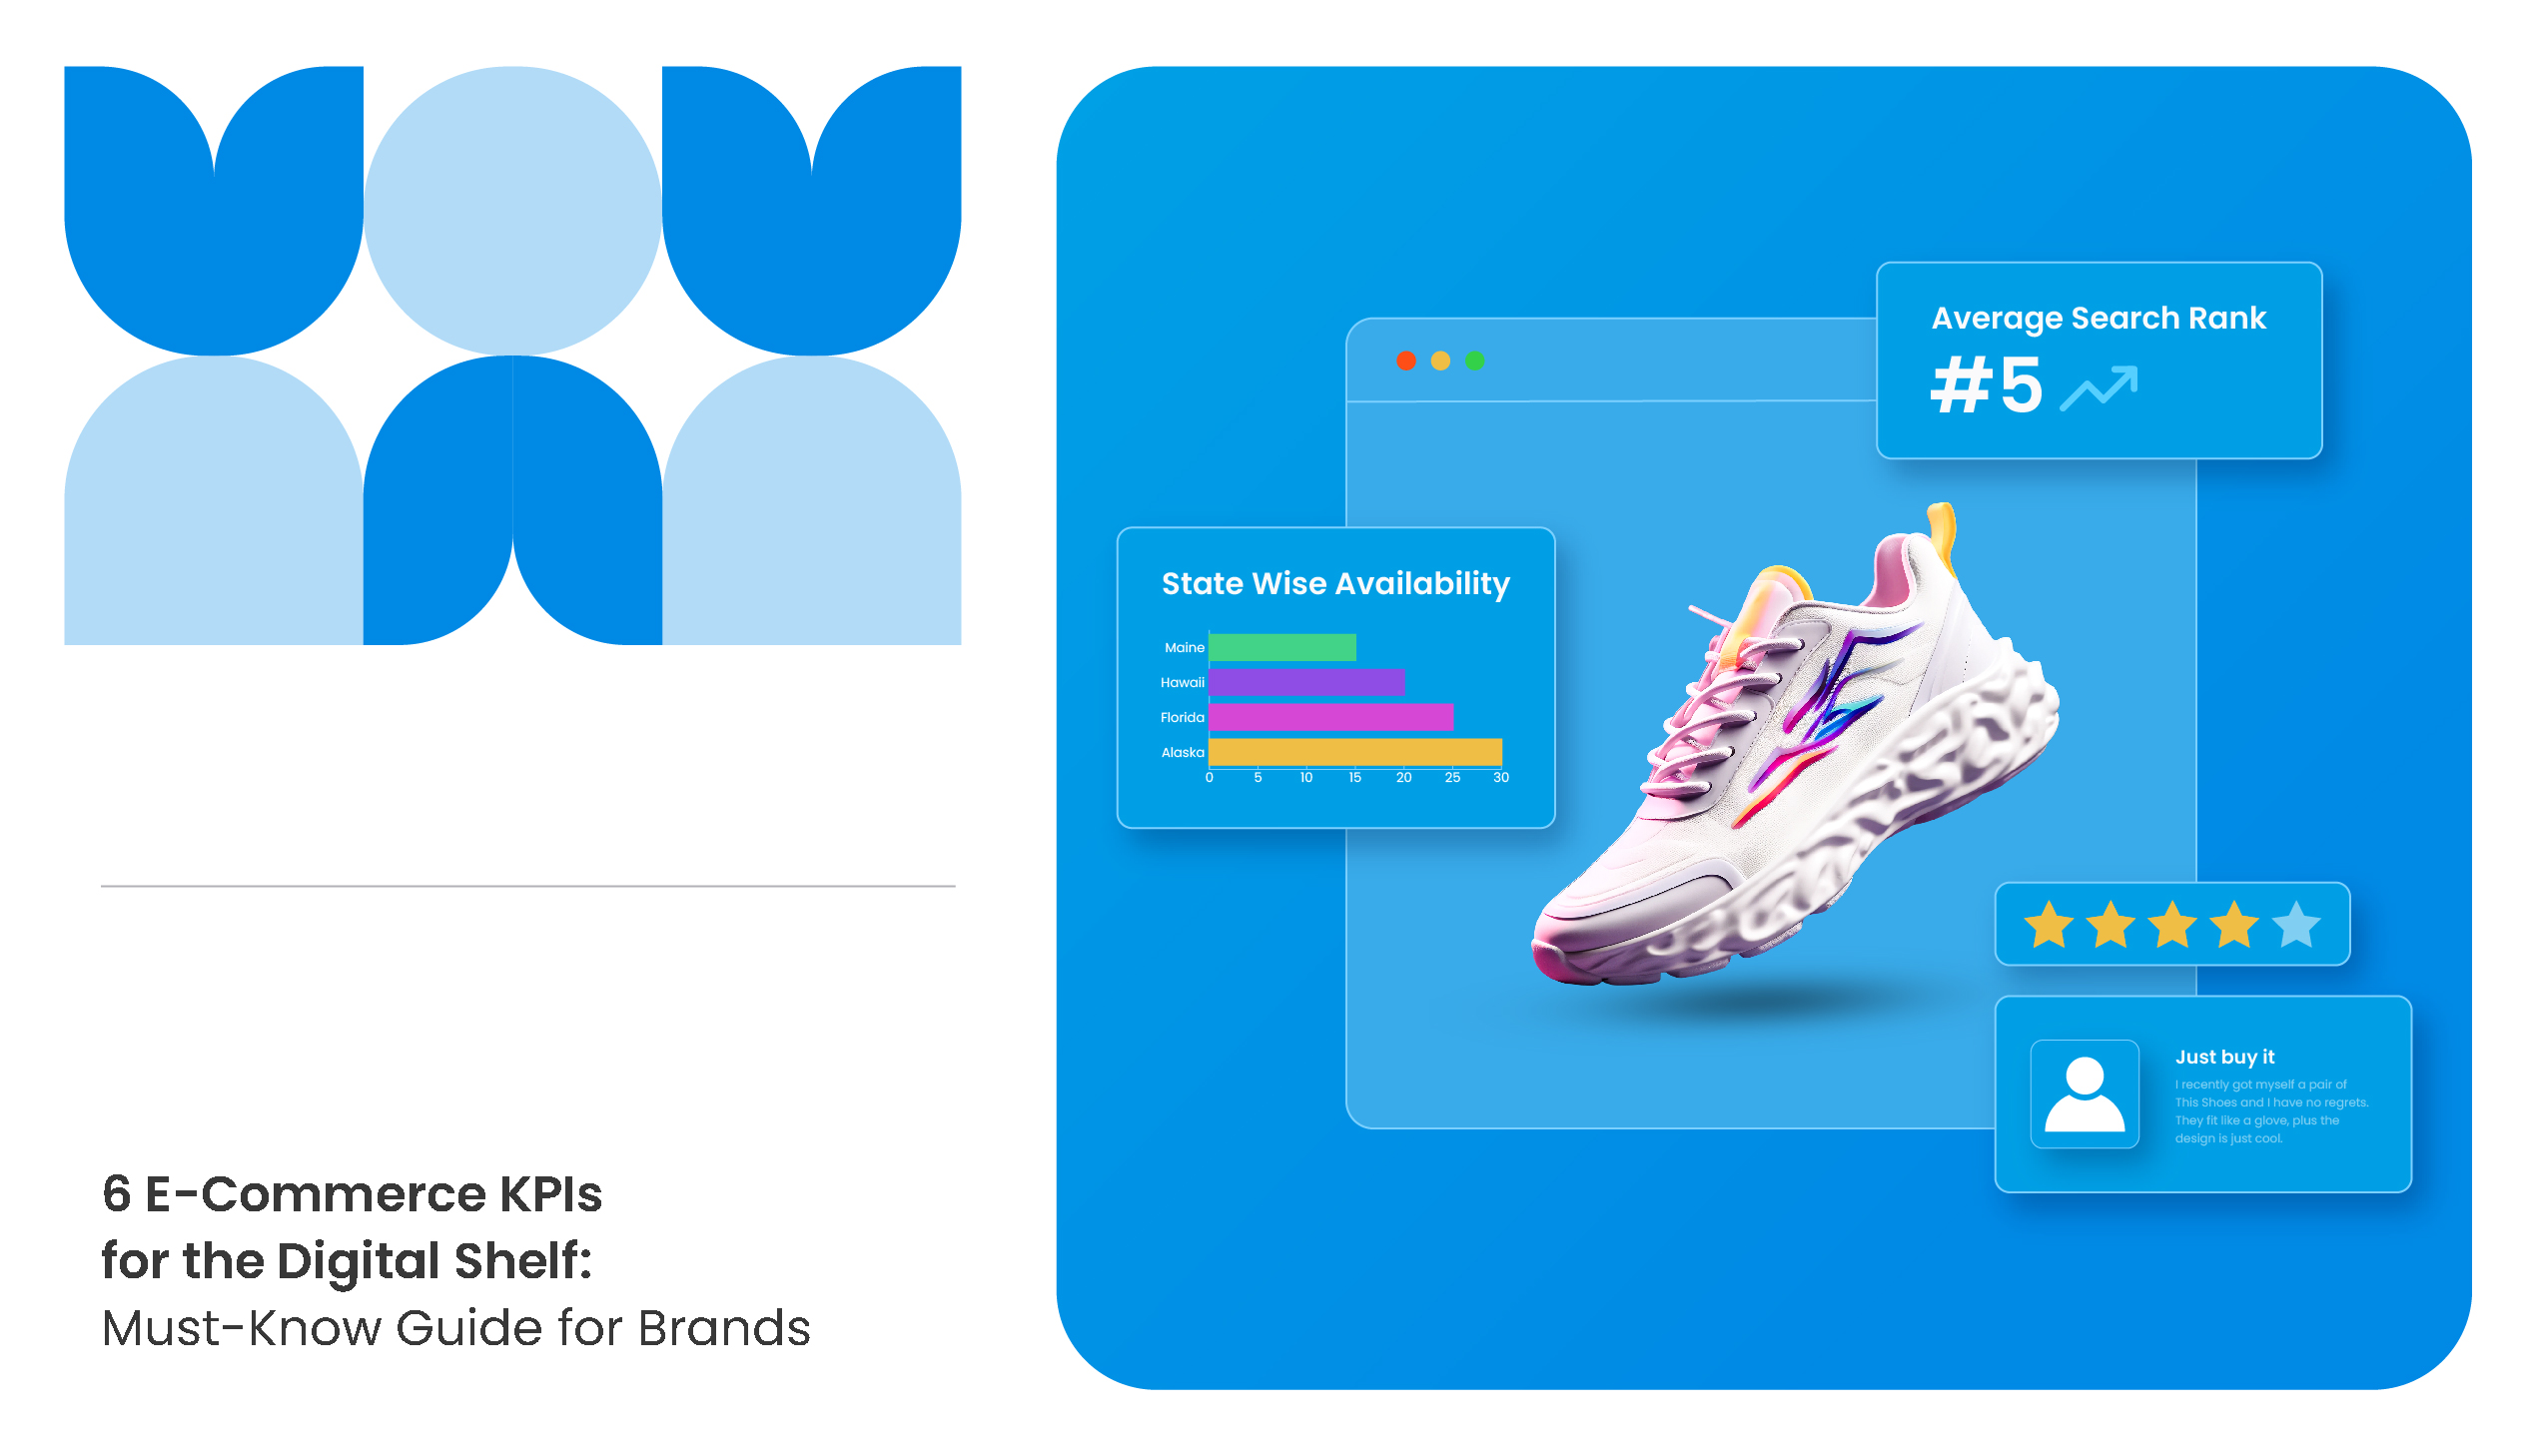
Share of Search measures how often a brand’s products appear in search results compared to competitors for key search terms.
A high SoS score shows that the brand’s products are effectively optimized with relevant keywords and are prioritized by the platform’s algorithm. It increases the likelihood of customers encountering your products early in their search journey, which translates to better conversion rates.
Optimize product titles, descriptions, and backend keywords to align with search trends and competitor strategies. Leveraging paid search placements can also boost SoS in highly competitive categories.
However, to correctly implement these strategies, you need to have an e-commerce share of search software that can monitor and give timely alerts on your brand’s search ranking.
Content Quality Score
Content Quality Score evaluates the completeness and importance of content compliance on e-commerce platforms. This KPI encompasses titles, descriptions, images, videos, and other digital assets that contribute to the product’s presentation.
A high content quality score indicates that product listings are informative, engaging, and aligned with platform guidelines, which helps increase conversion rates.
Quality content enhances user experience, reducing bounce rates and abandoned carts while encouraging higher engagement.
Regularly audit content for accuracy and implement content compliance software. This will help you to maintain high scores, high-resolution images, informative videos, and comprehensive descriptions.

Price Competitiveness
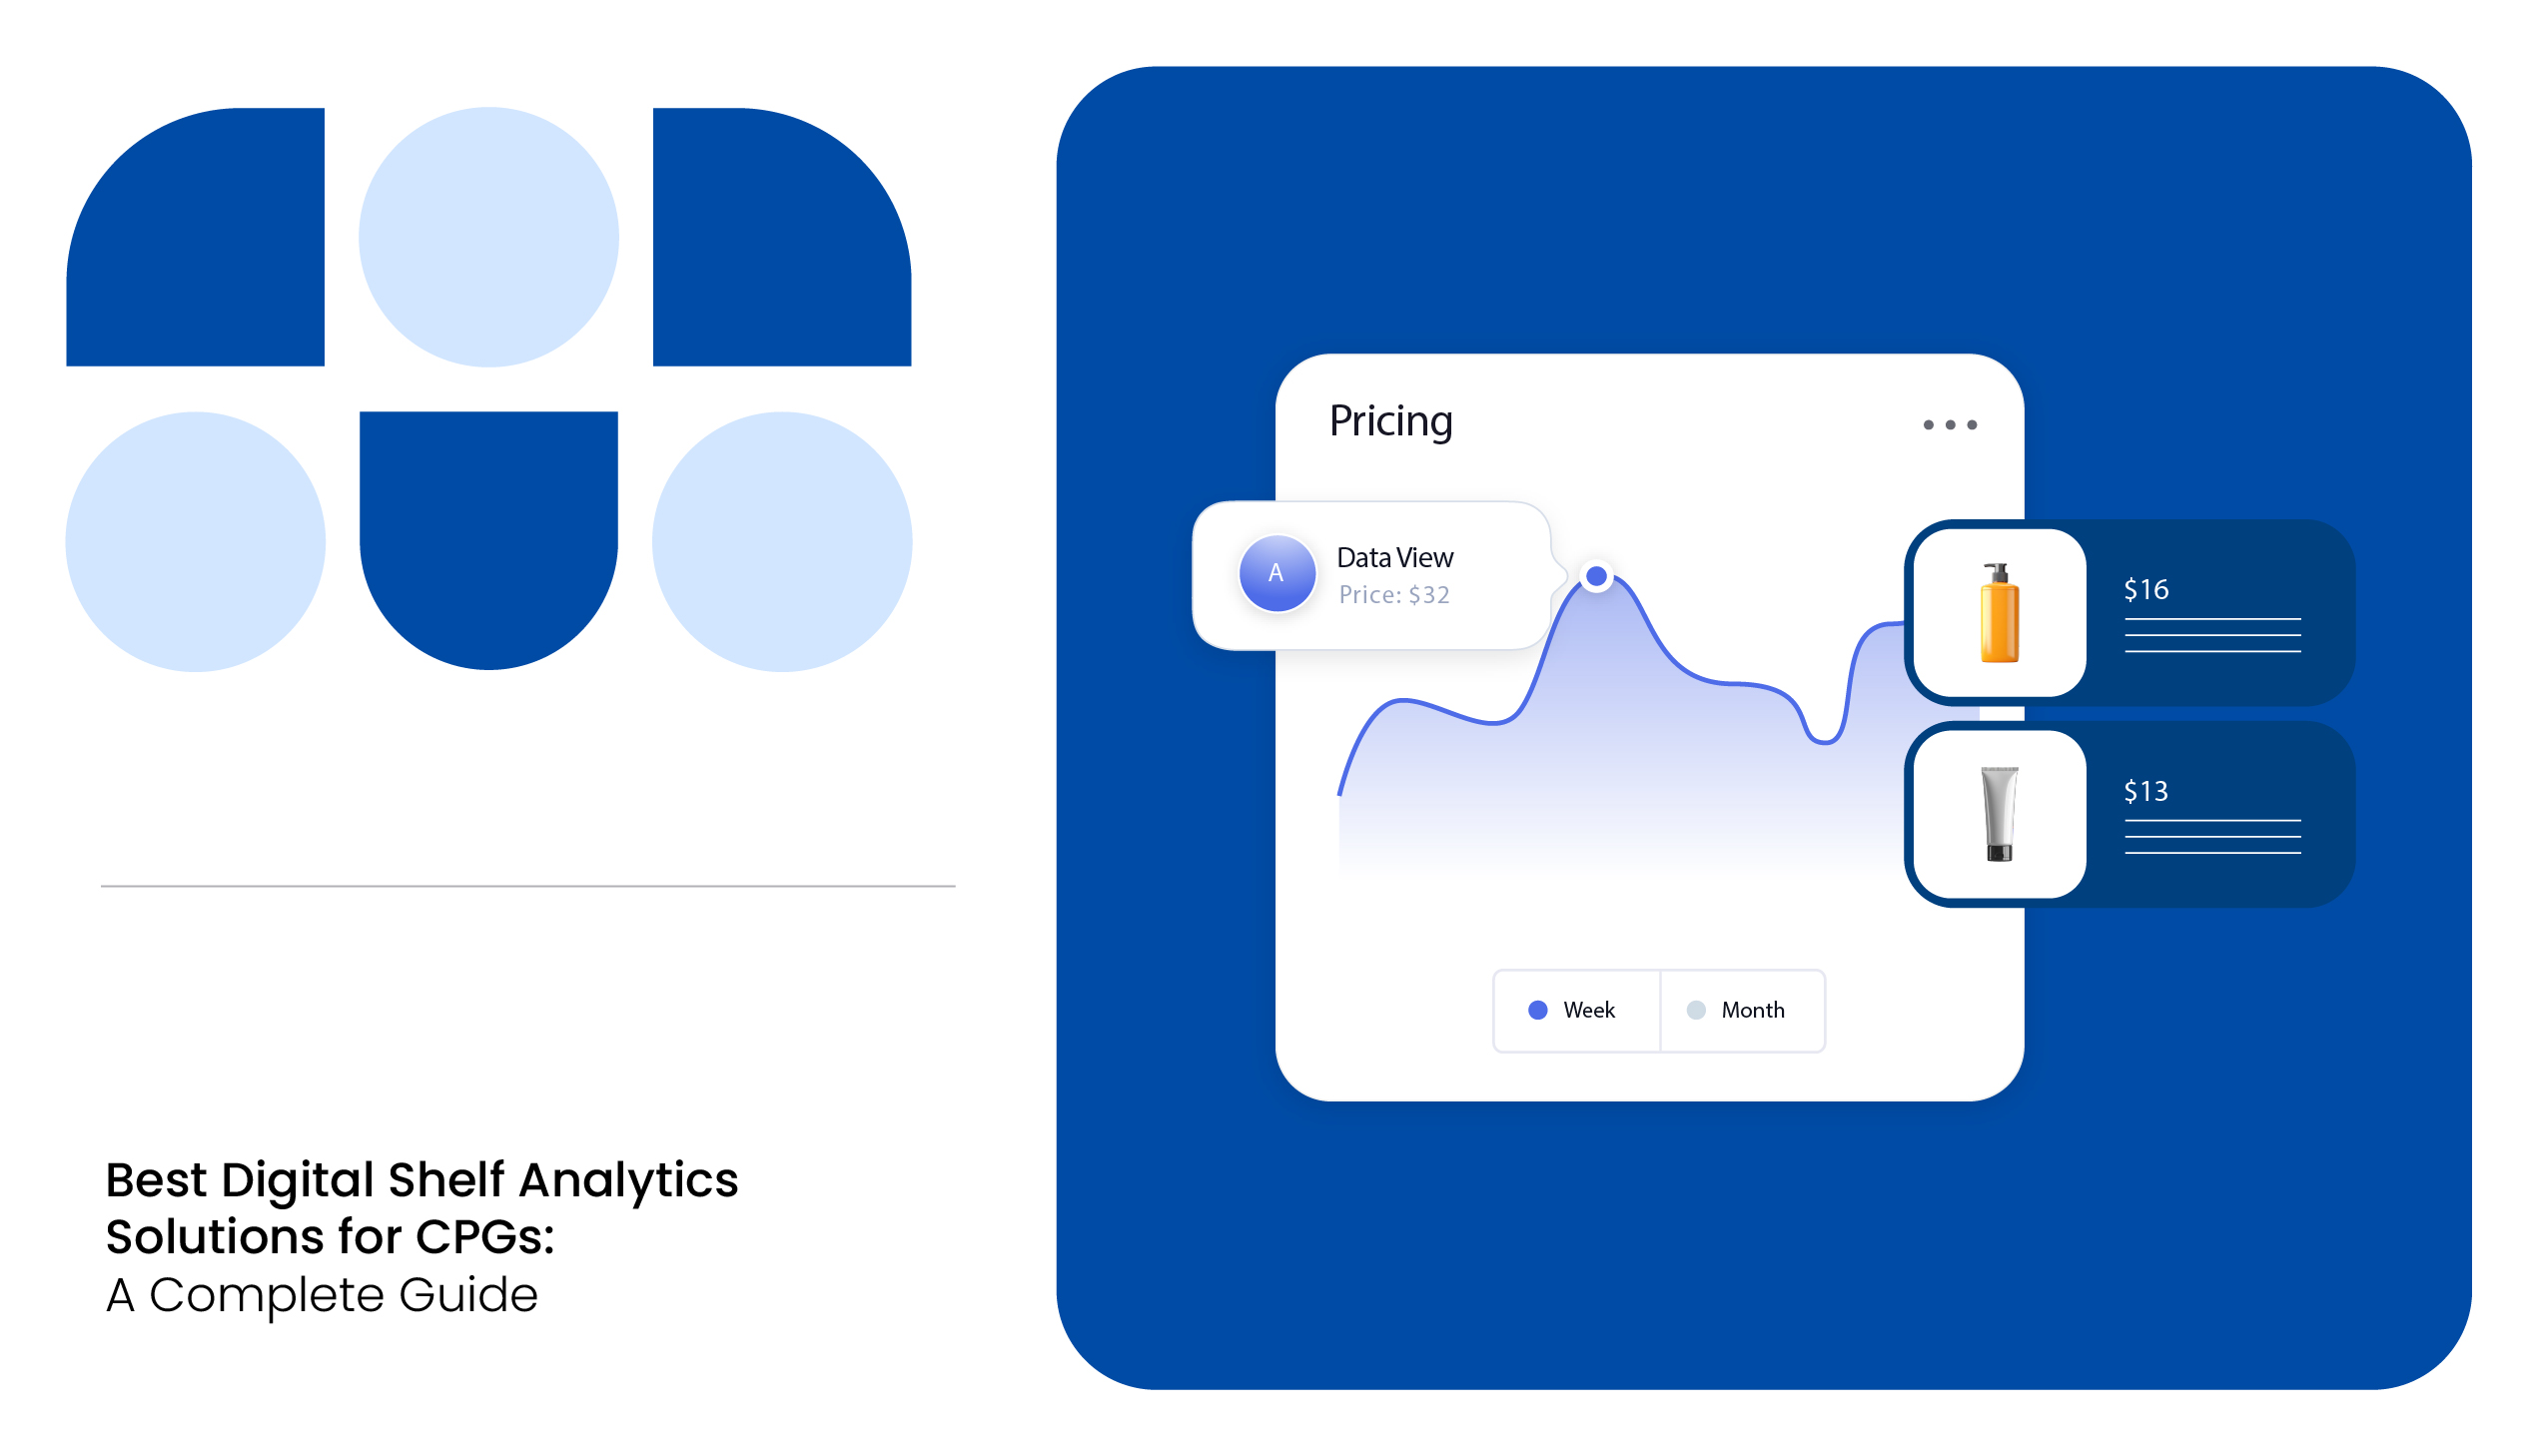
Price Competitiveness measures how your pricing compares with that of similar products on the platform. In an environment where consumers can easily compare prices, competitive pricing is vital to attracting buyers. This KPI helps brands understand where they stand in relation to competitors, which can inform pricing and promotional strategies.
Shoppers prioritize value for money. Competitive pricing can increase conversions, while uncompetitive pricing can lead to lost sales.
Monitor competitor pricing regularly and adjust your prices or offer promotions to remain competitive. Using a price monitoring tool can help you maintain an edge.
Availability Rate
Availability Rate is a KPI that tracks the consistency of product availability on e-commerce platforms. It measures the percentage of time a product is in stock, indicating how healthy inventory is managed.

In the first episode of the Digital Shelf Insider Podcast, we sat down with Murray to learn more about the successful digital shelf strategies that brands have adopted. You can listen to the full episode at:
Most of the time, manufacturers try to offer an exclusive and diverse range of products to consumers through digital commerce platforms. So, it is essential to manage your inventory with regard to your sales goals.
Analyzing historical sales will also help forecast demand accurately, especially during peak times like the holiday season.
Out-of-stock products not only miss potential sales but can also harm rankings and SoS scores as algorithms prioritize in-stock items.
The use of assortment and availability monitoring software ensures consistent availability, maximizes potential sales opportunities, and contributes to maintaining search visibility.
Customer Review Score
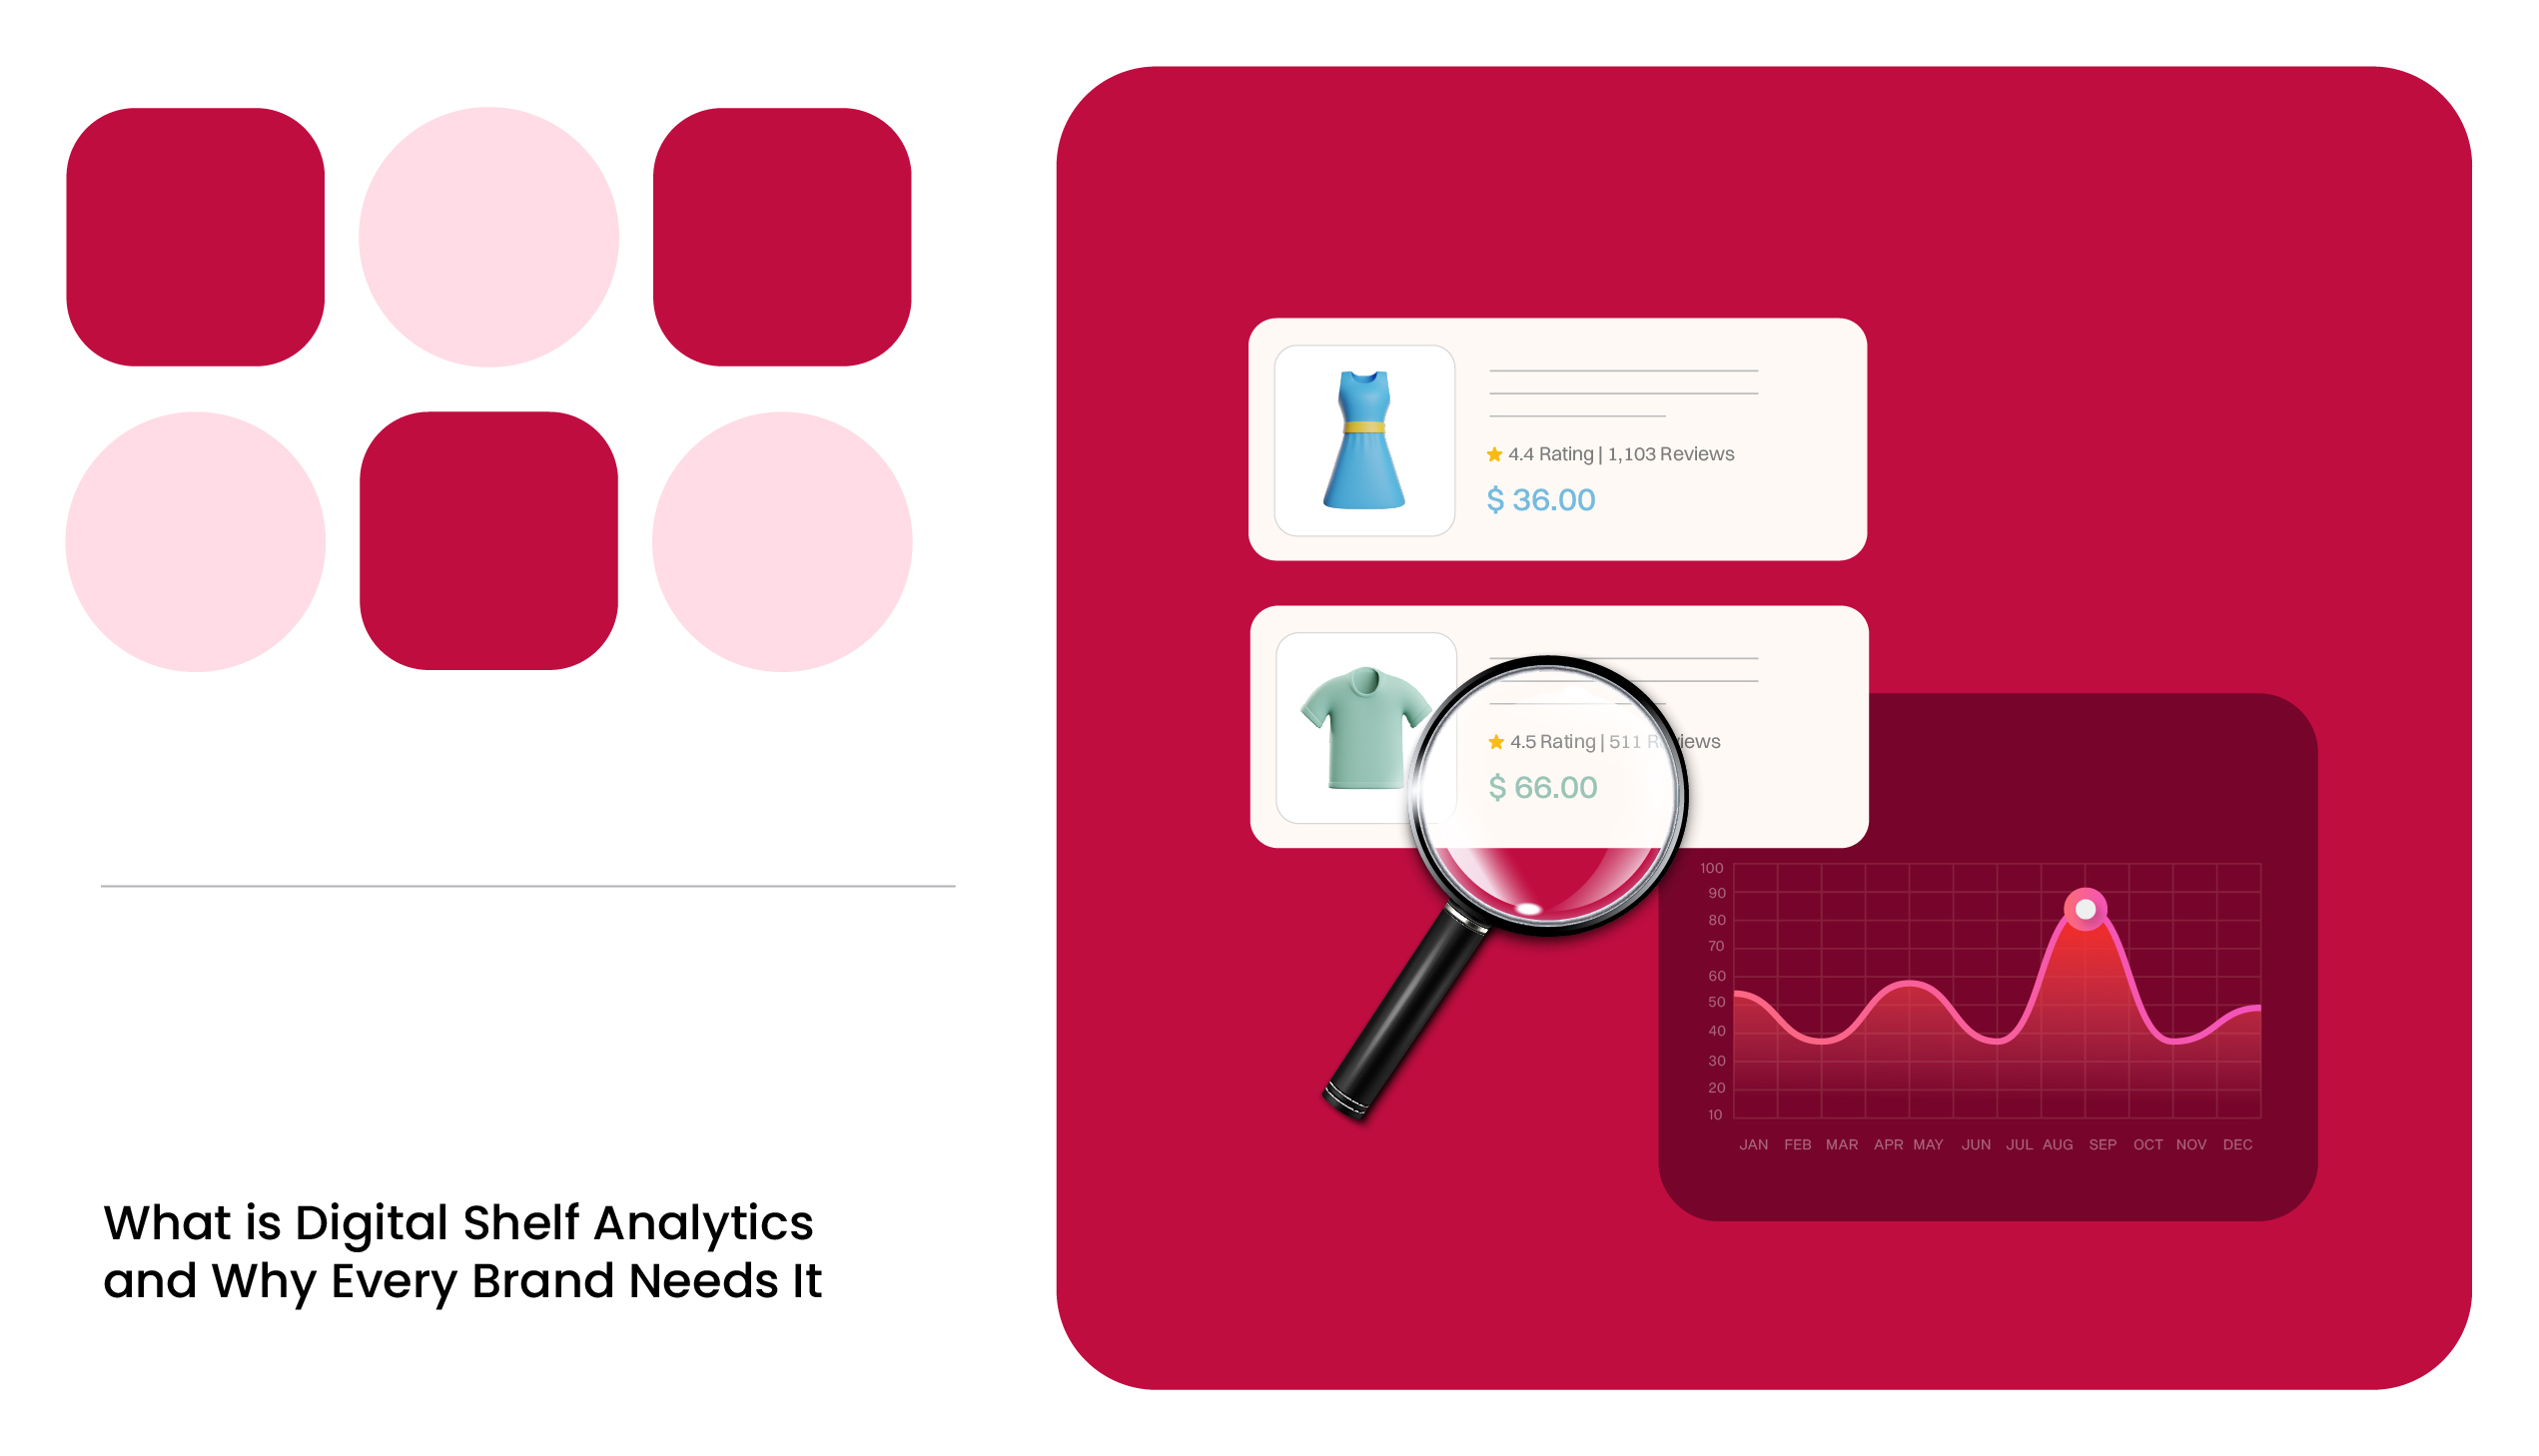
Customer Review Score is the average rating given by customers and is crucial for building trust and encouraging conversions. High ratings and positive reviews influence buying decisions significantly and can enhance the product’s visibility in search rankings.
Reviews provide social proof, helping reassure prospective customers about the quality and reliability of the product.
Encourage satisfied customers to leave reviews, respond promptly to customer feedback, and address any recurring issues in the product. Implementing a review monitoring tool that has advanced features like thematic review analysis can also help you gain a better perspective of your brand positioning.
READ MORE | Confused about finding the right review monitoring tool? Check out our blog on Choosing the Right Online Review Management Software: A Brand Perspective
Conversion Rate
Conversion Rate measures the percentage of visitors who purchase a product after viewing its listing. This KPI is a direct indicator of how effectively a product listing converts interest into sales. A high conversion rate signifies a solid product-market fit and optimized product presentation.
The average conversion rate on e-commerce is around 2.5%, which is an important measure of listing effectiveness and plays a role in a product’s ranking on e-commerce platforms.
Enhance product descriptions, use clear and compelling images, and ensure competitive pricing. To improve conversion, consider adding customer reviews and optimizing listings based on consumer feedback.
Apart from these main digital commerce KPIs, you can also look into others like:
- Click-Through Rate (CTR)
- Add-to-Cart Rate
- Share of Voice (SOV)
- Product Return Rate
- Inventory Turnover Rate
To Sum Up the KPIs That Define E-Commerce Performance
From ensuring strong search visibility to maintaining competitive pricing, each KPI offers unique insights that guide brand strategies. By focusing on these six essential KPIs, brands can enhance their digital shelf presence, increase conversions, and strengthen customer loyalty.
With the right digital shelf analytics software, managing your digital commerce KPIs will be more accessible than ever. Monitor prices, unlock new review insights, and scale better than your competitor in a snap!
Get Ahead and Stay Ahead. Unlock E-Commerce Success Now!
FAQ
To improve SoS, brands can optimize product titles, descriptions, and keywords to align with popular search terms. Investing in paid search placements and refining keyword strategies based on competitor analysis are also effective ways to boost SoS in competitive categories.
Brands should consistently monitor KPIs, ideally weekly or monthly, to quickly identify trends and address issues. This frequency allows for timely optimizations in areas like pricing, content updates, and review management, keeping the brand competitive on digital platforms.
KPIs are high-level indicators that align with strategic business goals, while metrics provide detailed insights into specific activities. For example, Conversion Rate (a KPI) shows overall listing effectiveness, whereas page views (a metric) simply track engagement.
Conducting regular digital shelf audits helps brands assess and refine their product listings, ensuring alignment with platform guidelines and competitive standards.
Location-based availability data helps brands identify out-of-stock issues across specific regions, ensuring they can address gaps in local markets. This data allows brands to manage supply chain strategies effectively, keeping products available in key areas.

