In the words of Les Binet, Head of Effectiveness at adam&eve DDB, “The relationship between conventional brand tracking metrics and the actual purchase behavior is often surprisingly weak.”
Knowing what’s on the consumer’s mind is crucial for brands. So is knowing what other brands do to compete for online presence. However, conventional approaches of surveys and tracking ad spending are falling short. A universal metric like Share of Search can open new doors to business insights and opportunities.
Share of Search: A Practical Way to Track Consumer Demand
Share of Search gives you a macro perspective on the competitive landscape. Thus, becoming a great addition to the metric wheelhouse. Of late, it is being explored with great interest in the marketers’ world.
Firstly, Who Are the Minds Behind Share of Search?
More than a decade ago, a colleague approached Les Binet. The colleague pointed out how there should be a Share of Voice for the digital era. Les explored and explored to learn about the share of buzz on social media. Yet this couldn’t fully crack down on the actual digital positioning for brands.
In 2020, the metric was introduced at the IPA-led EffWorks Global Conference. Les Binet along with James Hankins, Founder and Marketing Strategist at Vizer Consulting, led an extended EffWork session. There, they discussed the metric in length.
And What Are Their Findings?
Les and James individually covered how the metric could impact sales, ensure marketing effectiveness and help in decision-making. Les elaborated Share of Search as both a brand metric and an advertising metric. Using econometric modeling, Les looked into three categories – automobiles, gas and electricity, and mobile phones.
On the other hand, James explored how the metric is also applicable to fast-moving consumer goods categories such as crisps, makeup, teas, and more. He even elaborated on the many practical applications of the search metric.
This comprehensive analysis unlocked a new level of possibilities for brands and marketers alike.
So, What Is Share of Search in an E-commerce Perspective?
Share of Search is the key metric that measures a brand’s online visibility in comparison to other brands in the same industry. Simply put, it is how many times your brand’s name has been searched online. It takes into account only the organic searches for the brand.
It is a strong predictor of market share and brand health. It acts as an early warning system, pinpointing which products or categories are losing visibility and need immediate attention on the digital shelf.
Share of Search vs. Share of Voice: What’s the Difference?
There is a misconception that Share of Voice (SoV) might replace SoS, but that is not the case. But what exactly is Share of Voice? It is a measure of the market share of your brand when compared to your competitors. In short, it is the paid advertising that your brand does to keep up with the competition.
Shann Bigilone, Strategist and Head of Kelp, describes Share of Voice as a measure of input — a thermostat. On the contrary, SoS measures an outcome — a thermometer. Brands have used the Share of Voice metric for decades to set their ad budgets. They set their Share of Voice higher than Share of Market in order to grow.
Share of Search: A Proxy for Share of Market?
Share of Search is perceived to be a leading indicator of market share. As the SoS increases, the Share of Market also increases. James Hankins presented how Share of Search is a proxy for Share of Market, but not a replacement.
To define Share of Market, it is the revenue of the brand for a certain period relative to the industry revenue for that period. However, many companies don’t have access to market share data. This is where SoS becomes representative of Share of Market. Moreover, It can effectively predict market share several months in advance.
Getting on the Top of Retail Search Engine Result Pages (SERP) Is a Fierce Game for Brands.
People search both — product-specific and brand-specific. Product-specific searches like ‘toys for kids’ have monthly average searches of 22000. While some search queries are slightly speculative such as ‘toys from recycled materials,’ which has a search volume of only 30. For a green-toy brand to gain online visibility from both searches, they need to make sure the right keyword based on search terms are placed on the product detail pages.
READ MORE | Pop culture and rising disposable incomes are transforming how people purchase toys. Check out The Future of Fun: Rising Trends in the US Online Toy Industry.
What Does Share of Search Measure?
For brands, this metric provides a wide array of analytical insights from search results. This includes the featured and sponsored products, organic position, and page rank. It also provides timely updates and notifications for any changes in ranking. Nonetheless, it becomes inevitable to identify and take action on keyword gaps.
A robust Share of Search analysis platform, such as MetricsCart’s, can be a valuable solution when it comes to comparing more than five search queries for your brand at a time. With MetricsCart, you can monitor the Share of Search for your brand across all online marketplaces and analyze your brand against numerous competitors. In addition to monitoring this metric, MetricsCart also provides other digital shelf solutions ranging across content compliance, MAP pricing, price monitoring, and more, making it a comprehensive tool for managing your brand’s online presence.

How Can Share of Search Help in Your E-Commerce Brand Positioning?
Share of Search represents 83% of a brand’s market share, according to a study by James Hankins. The metric, when used in its true essence, doesn’t just stop at measuring the brand’s position in the market relative to its competitors. With this metric, you will be able to gather search insights based on geographical availability, product category, and brand name.
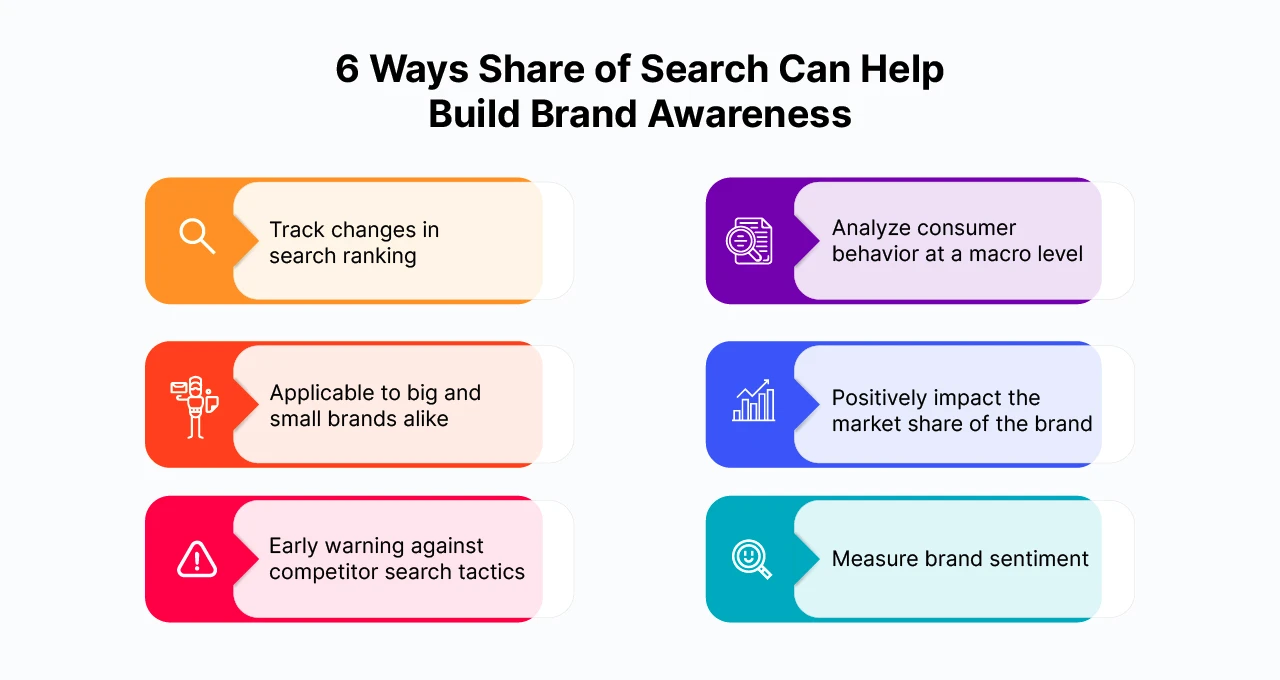
Here are some of the ways in which Share of Search may help in establishing a brand’s online visibility.
41% of Online Shoppers Do Not Go Beyond Page Three
According to Salsify’s 2025 Consumer Research report, 41% of shoppers scroll up to three pages and a considerable 18% of shoppers do not go beyond page one before clicking on a product listing.
Your customer is standing in the cereal aisle at the grocery store, eagerly searching for their favorite brand. But to their disappointment, your competitor’s products have taken prime positions on the shelves, pushing your brand’s product to the back. This scenario is analogous to what happens online when your brand gets overshadowed in search results. Your product may get buried below your competitors, making it difficult for shoppers to find. The only chance of discovery arises when the competitor’s product runs out of stock.
Learning about a competitor brand’s SoS can help identify their hidden tactics in the product detail pages (PDPs). This in turn will help in tweaking your brand’s digital shelf game.
There’s more research to back this; according to a 2019 quasi-experiment on Taobao.com, improving search precision led to a 64.4% increase in GMV, largely because high-ranking products captured greater shopper intent and conversions.
A high Share of Search often signals high mental availability; consumers are thinking of your brand and searching for it. That visibility is what gets you into the cart first and serves as a positioning signal.
READ MORE| Digital Shelf Analytics can unlock your brand’s full potential. Check out Transforming E-Commerce Business with Digital Shelf Analytics to know more.
Share of Search Helps Look Into PDPs That Need an Update
Outdated images. Incomplete product descriptions. Missing sections. All of it calls for improvement.
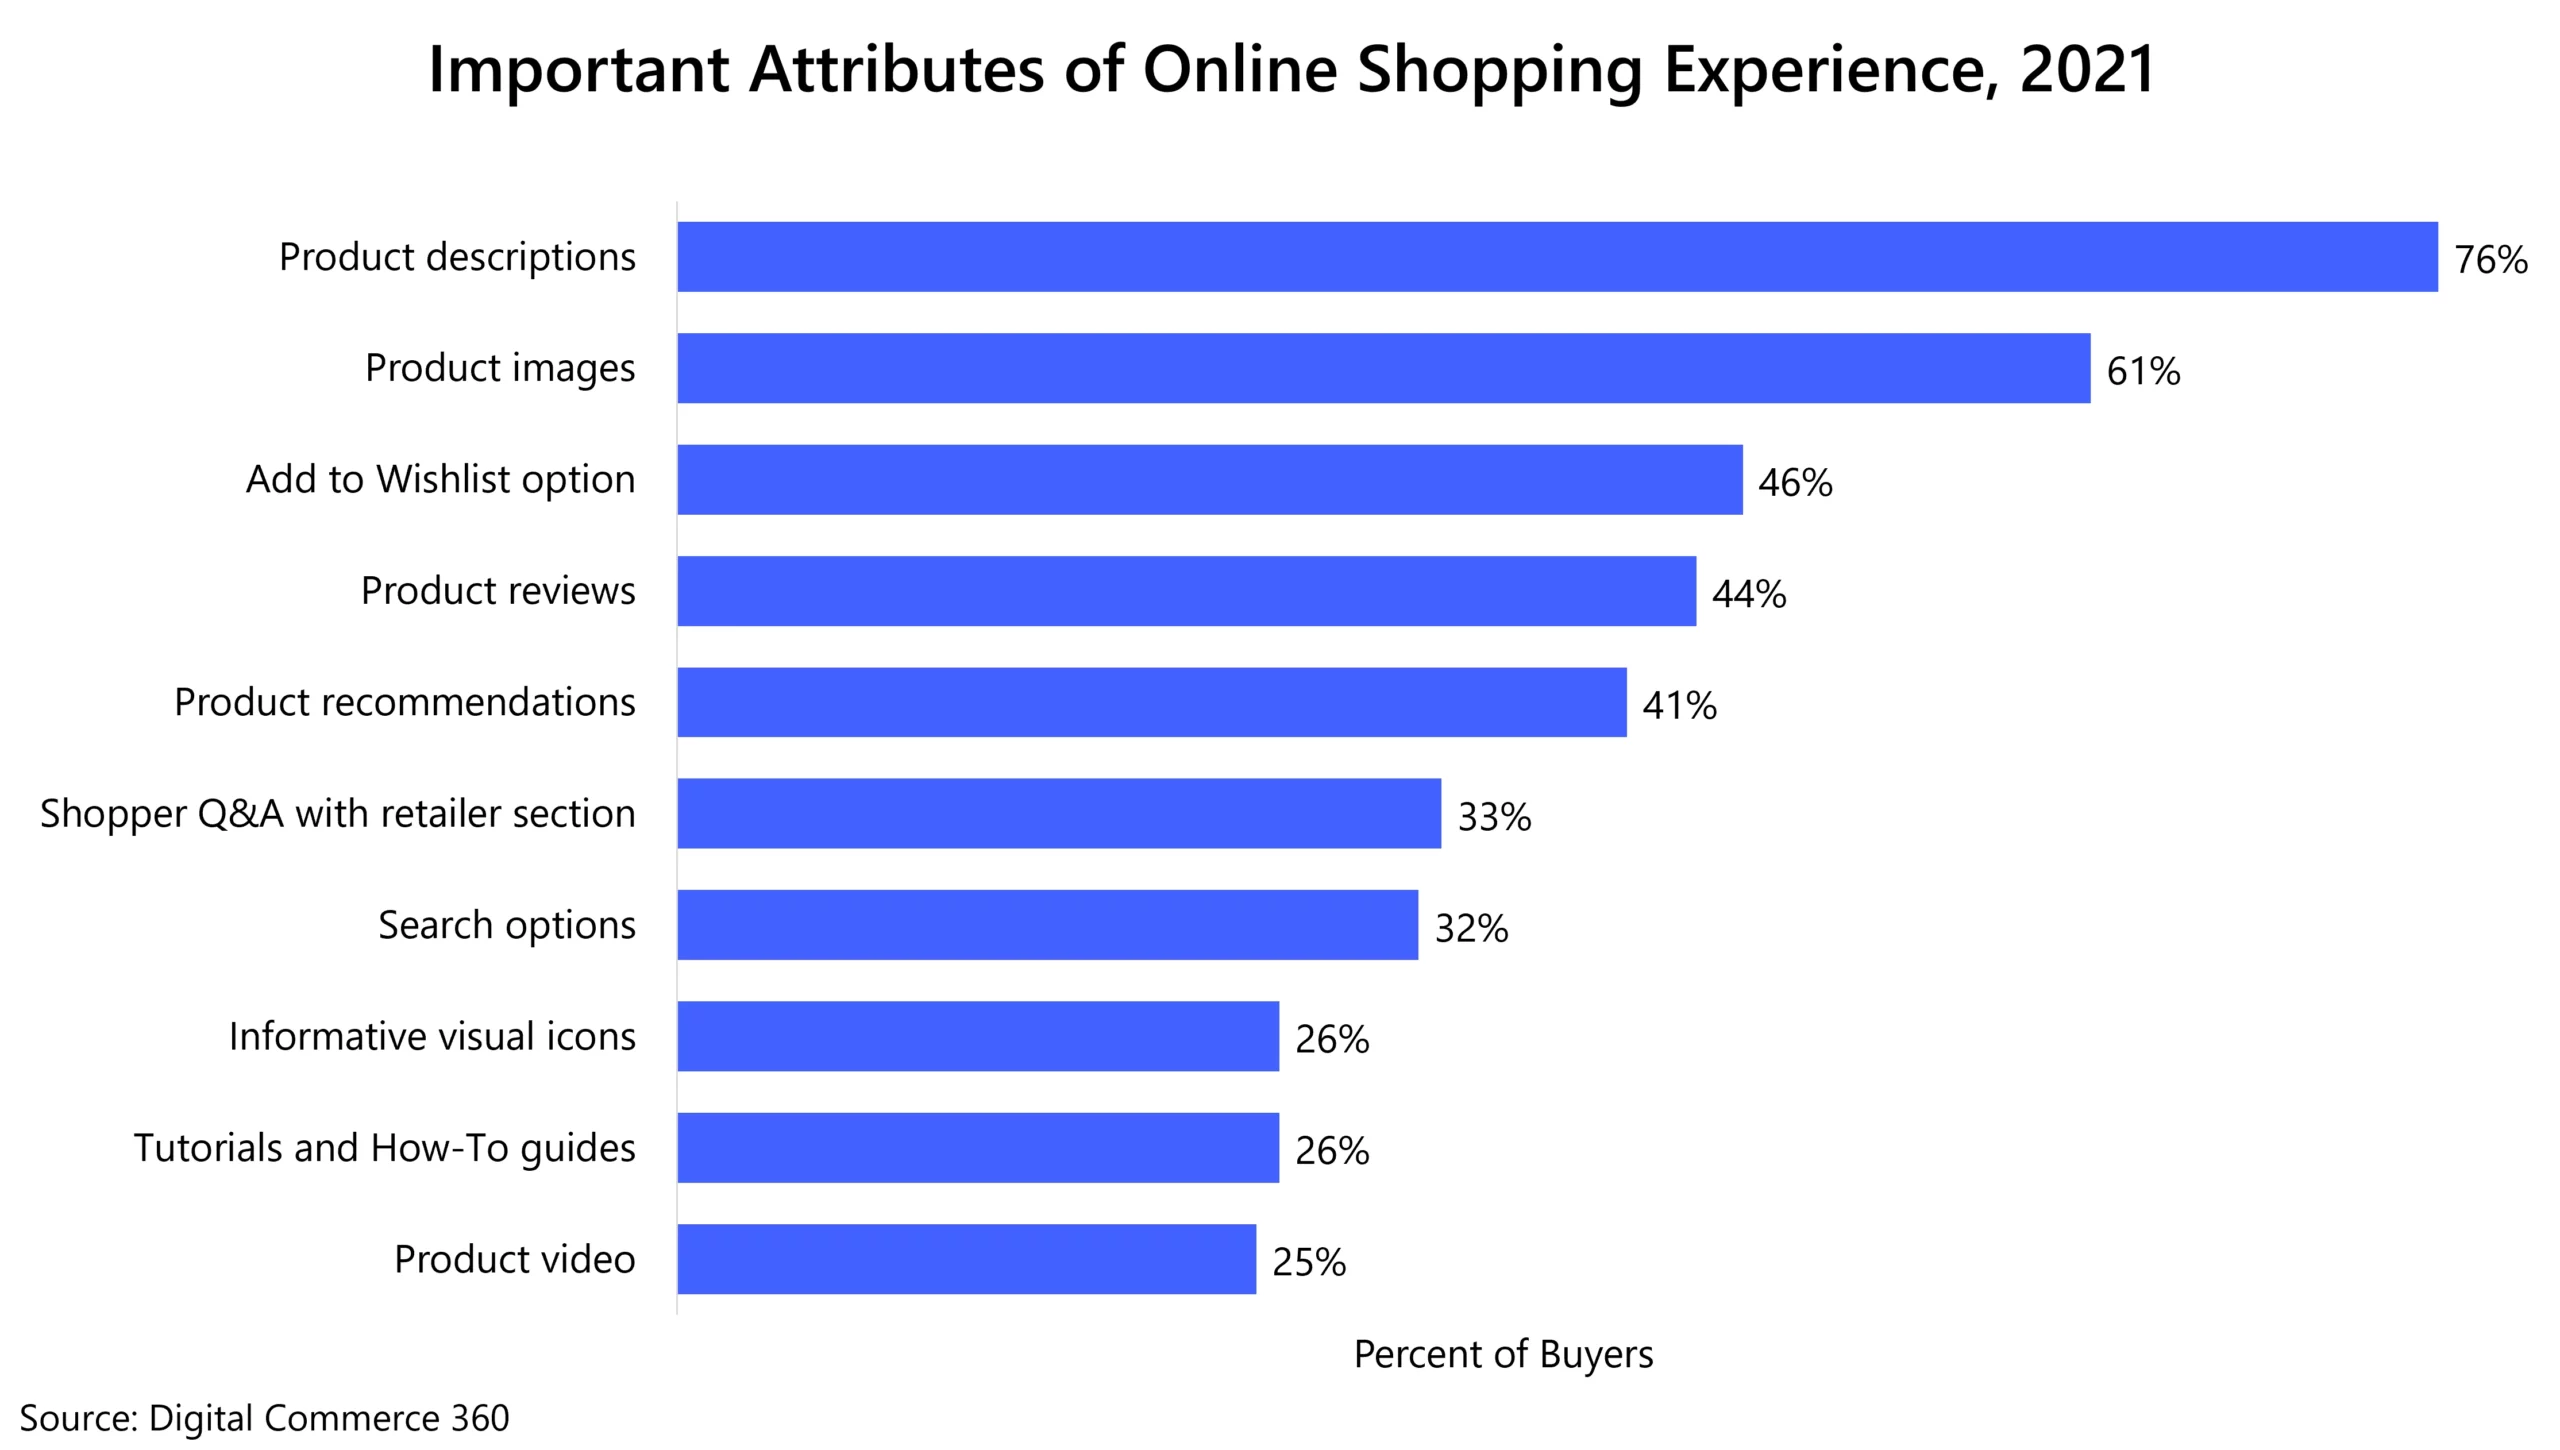
About 85% of shoppers consider detailed product descriptions as a significant attribute of their shopping experience. And 6 in 10 online shoppers want a better product search experience and quicker navigation within retail sites.
Platforms like Amazon and Walmart weigh content quality when ranking products in organic results. Weak PDPs and incomplete product listings can directly pull down your Share of Search on retailer platforms.
Share of Search surfaces gaps in discovery and keyword strategy. For example, if you sell an organic shampoo but don’t appear in searches for ‘organic hair care,’ it may signal missing or misplaced terms in your PDP.
This way, the metric helps zoom into underperforming products and categories.
Brands of All Sizes Can Benefit From Share of Search
Les and James, in their findings, analyzed brand categories with shorter and longer purchase cycles to understand how it impacts purchase decisions. They identified how big, medium and small brands could cost-effectively use this metric.
Smaller brands can use Share of Search as an early signal of brand awareness growth, while larger brands can use it to defend share and benchmark campaign impact.
However, Google Trends has some data gaps when it comes to brands and their categories. It will show great results for smartphones such as Apple, Sony, Motorola, and the like. But when it comes to niche markets such as generators for hire or security firms, data gets ambiguous. Your brand needs a Share of Search solution catering to all sizes.
The key is to tailor your Share of Search tracking to your category and search behavior, using branded and non-branded terms, and pair it with sentiment and traffic data to make it useful across brand sizes.
Share of Search Gets You Ahead on Both, Branded and Non-branded Search Queries
In 2022, HP ran an experiment with Google after seeing a rise in the generic search term “best laptop.” They identified how being present on non-branded search queries had a positive impact on the brand’s key performance indicators (KPIs). There was an 8.2% increase in consideration to purchase among consumers.
The metric will help understand the numbers for different branded and non-branded search queries. This will, in turn, help your brand have coverage across non-branded search in the similar way HP did with ‘best monitors,’ ‘home printers,’ etc.
It is a classic example of how brands can expand their Share of Search by targeting category-level keywords. This ensures your brand isn’t just found when consumers already know you but also when they’re still deciding what to buy. It’s a key tactic to grow Share of Search and claim more consideration early in the customer journey.
Share of Search Data Is Continually Updated
A major benefit of the metric is that, unlike Share of Voice and Share of Market, it is continually updated. This also means your brands need to track SoS regularly. On the other hand, Share of Market i.e. the revenue is only updated quarterly or annually. This is also a great add-on for brands that don’t invest heavily in ads i.e. Share of Voice.
This makes SoS especially useful to track performance week-over-week across seasonal shifts, product launches, or sudden shifts in consumer interest; capturing search demand generated by earned media, influencer buzz, or strong organic content strategies.
It’s a real-time diagnostic lens into what drives visibility, attention, and brand strength on the digital shelf.
The Intersection of AI & Share of Search
As AI transforms search from keyword-based to intent-driven, SoS becomes even more critical; it helps brands measure visibility not just on exact-match terms but across broader, AI-inferred queries and contexts
AI-driven search (like Amazon Rufus or Google’s Search Generative Experience) is changing how consumers find products. They’re using full questions or descriptive phrases, and the engine interprets intent—SoS helps track how well your brand stays visible as this shift unfolds.

In Episode 10 of the Digital Shelf Insider podcast, Kiri Masters, founder of Bobsled Marketing (now Acadia), sheds light on the evolution of retail media, online shopper behavior, and Amazon search optimization. Watch the full episode:
With AI-powered search and even voice search, SoS becomes a proxy for how well your brand is being interpreted and surfaced by retail algorithms, not just matched on keywords.
READ MORE| Another retail KPI you cannot miss out is Share of Shelf! Check out How Share of Shelf is Measured in Retail Stores Using Digital Tools to know more.
Winning Share of Search Using MetricsCart’s Digital Shelf Analytics
Monitoring consumers’ search behavior is an ongoing process. It depends on the stage of the customer journey the consumer is in. Are they looking for solutions? Are they looking for reviews and recommendations? All this impacts sales.
Your brand requires a Share of Search analysis platform supported by a Digital Shelf Analytics (DSA) dashboard. At MetricsCart, we monitor more than four million products. Using our DSA dashboard, you will be able to keep track of search rankings, your brand’s online visibility, real-time pricing, and advertising all in one place. Contact our team to set your brand for success.
Don’t Miss out on Critical Insights To Stay Ahead on the Digital Shelf. Start Tracking With MetricsCart!