Effective share of shelf placement influences consumer behavior, enhances brand recognition, and drives sales.
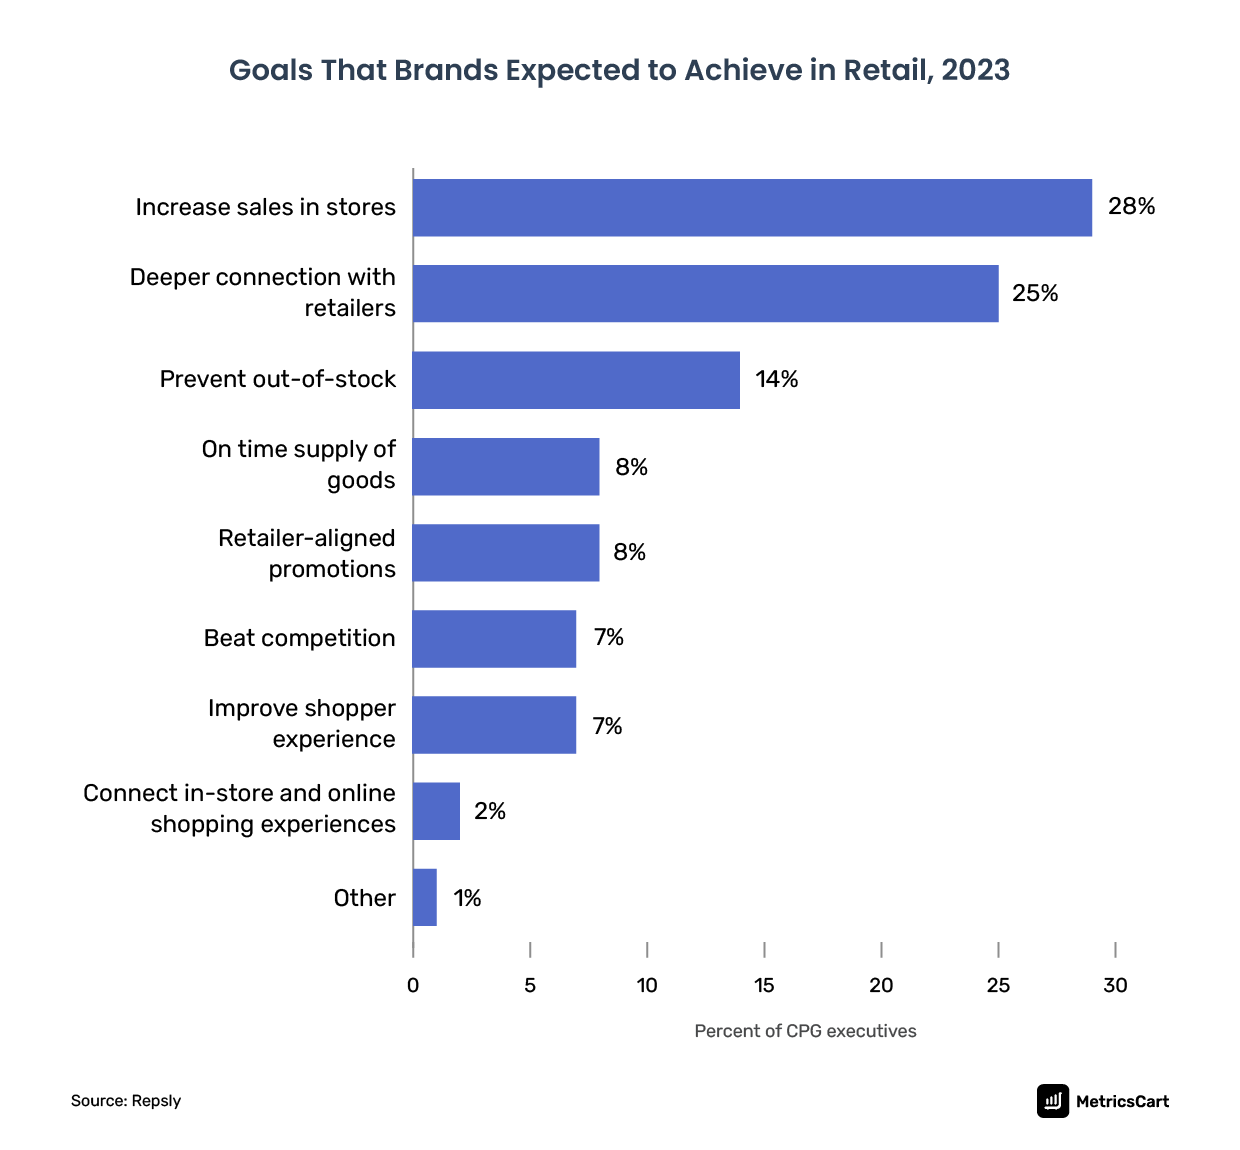
According to Repsly’s 2023 Retail Outlook Report for Consumer Goods Leaders, 29% of CPG executives aimed to increase in-store sales. However, getting a shopper’s attention in-store is more competitive than ever.
Additionally, retailers often reallocate shelf space based on recent sales performance. This gives more share of shelf to best-selling brands over the struggling ones.
Anson Frericks, former executive at Anheuser-Busch InBev, calls share of shelf “the single largest determinant of sales in a store.” He says, “During a busy shopping period on a Friday or Saturday night, consumers pick something else if cold beer is unavailable on the shelf.”
What is Share of Shelf?
Share of Shelf is a KPI measure of the volume and visibility of a brand on retail shelves in comparison to its competitors within a category.
To better understand Share of Shelf, retailers and brands rely on a visual diagram of merchandise placement or layout at stores known as planograms. This helps to compute the Share of Shelf percentage for a brand.
Shelf data when combined with sales data help category managers make informed decisions to:
- A better understanding of the category performance
- Know the status of the on-shelf availability of products
- Gauge the success rate of in-store visibility of a brand
- Assess the cost-benefit of optimizing shelf space
- Infer the effectiveness of various pricing strategies and promotions
- Gain clarity on competitive product performance in all store locations
- Ensure the availability of the right product mix on shelves
Planogram vs. Realogram: What is the Difference?
While a planogram is only the visual representation of the possible layout of items on the shelf, a realogram is the actual layout of the product placement at a given store.
The retailer’s merchandising or marketing team creates the planogram, considering:
- Aesthetics
- Product placement and flows
- Merchandising best practices
- Sales performance
- Number of facings
- Eyesight level
Deciding on a planogram is challenging as the placement of a brand on a retail shelf varies for every demography.
Manual Methods to Monitor Share of Shelf
Typically, brands make all vital store decisions based on the data gathered by field representatives.
Calculate the Product Facings
The number of times a particular item is visible from the front of the shelf is its product facing. Product facings are also known as zoning, blocking, or fronting.
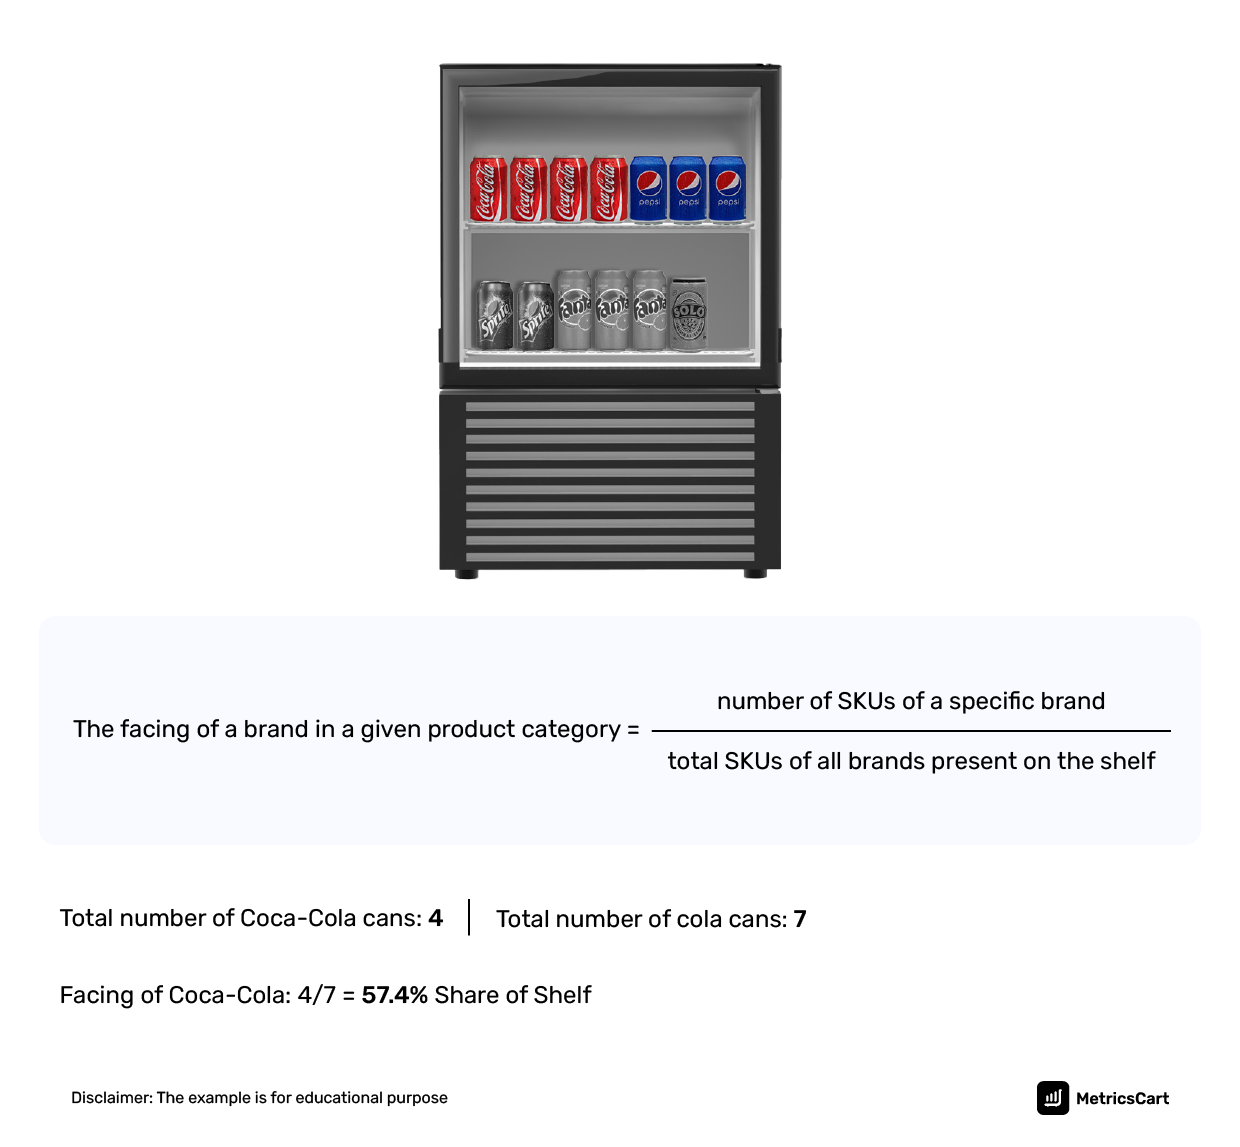
Promotion periods, new product launches, and out-of-stock scenarios impact the calculation of product facings.
Calculate Linear Shelf Space
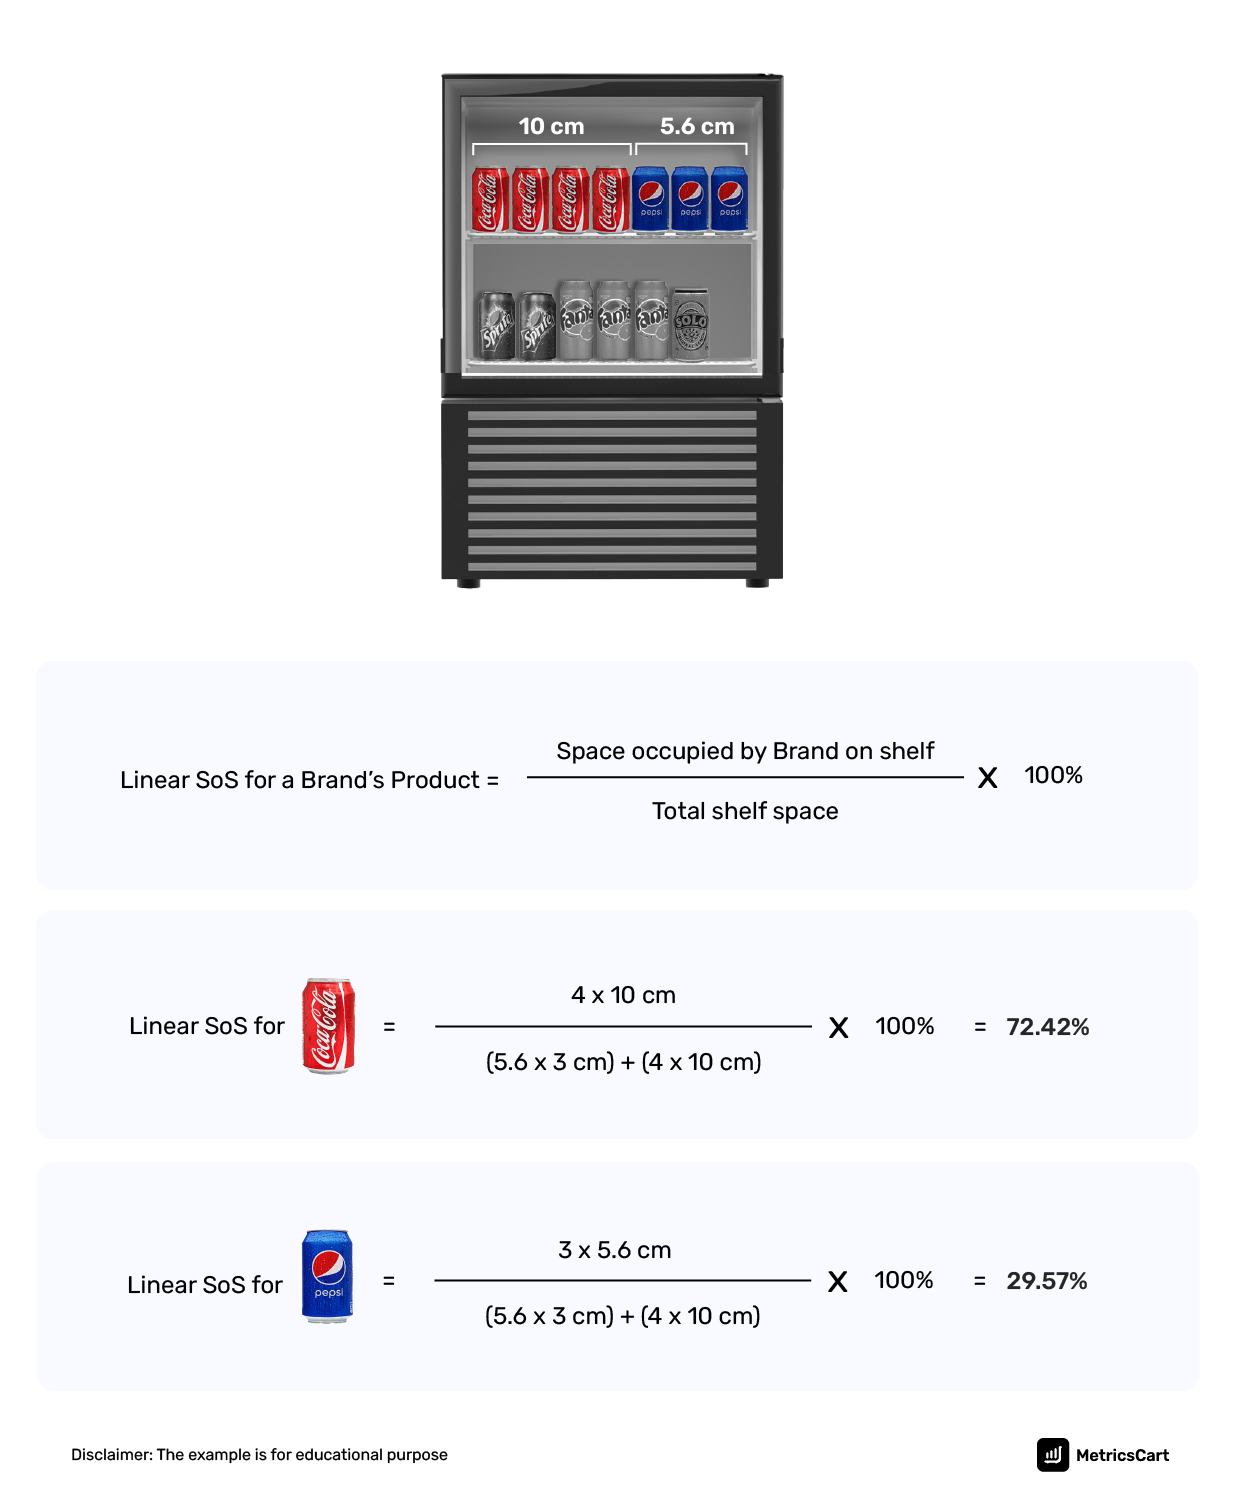
This is a time-consuming method that involves using a measuring tape to compute the linear space occupied by products of a brand on the shelf.
Eyeballing
Using the visual inspection technique of eyeballing, brand representatives take an estimate of the SKUs available on a shelf to decide on replenishment of goods.
The manual process of store auditing is time-consuming and prone to human errors. By using technology, brands receive accurate, timely data to help make dynamic decisions in stores.
Deploying Tech to Optimize Share of Shelf
Technological methods to calculate the share of shelf leverage advanced tools and systems, often utilizing computer vision, image recognition, and data analytics.
Image Recognition and Object Detection Technology
Image recognition and object detection help CPG brands digitize store checks to get consistent results from all the sales channels. Combining IoT and AI, image recognition interprets the visual shelf images to identify trends and derive insights.
Moreover, depending on the aisle size, retailers choose the apt image recognition technique.
- If the aisle is narrow, they install shelf cameras that can be programmed with planogram compliance.
- If the aisle is wider, cam-equipped robots are deployed.
RFID Tags
When RFID tags are present on product packages, field representatives or storekeepers capture the on-hand count of the products on a shelf using RFID scanners. Brands gain a real-time view of each SKU, its location, and expiration date, and if required, even stock levels can be tracked.
For instance, Pepsi Co. uses an RFID-enabled iGPS pallet tagging system that brings transparency to its entire distribution from the plant to the shelf.
Read more on Webrooming and Showrooming: Shopping Trends Retailers Shouldn’t Ignore
How In-Store Visibility Improve CPG Sales?
A successful retail execution can lead to a 3-5% increase in sales in a single category for consumer goods brands. Brands implementing a shopper marketing strategy personalized to stores in a geographical is the newest way to capture potential shoppers.
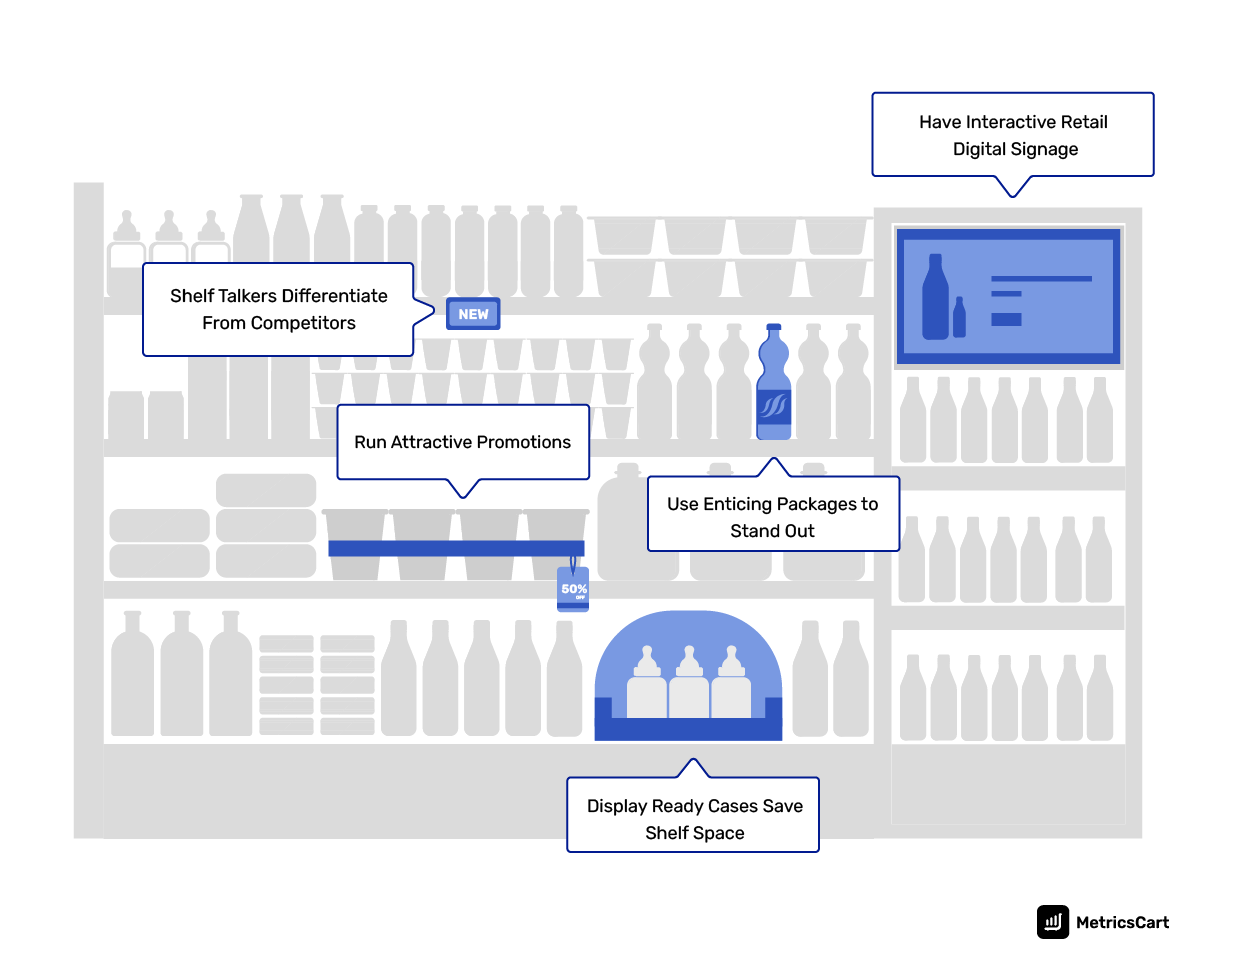
There are 5 Techniques Brands Use to Attract Customers at the Shelf Level
- Using Shelf Talkers to Differentiate from Competitors
- Enticing Customers With Labels and Packages That Stand Out
- Running Attractive Promotions in stores
- Interacting with Customers Using Retail Digital Signage
- Saving Shelf Space With Display-Ready Cases
Using Shelf Talkers For Competitive Advantage
Brands use several creative types of shelf talkers like podiums, frames, shelf trays, LED lights, screens, wobblers, etc. It is usually fixed vertically on the retail shelves to attract shoppers.
Some of the benefits of shelf talkers include:
- Intercept customers scanning the shelves
- Highlight offers or key features that stand out from competitor brands
- Tempt consumers to add the product to the cart with product information
Enticing Customers With Shelf Placement and Product Packaging
A study done by Raymond Burke of Indiana University showed that product visibility improved by 27% when the retail shelves were tilted at a 15° angle. Color block pattern is another eye-catching technique to pull shoppers browsing shelves.
Read more: How Consumer Behavior Influences Online CPG Sales
Running Promotions in Stores
Engaging customers on the shelf with a well-executed promotion can create a buzz in the market.
For example, the sweepstakes promotion by Blue Diamond, where the shopper has to buy the product and post the proof on social media with a hashtag for a chance to win was a big success.
With this promotion, the brand impressions on social media went up and so did the sales.
Interacting with Customers Using Retail Digital Signage
By strategically deploying retail digital signage or eShelfs across high-traffic aisles, L’Oréal creates unique shopping experiences.
Through visually engaging displays, the company broadcasts promotions to enhance consumer interactions with its products. Moreover, the company directly influences customers’ buying habits by controlling the screen remotely.
Saving Shelf Space With Display-Ready Cases
In response to the growing commodity prices, consumers are looking at smarter ways to manage expenses. As a result, brands are now offering a product mix that has the best value-to-quality ratio. This aids in having more products in the fresh refrigerated category on retail shelves.
For instance, Dannon, the dairy food company, took the following steps:
- Introduced smaller package sizes to better align with consumer preferences
- Created display-ready cases that are compact and easy to put on shelves and easy for customers to pick up
Share of Shelf vs. Share of Digital Shelf
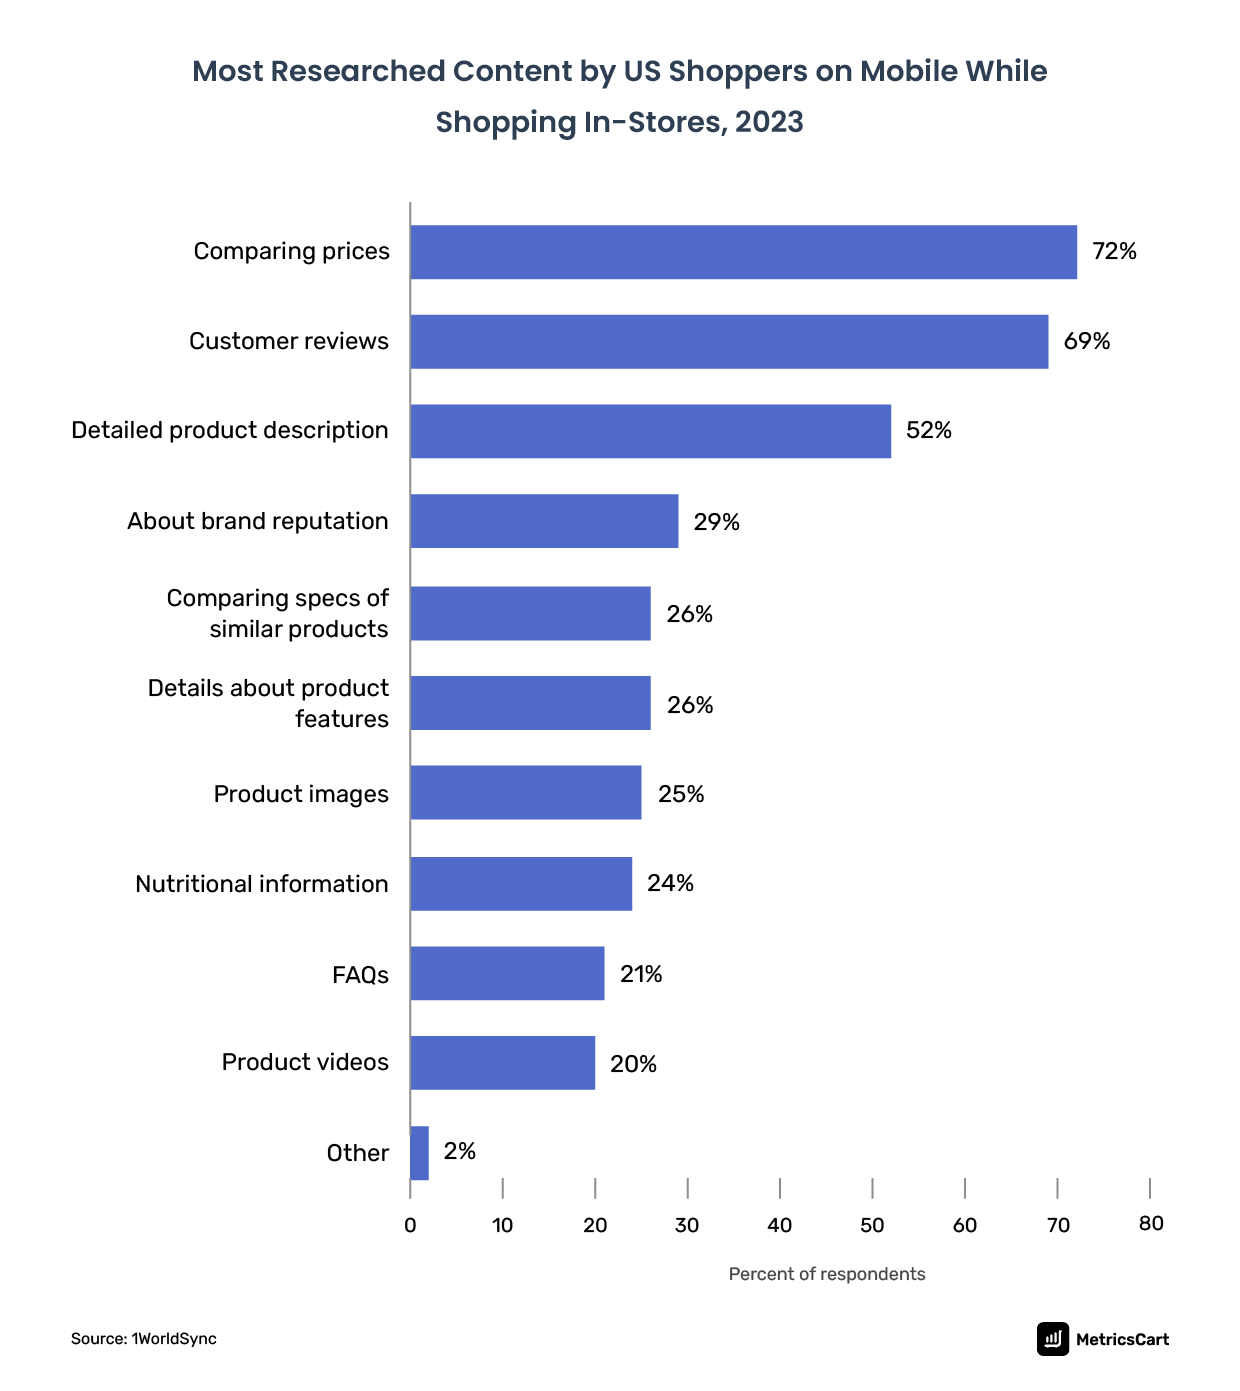
According to 1WorldSync’s Consumer Product Content Benchmark study, 72% of shoppers do price comparisons online while shopping in-store. Digital shelf is the online equivalent of the eye level in a physical store.
To enhance the in-store marketing and shopping experience, omnichannel retailers such as Walmart started using SES-imagotag’s Vusion platform in 2023.
Changing price shelf labels in stores is one of the time-intensive jobs in retail stores. The big box retailer experienced positive results after it automated electronic shelf labels and managed store inventory with digital tags in nearly 500 of its physical stores.
In 2024, Walmart is leaning on generative AI and AR tools to create a unified retail experience across its online and offline stores. By investing in technology, Walmart aims to compete with Amazon and meet the precise intent of shoppers.
As digitally influenced sales strengthen, there is a higher probability of a shopper exploring those brands online that have a customer-centric approach when managing their share of shelf.

