There is an uncomfortable reality that most e-commerce directors in the CPG space discuss only behind closed doors: winning the Amazon Bestseller badge can silently destroy a brand’s price health.
E-commerce leaders often spend months optimizing listings, balancing supply chain constraints, and funneling ad spend to hit the top spot in the Amazon beverage category. However, scaling high-velocity multipacks (12-packs and 24-packs) triggers an immediate, invisible target for arbitrage merchants.
Because liquid is heavy, expensive to transport, and operates on tight per-unit margins, third-party (3P) sellers deploy automated repricing tools to target high-ranking ASINs. These unauthorized sellers source from regional liquidators, clearouts, or cross-border distribution gaps.
Since Amazon’s Buy Box algorithm treats identical UPCs similarly regardless of origin, rogue merchants hijack high-performing listings, undercut price points by pennies, and fracture the Buy Box.
To measure the real-time impact of gray-market distribution, MetricsCart tracked three best-selling beverage brands on Amazon across a 29-day monitoring period using our MAP Compliance and Buy Box report.
Note: Because Minimum Advertised Price (MAP) policies are generally private legal and commercial parameters, this analysis uses publicly available MSRP (Manufacturer’s Suggested Retail Price) as the baseline for measuring price variance.
Why Price Health Matters for Beverage Brands on Amazon?
For beverage brands, monitoring the digital shelf cannot stop at sales, rankings, or Buy Box ownership. A product may appear healthy on the surface while underlying seller activity signals growing pricing risk.
Three metrics are particularly important:
- Buy Box Distribution: Who is actually winning the customer transaction?
- Seller Density: How many sellers are competing for the same ASIN?
- Price Erosion: How far is the selling price moving below the brand’s retail benchmark?
When these metrics move in the wrong direction simultaneously, brands can face margin pressure, inconsistent pricing, and weaker control over their digital shelf.
The following three examples illustrate why.
READ MORE | MetricsCart Launches MAP Compliance & Buy Box Report for Brands
Monster Energy: Seller Fragmentation Can Undermine a High-Velocity ASIN
Monster Energy has enormous consumer demand, making its high-velocity products attractive targets for third-party sellers. One example is the Java Monster Mean Bean Coffee Energy Drink 12-pack.
According to the MetricsCart MAP Compliance and Buy Box report, the retail price for this ASIN fluctuated dramatically over the 29-day tracking period, ranging from $25.68 to $42.55.
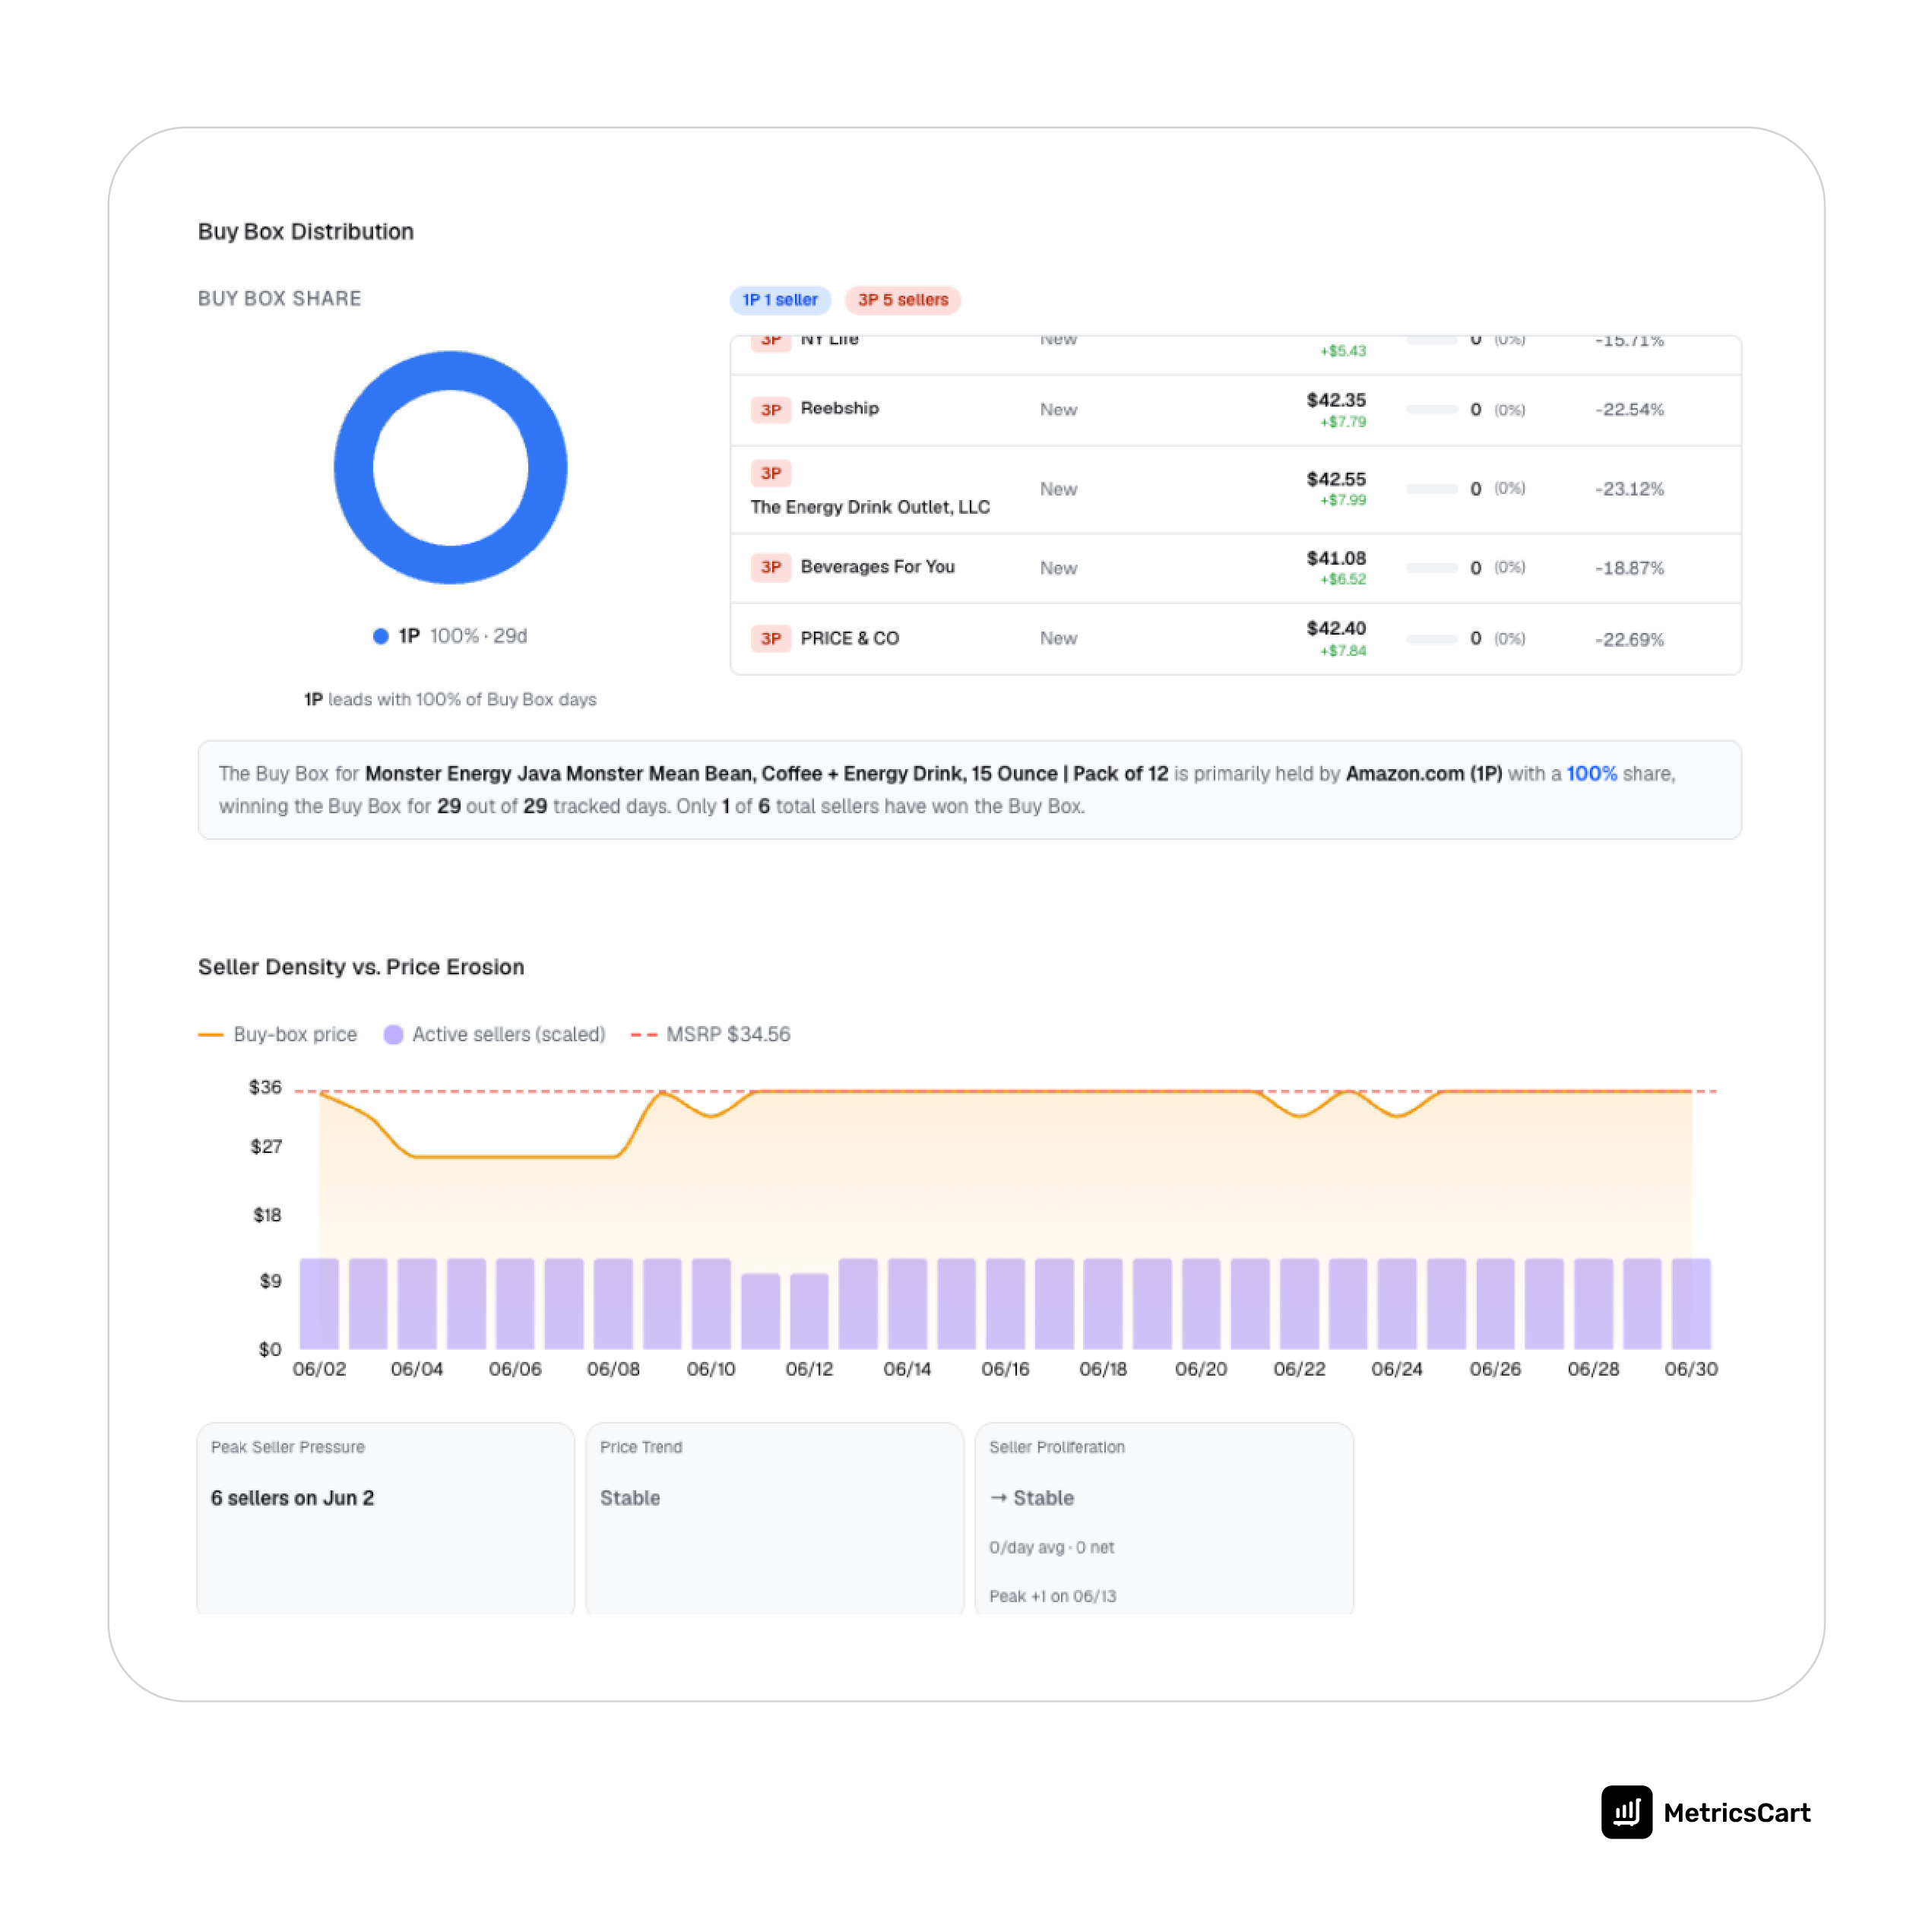
That level of volatility matters because price is only one part of the problem. A growing number of sellers can create a fragmented marketplace in which the Buy Box moves between different sellers and pricing strategies.
For an e-commerce or omnichannel leader, this can have a downstream impact on retail media efficiency. A brand may invest heavily in driving traffic to a product listing, only for the resulting transaction to be captured by a third-party seller.
The takeaway: High sales velocity can attract seller activity, creating pricing instability. Monitoring the number of sellers competing on an ASIN can therefore serve as an early warning signal of deteriorating price health.
View the full Monster Energy price health report.
Alani Nu: Trending Products Can Experience Rapid Price Erosion
Alani Nu has built a strong position in the functional beverage market by combining relevant flavors, wellness positioning, and strong consumer demand. But high consumer interest can also create opportunities for sellers looking to capitalize on demand spikes.
Our analysis of the Alani Nu Pink Slush 12-pack shows how quickly pricing can shift. Over the 29-day tracking period, the product moved from a peak price of $32.99 to a low of $24.16. That represents a substantial gap between the observed high and low selling prices.
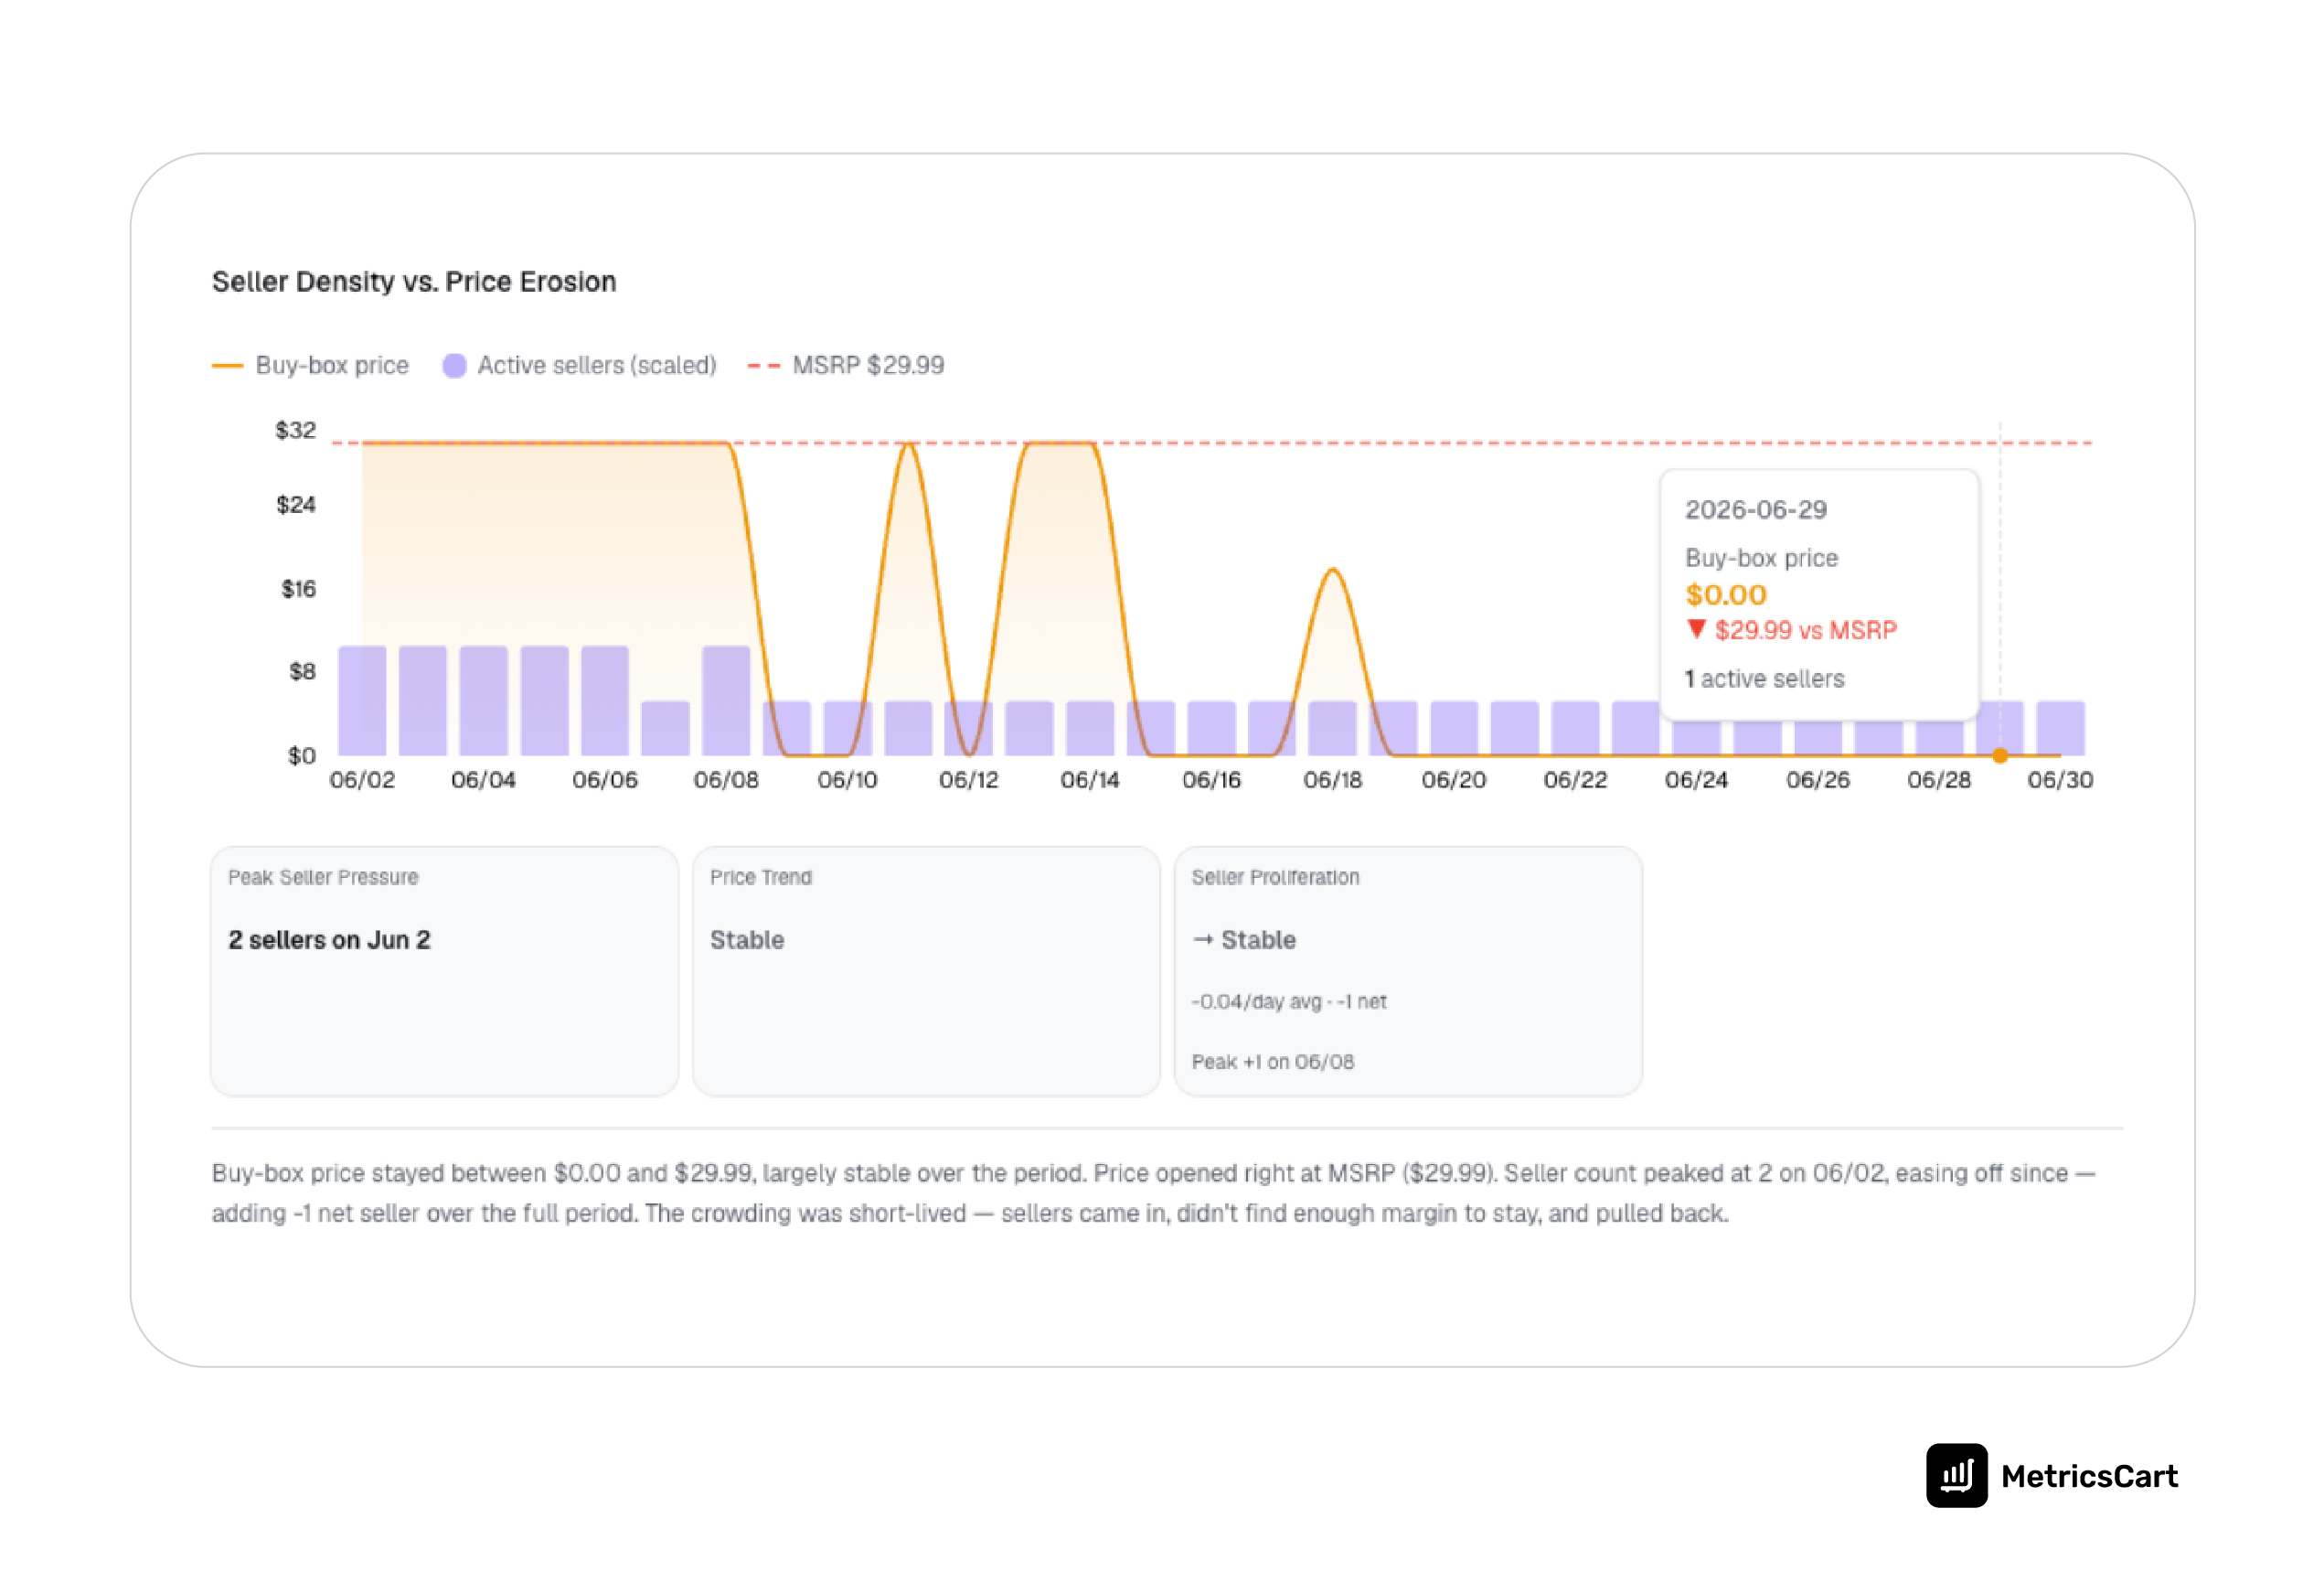
For premium beverage brands, this type of movement deserves attention beyond the immediate revenue impact. Repeated price reductions can weaken consumers’ perception of the product’s expected price and put pressure on authorized retail partners attempting to maintain consistent pricing.
This is where the velocity of price erosion becomes particularly useful.
Rather than asking only whether a product is below its pricing benchmark, brands should also ask:
- How quickly is the price moving downward?
- How frequently are price drops occurring?
- Which sellers are responsible?
- Is the same pattern appearing across other retailers?
The takeaway: For trending beverage products, rapid seller-driven price changes can become a leading indicator of broader pricing instability.
View the complete Alani Nu price health report.
Core Power: Winning the Buy Box Doesn’t Always Mean Winning on Price
Core Power presents a different kind of pricing challenge. During the 29-day tracking period, Amazon 1P maintained 100% Buy Box share for the tracked Core Power protein shake listing.
At first glance, that looks like an ideal digital shelf outcome. But seller density tells a different story.
The listing had 35 third-party sellers competing on the ASIN. While those sellers did not capture any Buy Box share during the period, their presence coincided with the product’s price floor falling to $36.75, compared with an MSRP baseline of $45.59.
That’s a 19.39% erosion from MSRP.
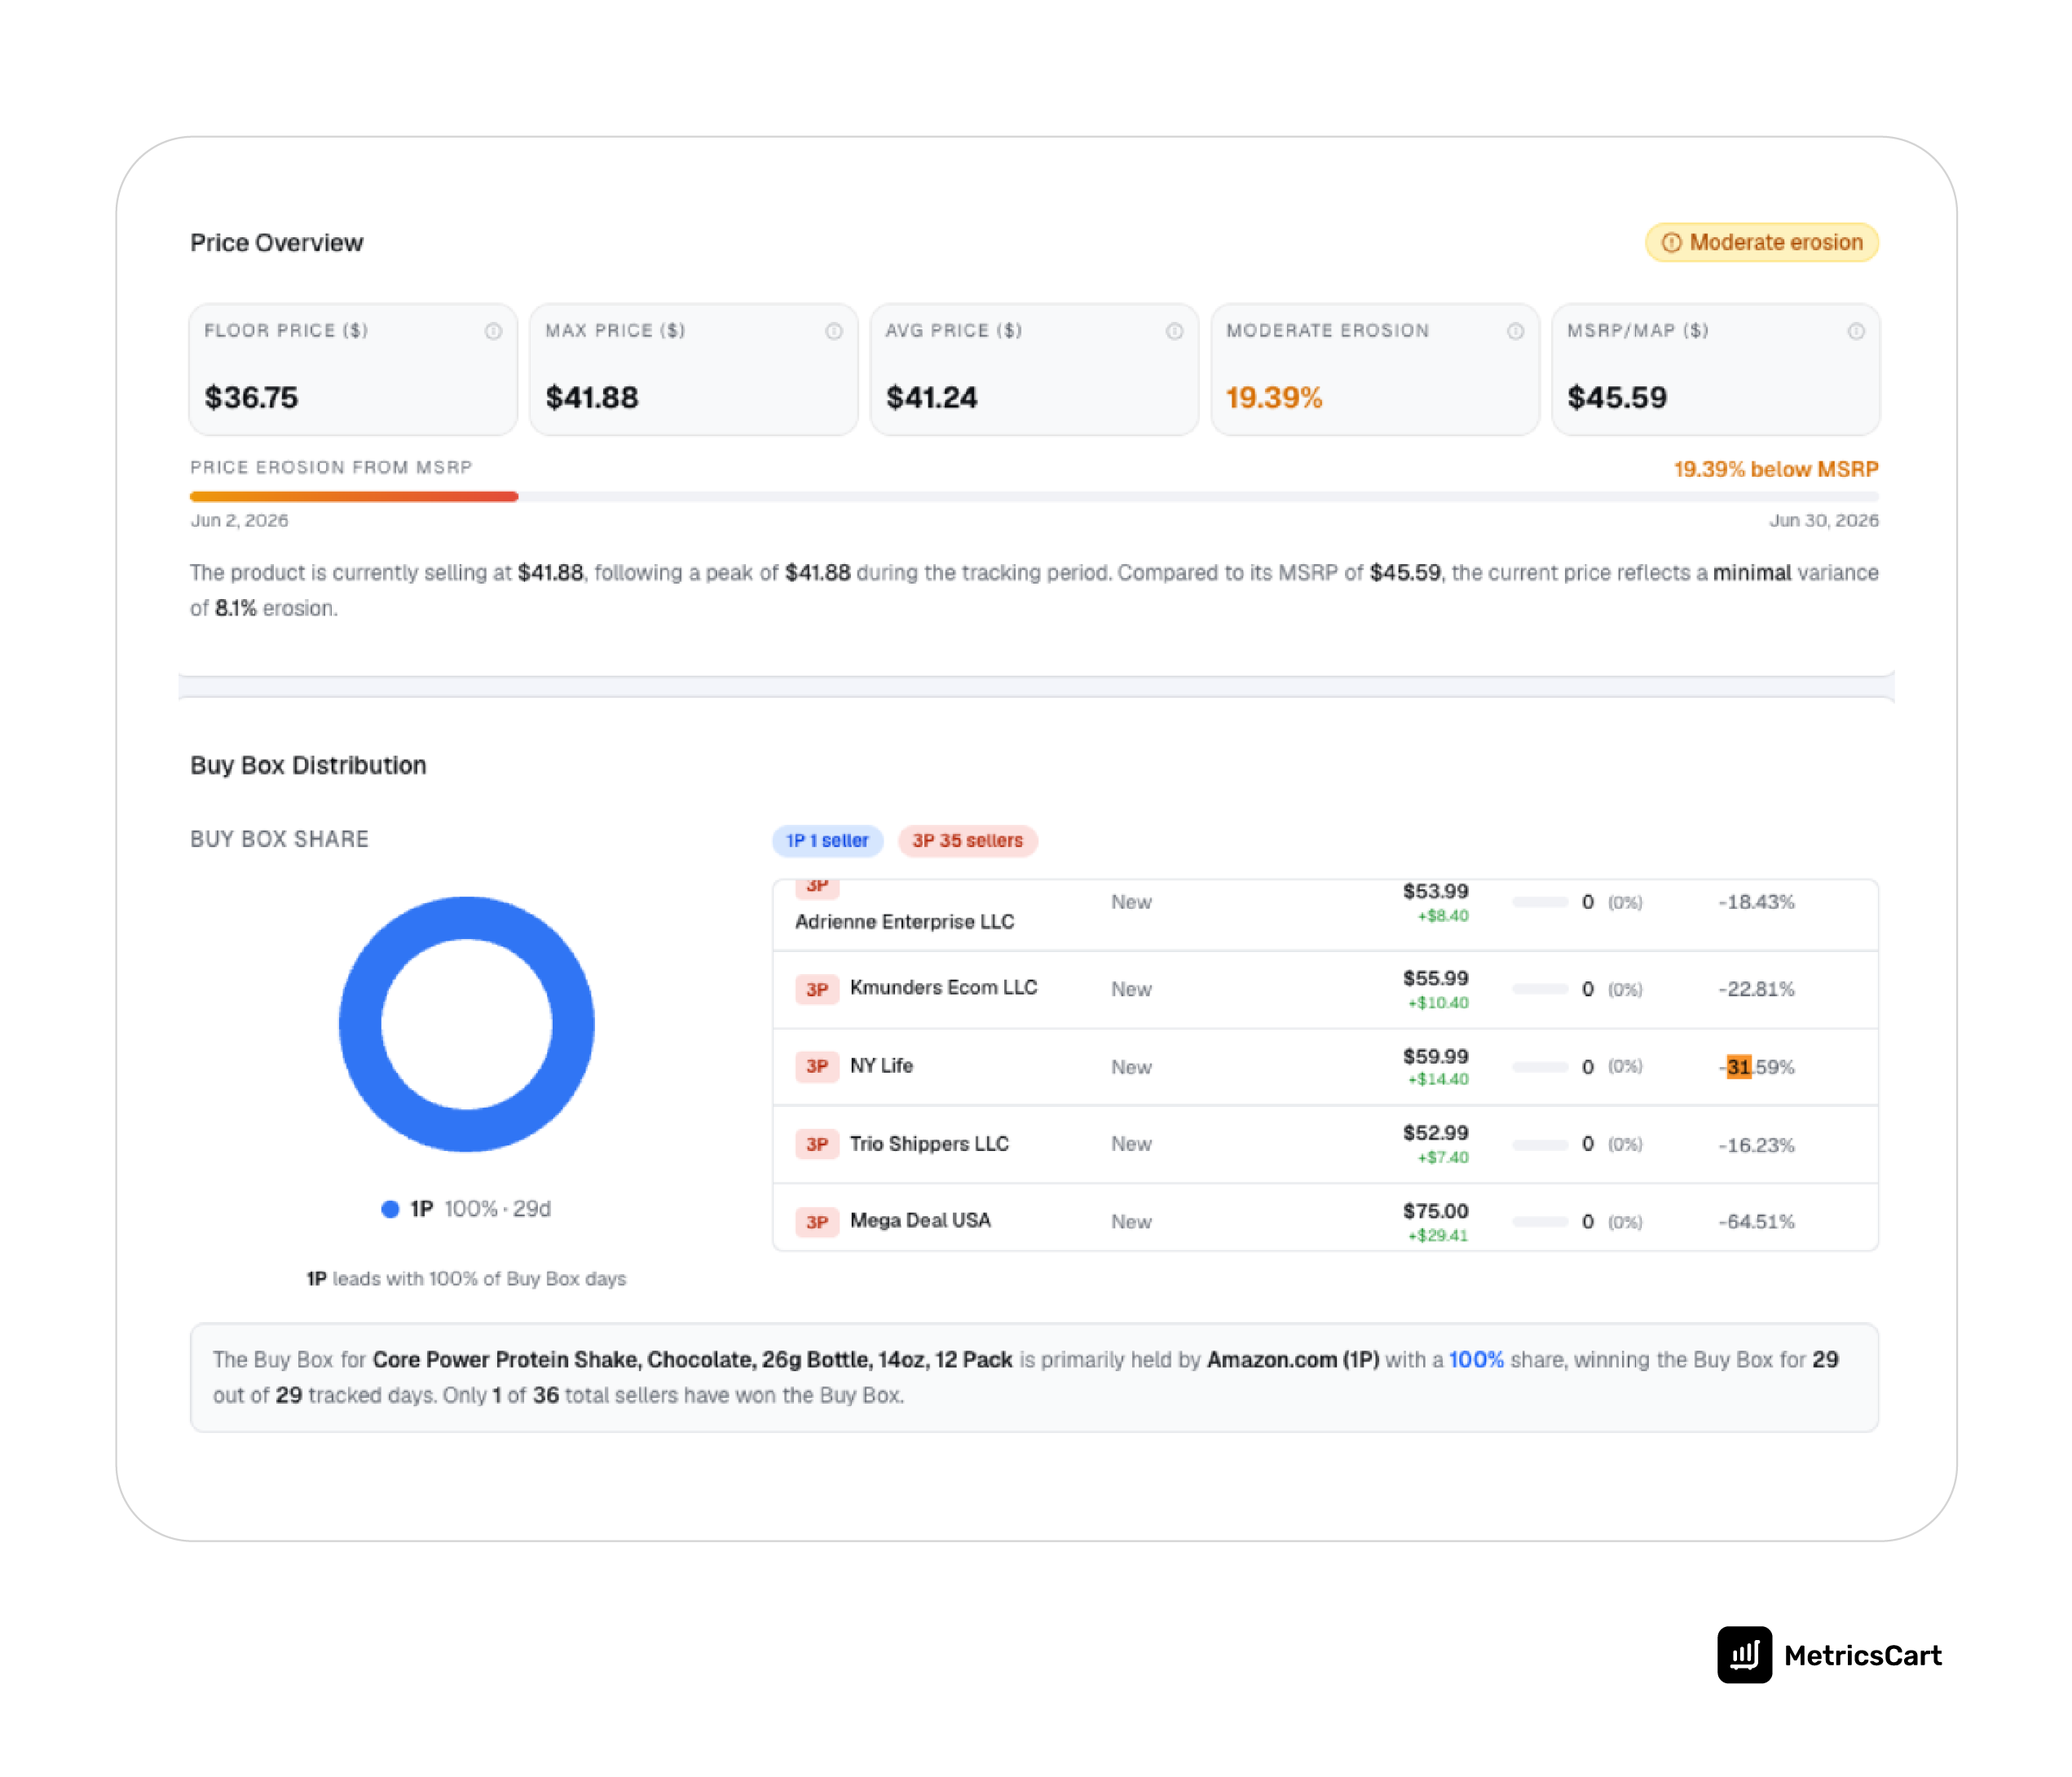
For a beverage product with significant physical shipping costs and potentially tight unit economics, a nearly 20% gap between the retail benchmark and the observed price floor is worth monitoring even when Amazon retains complete Buy Box ownership.
This highlights an important distinction:
Buy Box health and price health are not the same thing.
A brand can maintain excellent Buy Box performance while still experiencing signals of marketplace instability underneath the surface.
The takeaway: Buy Box share should always be evaluated alongside seller density and price variance. Looking at one metric in isolation can create a misleading picture of digital shelf health.
View the full Core Power price health report.
What the Best-Selling Beverage Brands on Amazon Should Monitor
For best-selling beverage brands on Amazon, the objective shouldn’t simply be to identify pricing violations after they happen. The goal should be to identify the signals that precede pricing becoming a larger commercial problem.
Here are three metrics ecommerce and omnichannel teams should monitor regularly.
1. Buy Box Distribution
Who is winning the Buy Box and how consistently?
If an authorized seller or Amazon 1P account is expected to own the customer transaction, sudden changes in Buy Box distribution can signal growing marketplace disruption.
2. Seller Density Velocity
A high seller count isn’t automatically a problem. The change in seller count can be more informative. A sudden increase in the number of sellers on a high-velocity ASIN can indicate that a product is attracting arbitrage activity, unauthorized distribution, or aggressive repricing.
Tracking seller density over time helps brands identify these changes before they become a sustained price problem.
3. MAP Violation and Price Erosion Trends
A single pricing violation may not tell the full story. Brands should look for patterns:
- Is the number of violations increasing?
- Are prices consistently falling below the benchmark?
- Which sellers are repeatedly responsible?
- Is price erosion spreading across SKUs?
- Are similar violations appearing on Walmart, Target, or other digital shelves?
A cross-retailer view is particularly important because pricing problems rarely remain isolated to one marketplace.
READ MORE | Why Beverage Marketers Are Tracking the Wrong Metrics (And the Data They Should Monitor Instead)
Expanding Digital Shelf Intelligence Across Beverage and Wellness Brands
MetricsCart’s MAP Compliance and Buy Box report can be used to monitor pricing and seller activity across a growing range of performance, functional, and wellness brands, including:
Orgain, Muscle Milk, Premier Protein, Bloom Nutrition, Labrada Leanbody, Frog Fuel, Gatorade Dominicana, BUM Energy, Slate Milk, BODYARMOR Sports Nutrition, Garden of Life, Optimum Nutrition, SlimFast, and OWYN.
For brands operating across Amazon and other major digital retailers, this type of continuous monitoring provides a more complete view of pricing health, seller behavior, and Buy Box performance.
The Bottom Line for Amazon Beverage Brands
The most successful Amazon beverage brands aren’t just monitoring how much they sell.
They’re monitoring who is selling, at what price, and how those variables are changing over time.
Because a product can rank #1, own the Buy Box, and generate strong demand—while its price health is quietly deteriorating underneath the surface.
The brands that identify those signals early have a better opportunity to protect margins, maintain channel relationships, and defend their digital shelf.
Want to see what price health looks like across your own portfolio?