Highlights
- Amazon Basics leads the Amazon health and beauty category with 55 bestseller listings at an average price of just $9, validating the private label playbook of high SKU volume paired with aggressive pricing.
- Average ratings lock in at 4.6 across every single month of the year. MetricsCart’s analysis confirms that strong ratings are a baseline entry requirement, not a competitive differentiator, on Amazon’s beauty bestseller list.
- March is the peak pricing month at an average of $16.0, while September crashes to the year’s lowest at $6.3, a nearly 60% swing that maps directly to promotional cycles, Prime Day preparation, and post-event inventory corrections.
- Hero products consistently beat large catalogs: Mighty Patch ranked #2 in the Amazon health and beauty top products with just two SKUs, proving that focused category ownership outperforms assortment breadth.
- January drives the year’s largest surge in new bestseller entries (466 products), fueled by post-holiday demand resets and New Year wellness purchase behavior, the single highest-opportunity window for new entrants.
- Premium and budget brands co-exist across the Amazon beauty best sellers list, but neither price extreme alone guarantees ranking; conversion velocity, review strength, and product-market fit are the real drivers of sustained bestseller status.
About This Report
MetricsCart’s Amazon Health & Beauty Bestsellers report provides an in-depth annual analysis of the 1,610 top-performing products across 446 brands in the category on Amazon from January 1, 2025, to December 31, 2025.
Leveraging insights from MetricsCart’s digital shelf analytics solution, this report highlights the leading brands, pricing trends, and consumer behavior driving the category’s growth. This will help category and e-commerce managers in similar industries identify actionable opportunities for brands to optimize their Amazon presence in 2026.
Introduction
The health and beauty category continues to be one of the most dynamic and competitive segments in e-commerce. Globally, beauty alone is projected to reach a $590 billion market by 2030, with consistent growth driven by innovation, premiumization, and expanding online penetration.
On Amazon specifically, beauty and personal care remain one of the fastest-growing and most profitable categories, fueled by a vast product assortment, competitive pricing, the rise of third-party sellers competing directly with brand-owned storefronts, and a consumer base that is simultaneously more informed and more price-sensitive than ever before.
These forces create a unique competitive pressure that MetricsCart’s research tracks across every dimension of the digital shelf.
One of the most consequential shifts our analysis identifies is the redefinition of “premium.” Shoppers in 2025 are no longer loyal to price tiers; they mix a $4 facial wipe with a $16 biocellulose mask in the same basket, guided by perceived efficacy and review credibility rather than brand legacy.
This behavior has fundamentally disrupted how brands earn and sustain visibility among Amazon health and beauty top products.
What follows is MetricsCart’s full breakdown of who is winning, why pricing fluctuates so dramatically across the year, what the relationship between price and rank actually tells us, and where new product opportunities are concentrated.
Who Dominates Amazon Health & Beauty? Beauty Brands, Household Giants & Rising Challengers
The Amazon Health & Beauty bestseller category reflects a broad yet competitive landscape, with 179 top products across 78 brands appearing in the top 10. This indicates that while many brands can enter the space, visibility is distributed across a wide but selective set of players.
The average price of $11.5 highlights a strong mass-premium positioning, where products are affordable enough for frequent purchase while still delivering perceived value.
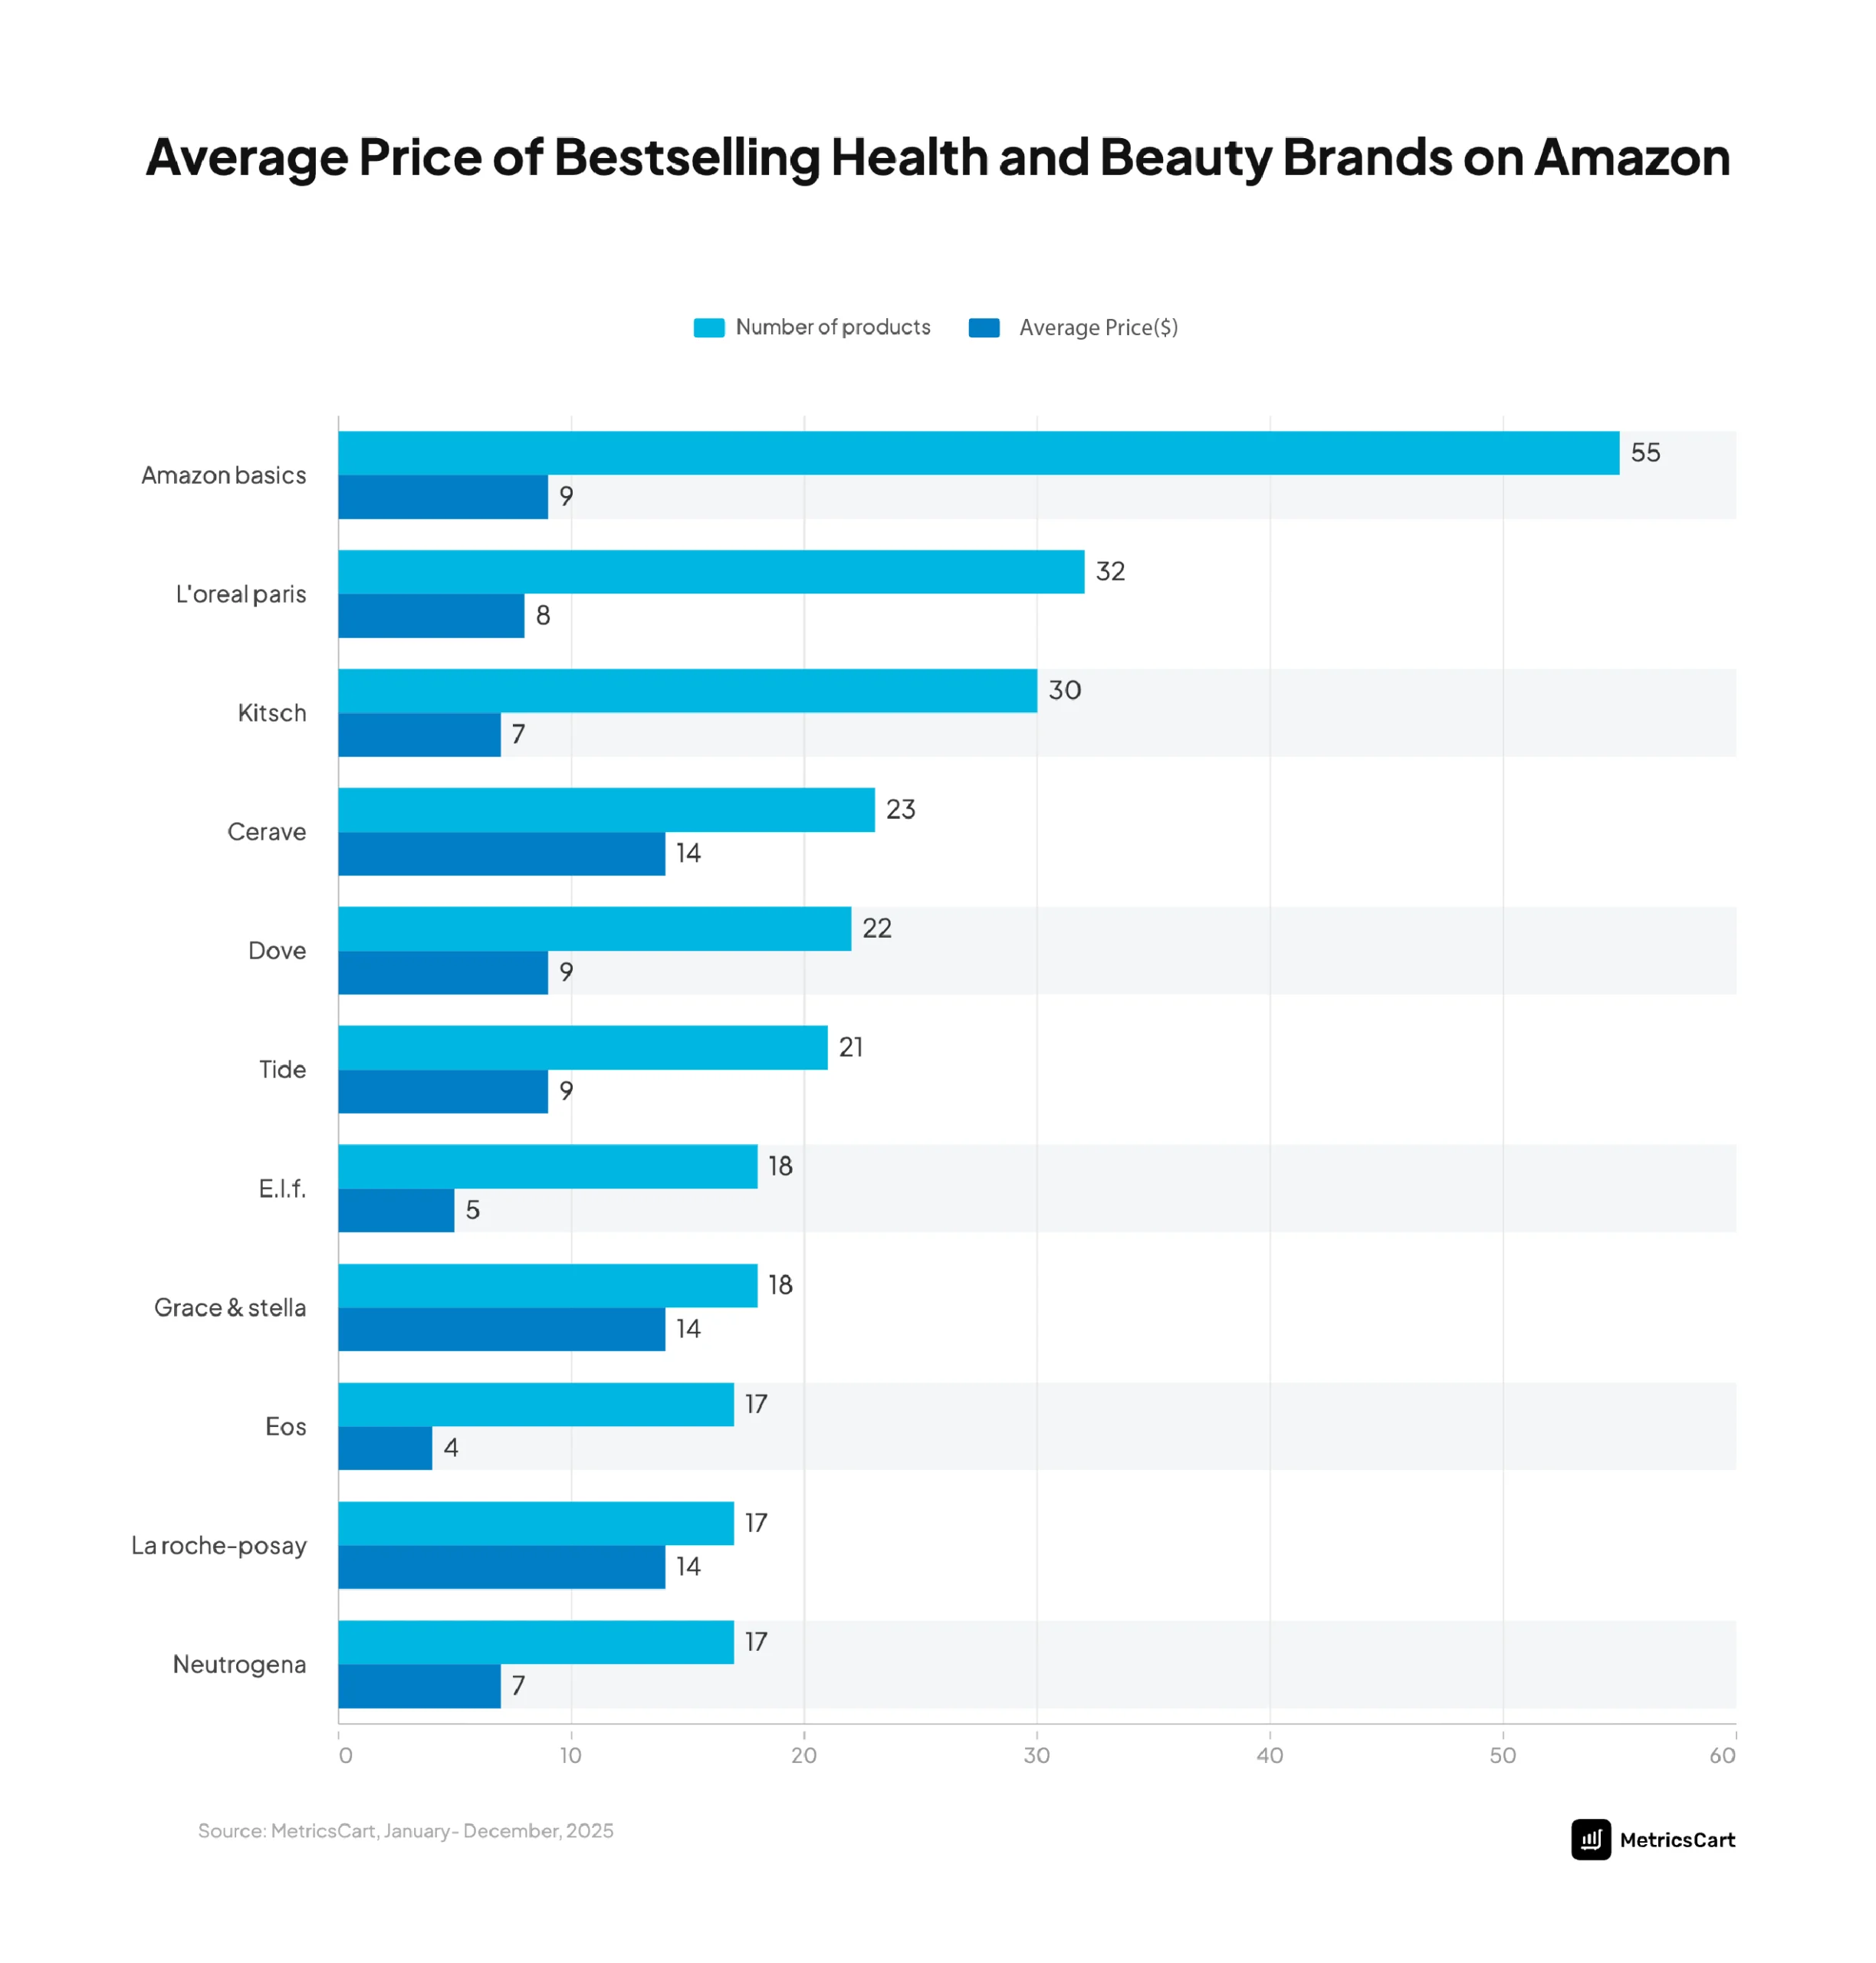
products, while maintaining one of the lowest average price points at $9. This underscores the strength of Amazon’s private label playbook: high SKU proliferation combined with aggressive pricing.
In addition, legacy beauty and personal care brands such as L’Oréal Paris and Dove occupy a balanced middle ground. With a relatively broad product assortment and accessible pricing, these brands leverage decades of consumer trust while adapting to digital shelf dynamics.
In contrast, premium skincare players like CeraVe, La Roche-Posay, and Grace & Stella demonstrate a different path to success. These brands operate with higher average price points and a more focused product portfolio, prioritizing quality perception and efficacy over scale.
Their presence among bestsellers indicates that Amazon’s marketplace can sustain premium positioning, provided it is supported by strong review signals, repeat purchase behavior, and clear product differentiation.
Emerging and niche brands such as e.l.f., Kitsch, and EOS highlight the growing importance of focused category ownership. With fewer products and tightly defined offerings, these brands rely on strong digital-first strategies, competitive pricing, and high engagement through reviews and social proof.
READ MORE | Top Selling Beauty Products on Amazon Best Sellers 2024
Monthly Pricing Trends: Why March Peaks and September Drops Matter
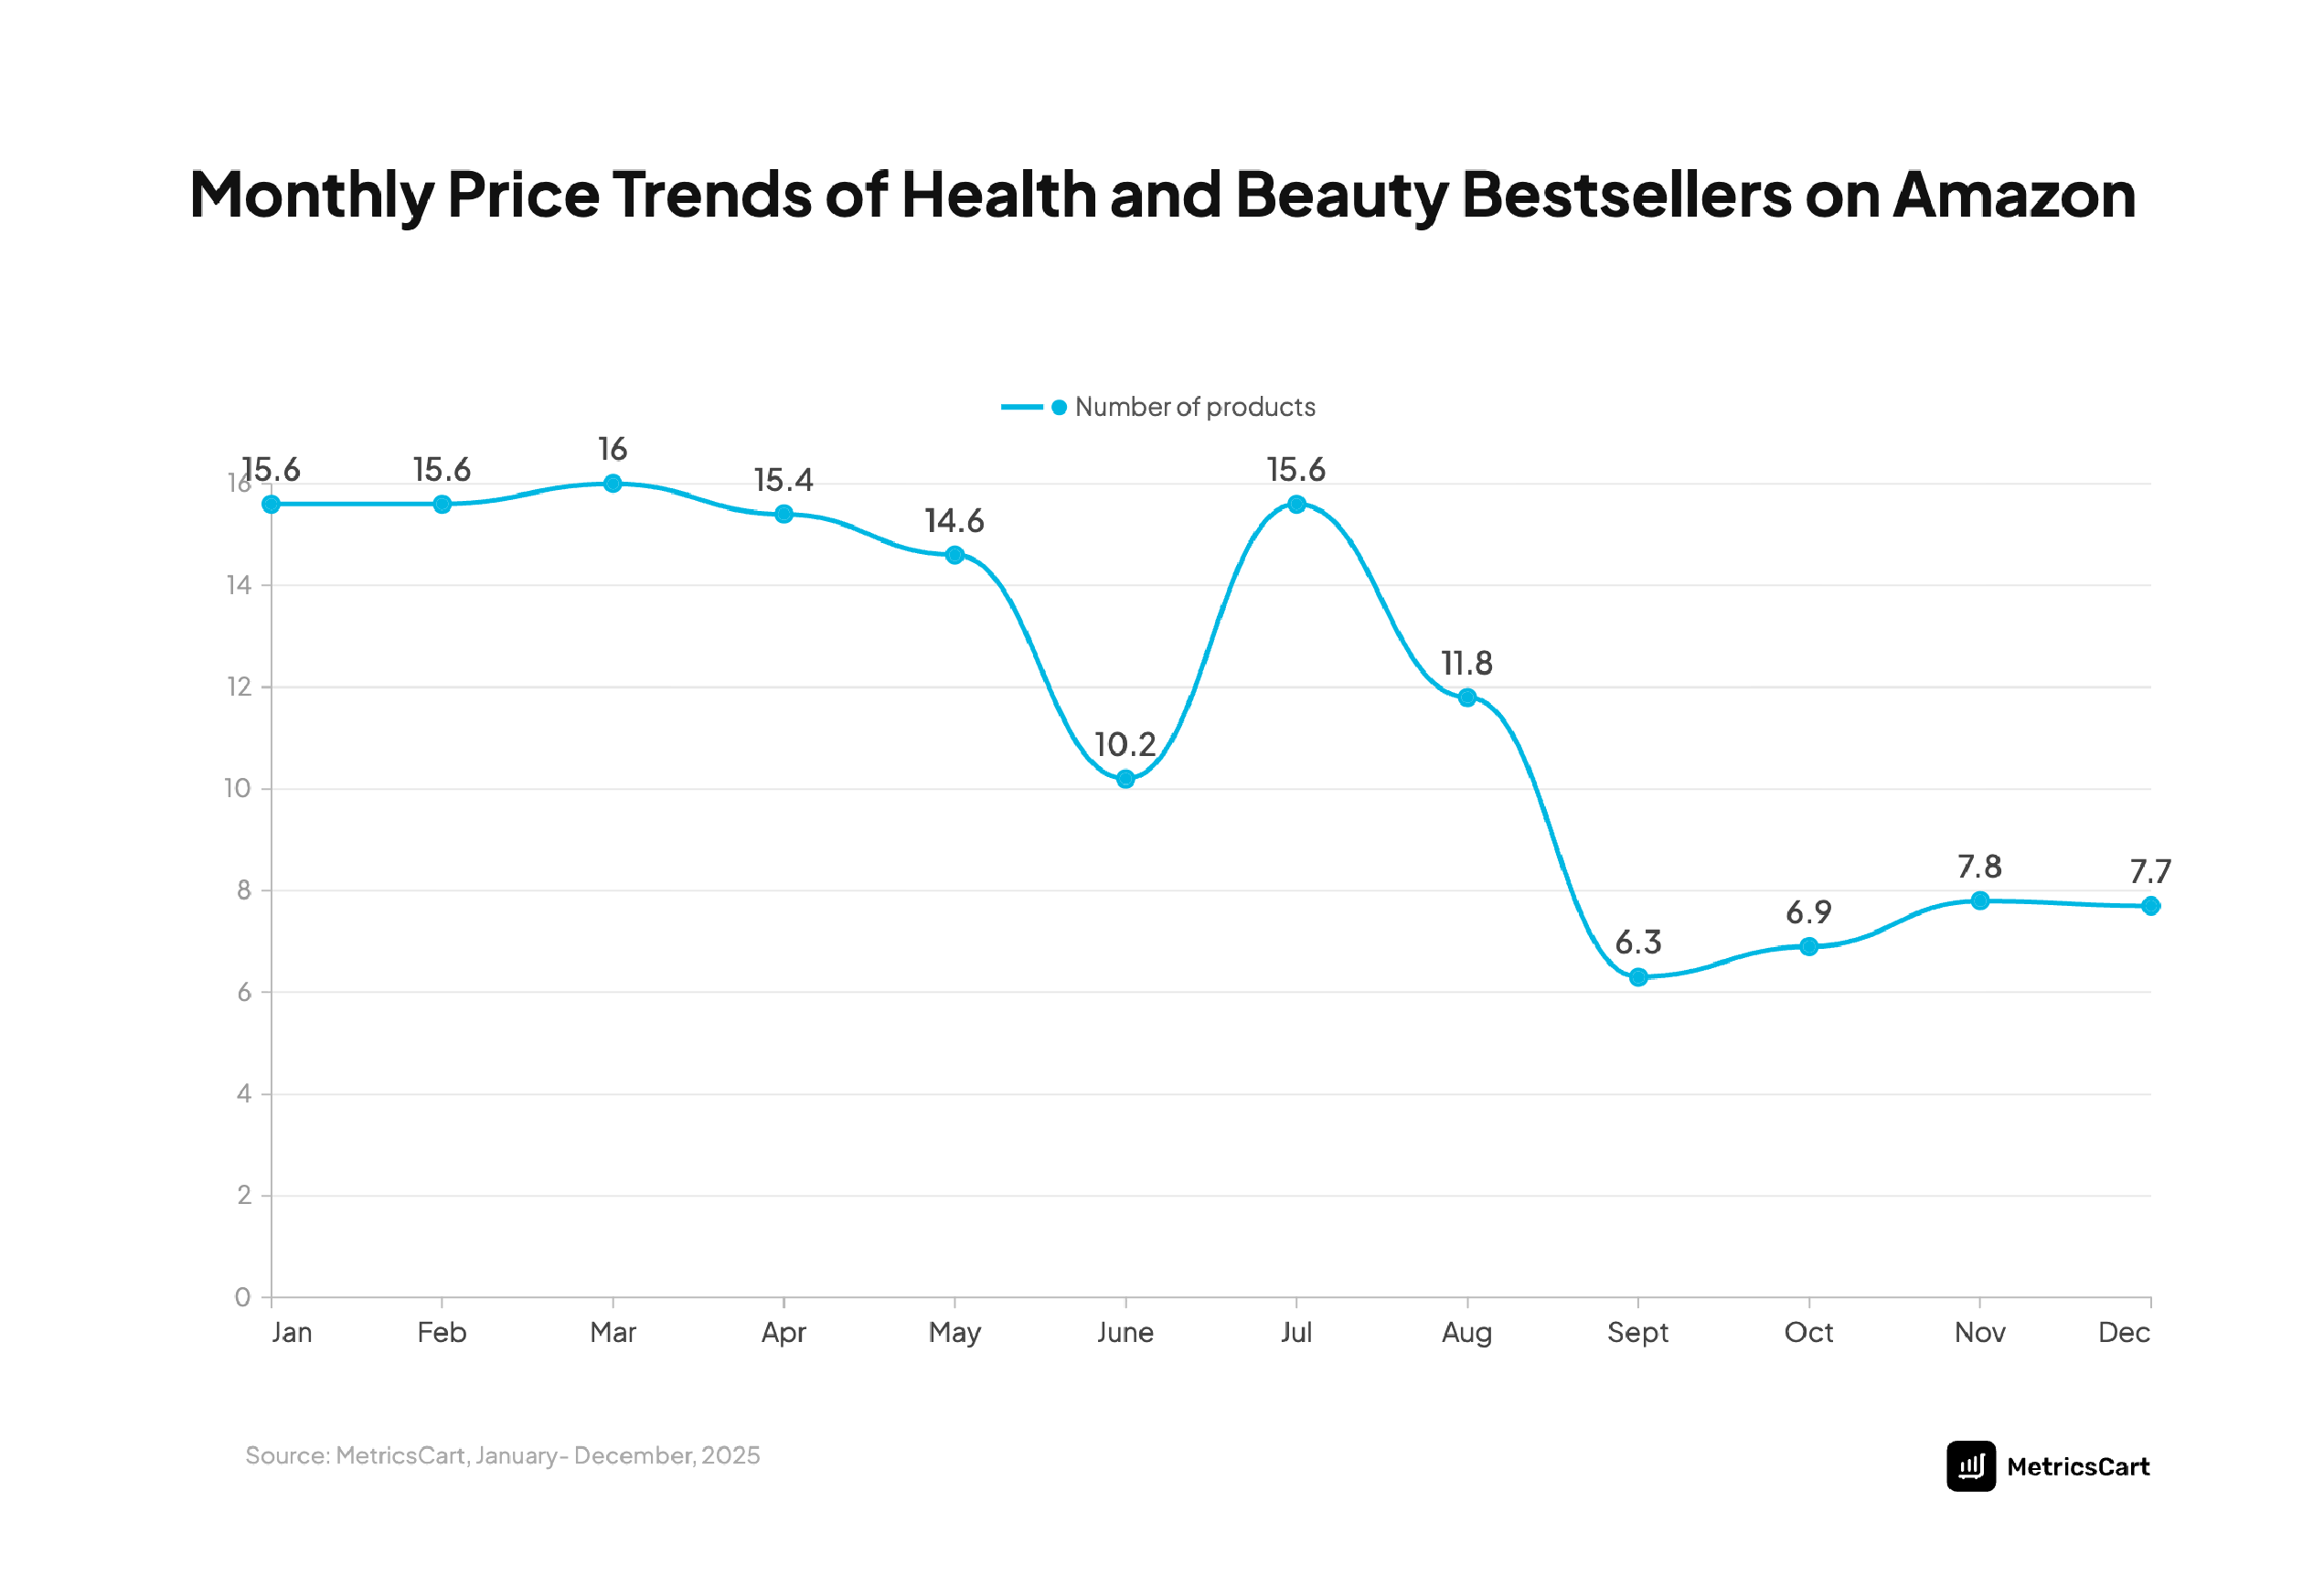
Using the MetricsCart price monitoring solution, our research team analyzed the monthly pricing trends of Amazon’s Health & Beauty bestsellers, revealing a highly seasonal pricing strategy in which fluctuations closely mirror demand cycles, promotional events, and inventory management practices.
The results show a clear trajectory: average prices remain relatively high in the first half of the year, starting at $15.6 in January, holding steady at $15.6 in February, peaking at $16.0 in March, then gradually declining through April ($15.4) and May ($14.6).
This early-year stability indicates strong pricing power, with minimal reliance on discounts and steady consumer demand supporting higher price points.
The sharp drop to $10.2 in June marks the first major inflection point. This decline reflects pre-promotional adjustments as brands prepare for large-scale events like Amazon Prime Day. June essentially acts as a strategic reset window before peak mid-year demand.
In July, prices rebounded significantly to $15.6, nearly matching January levels. While Prime Day is typically associated with heavy discounting, this increase suggests a shift in bestseller composition rather than a pure price rise. Higher-value bundles, premium SKUs, and multi-pack offerings gain traction during this period, pushing the average price upward.
The post-event phase brings a steep correction. Prices drop to $11.8 in August and further decline to the yearly low of $6.3 in September—a nearly 60% decrease from the March peak.
From October onward, prices begin a gradual recovery, rising to $6.9 in October and $7.8 in November, before stabilizing slightly at $7.7 in December. Despite entering the holiday season, prices do not return to early-year highs due to sustained promotional pressure from events like Black Friday and Cyber Monday. Instead, Q4 reflects a volume-driven strategy, where brands prioritize conversion and sales velocity over margin expansion.
Average Price vs. Rank vs. Product Count: What Drives Bestseller Leadership?
The relationship between average price, bestseller rank, and product count across top Health & Beauty brands on Amazon reveals a critical insight: there is no single formula for success. Different combinations of price and assortment can lead to strong rankings, but only when aligned with category demand and positioning.
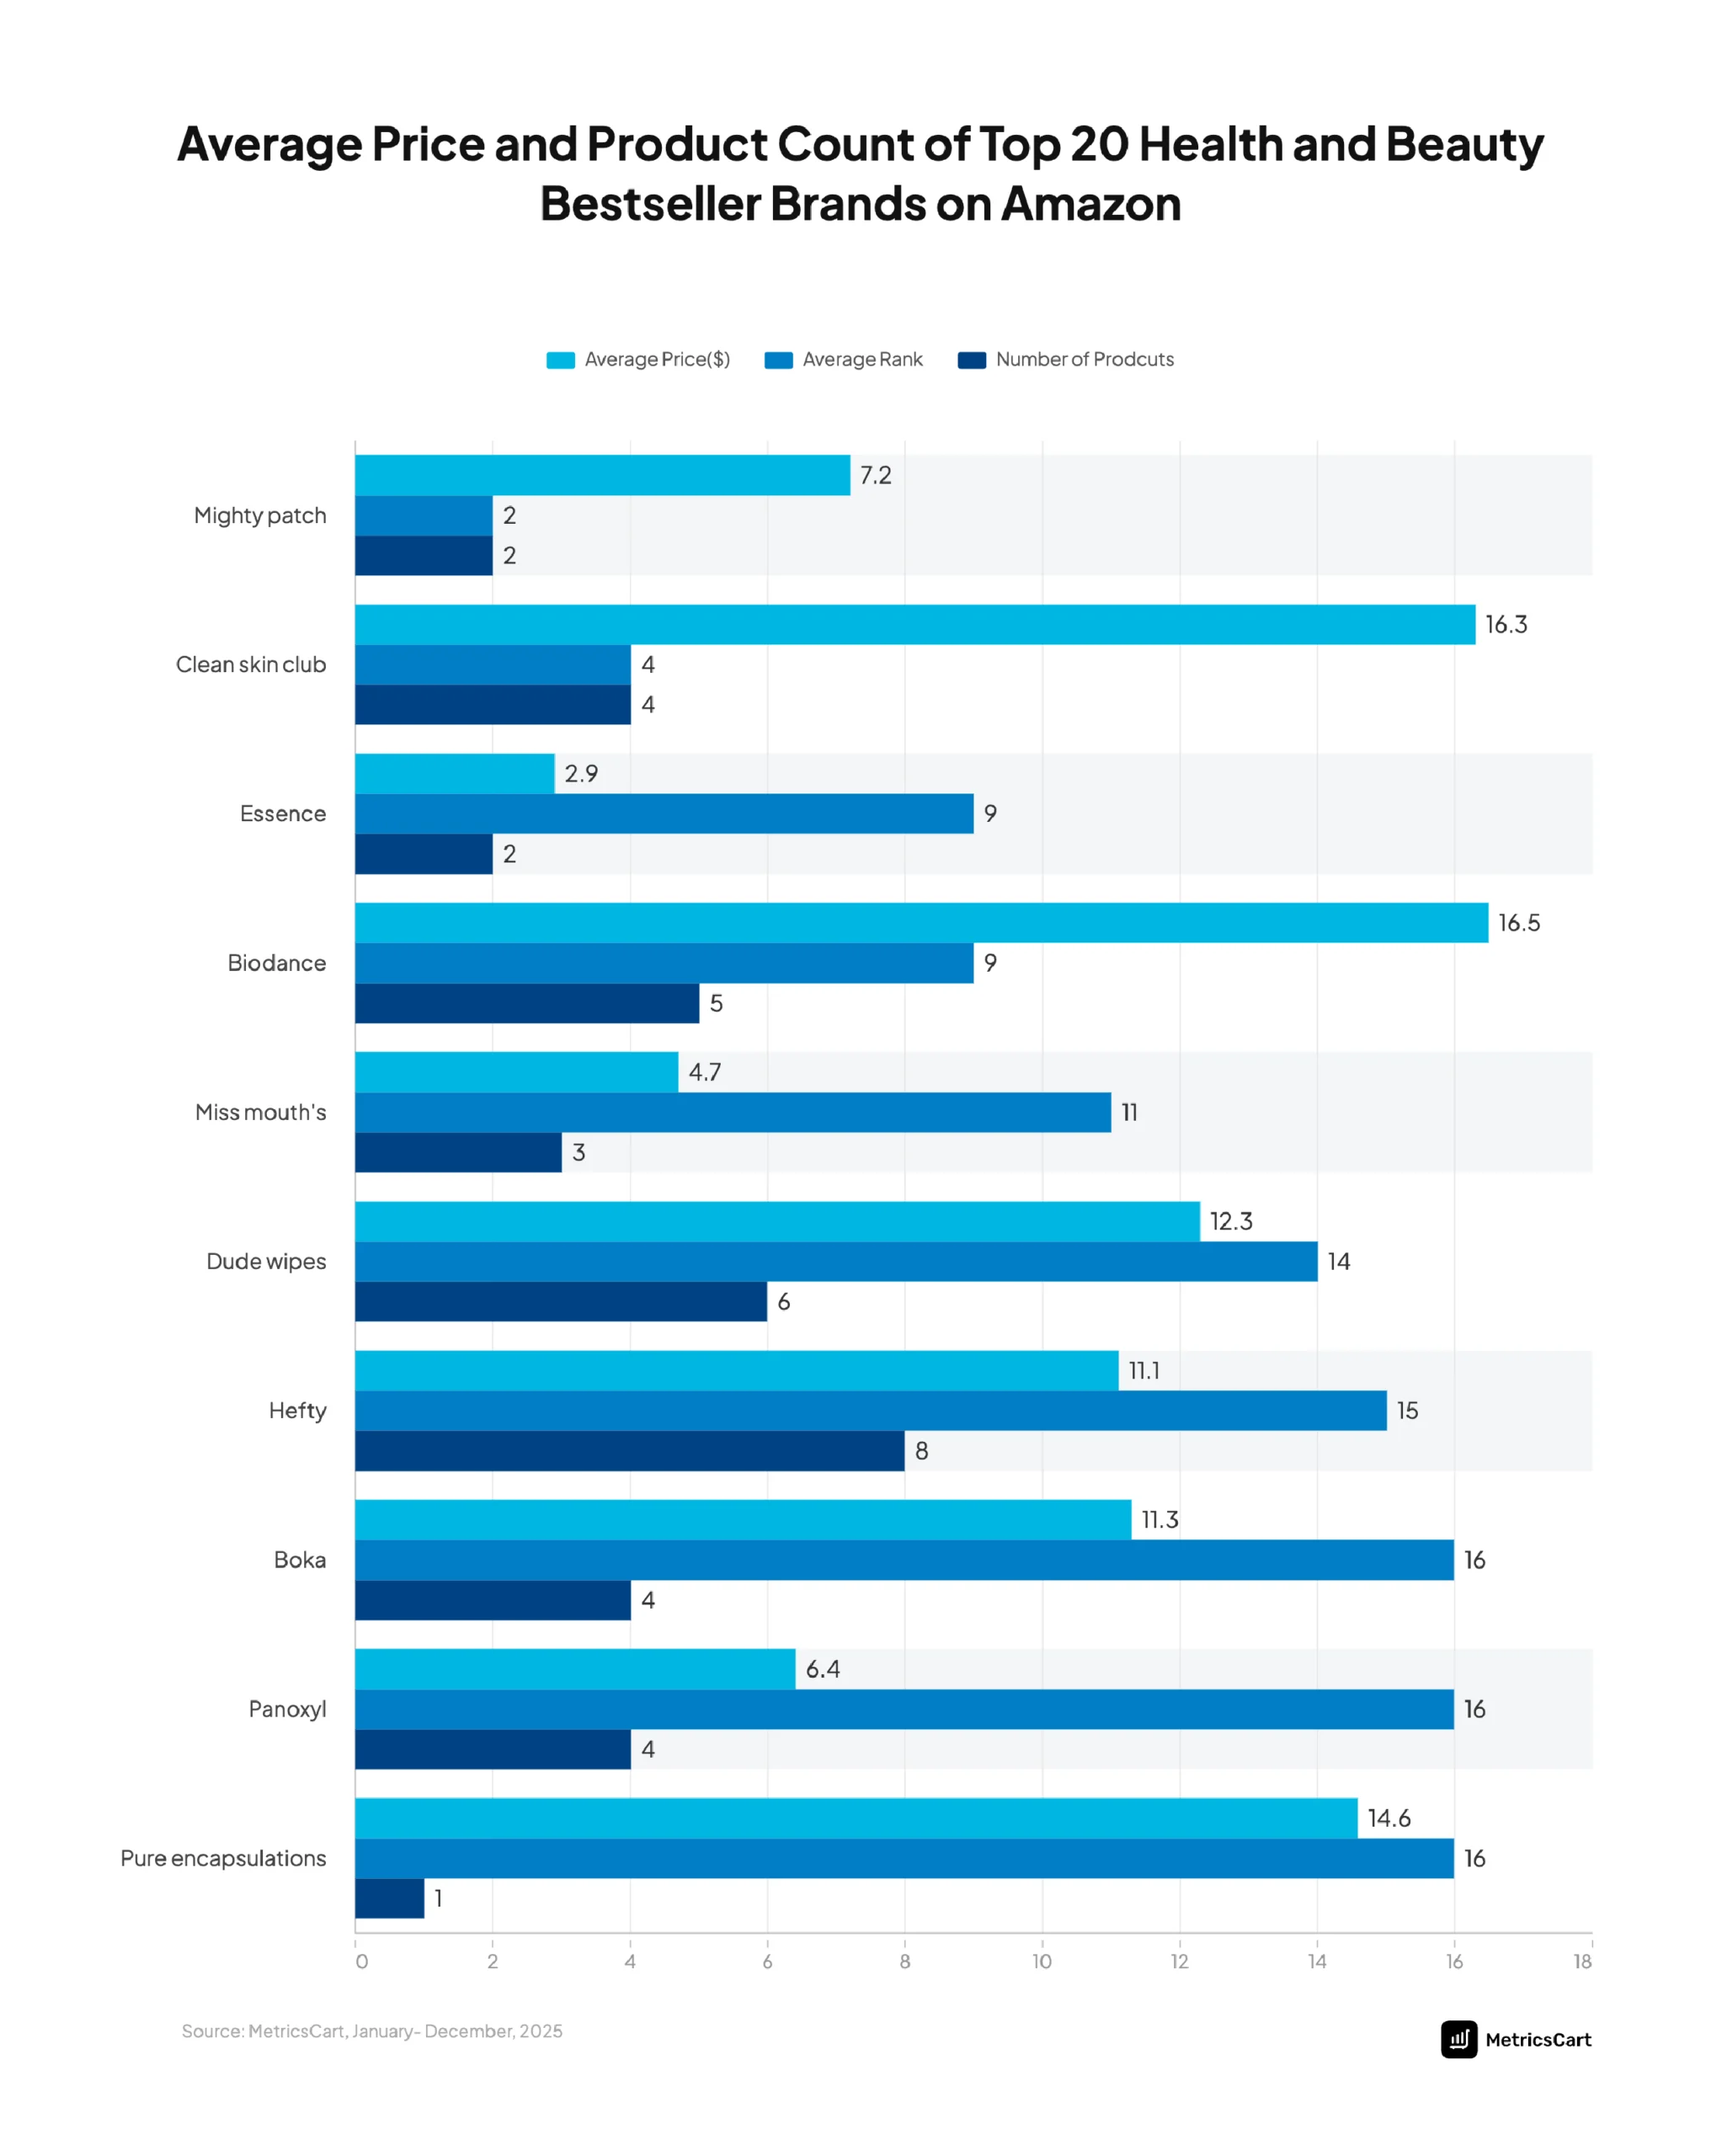
- At the top of the rankings, brands like Mighty Patch (Rank 2, Avg. Price $7.2, 2 products) and Clean Skin Club (Rank 4, Avg. Price $16.3, 4 products) demonstrate that high performance does not require large catalogs.
- A contrasting pattern emerges with brands like Biodance (Avg. Price $16.5, Rank 9, 5 products) and Pure Encapsulations (Avg. Price $14.6, Rank 16, 1 product).
- On the other end of the spectrum, brands like Essence (Avg. Price $2.9, Rank 9, 2 products) and Miss Mouth’s (Avg. Price $4.7, Rank 11, 3 products) highlight the power of ultra-affordable pricing.
- Mid-tier brands such as Dude Wipes (Avg. Price $12.3, Rank 14, 6 products), Hefty (Avg. Price $11.1, Rank 15, 8 products), and Boka (Avg. Price $11.3, Rank 16, 4 products) reflect a balanced strategy where moderate pricing is combined with broader product assortments.
Overall, the data highlights three key dynamics shaping bestseller rankings on Amazon:
- Focused dominance beats scale: Brands with 1–4 high-performing SKUs can outperform those with larger catalogs if they drive strong engagement.
- Price influences conversion, not leadership: Both low-priced ($2.9) and premium ($16.5) brands appear in the rankings, but neither guarantees top placement on its own.
- Assortment supports visibility, not necessarily rank: Increasing product count (from 1 to 8 SKUs) improves keyword coverage but does not directly translate into higher rankings without demand concentration.
In essence, Amazon’s Health & Beauty category operates on a performance-first model, where conversion velocity, review strength, and product-market fit outweigh sheer scale or pricing strategy alone. Brands that succeed are those that align all three levers—price, assortment, and demand signals into a cohesive digital shelf strategy.
Average Price vs. Rank vs. Rating: Why Ratings Stay Stable While Price and Rank Fluctuate?
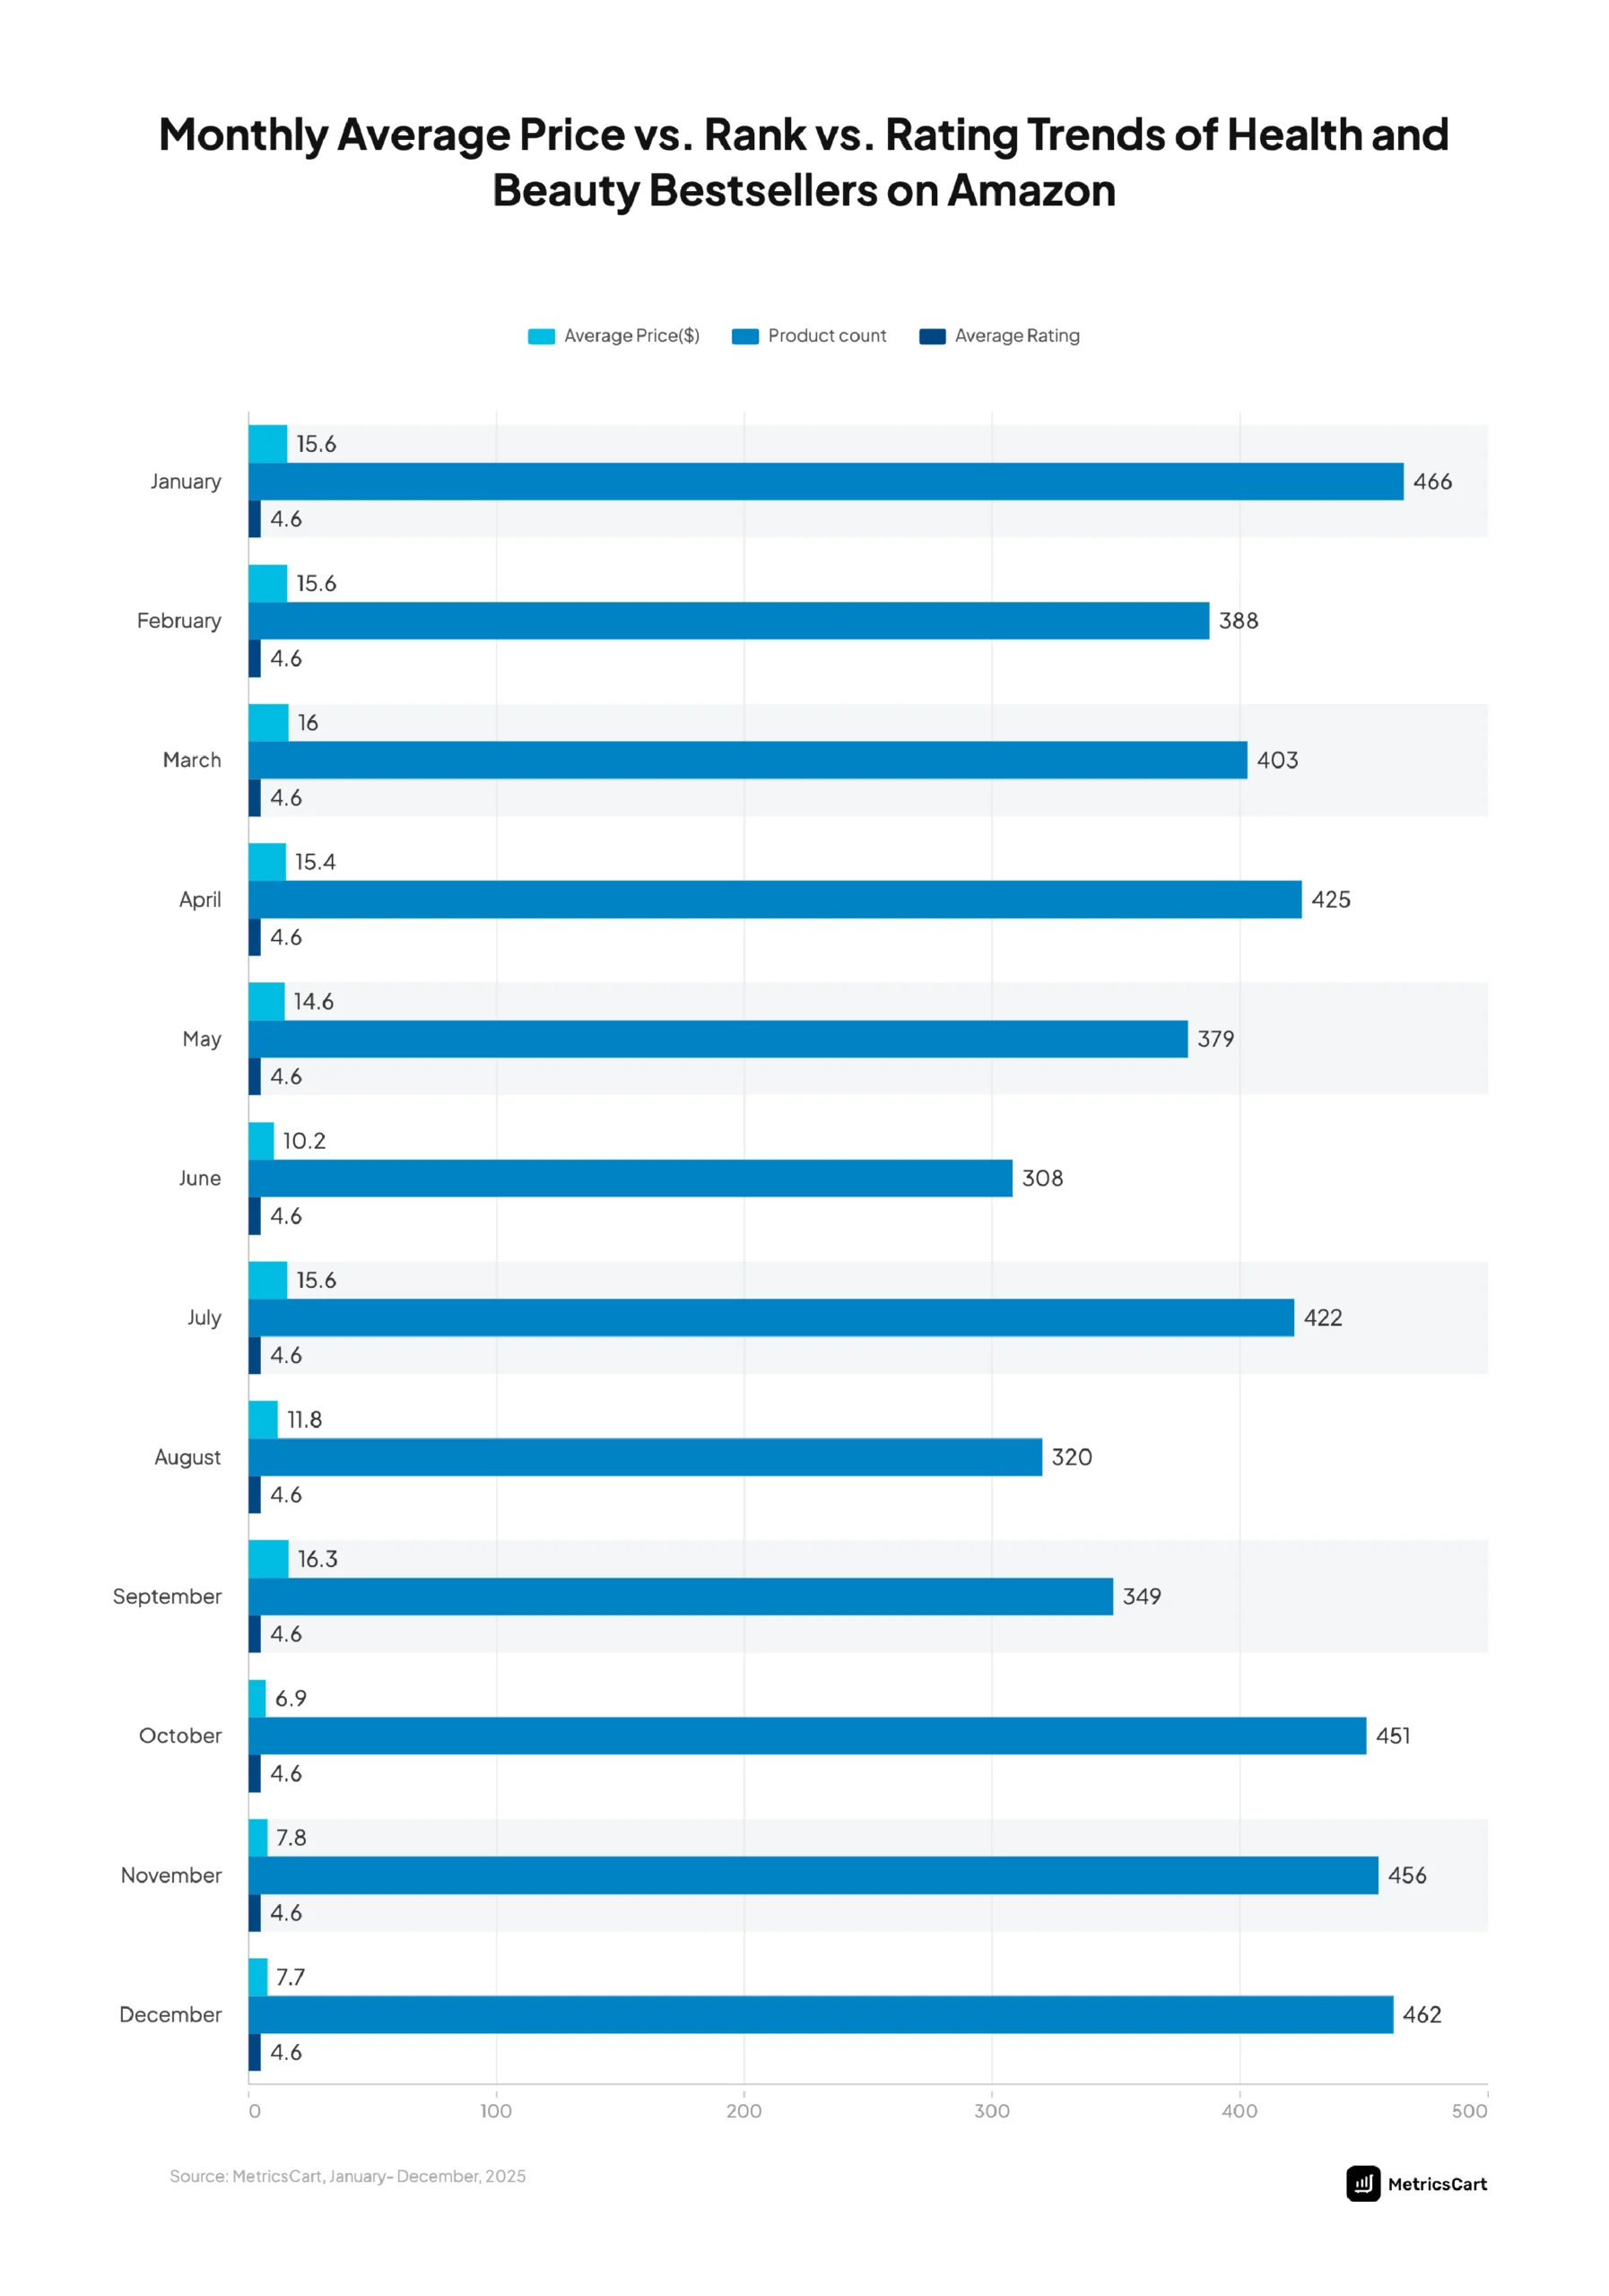
The comparison of average price, rank (product count), and ratings across months reveals a striking dynamic in Amazon’s Health & Beauty category: while price and ranking signals fluctuate significantly throughout the year, average ratings remain stable at 4.6 across all months. This highlights a fundamental truth about the digital shelf—ratings are a baseline requirement, not a differentiator, whereas price and demand signals actively drive ranking shifts.
Across the year, average prices move from a high of $16.0 in March to a low of $6.3 in September, while the number of ranked bestselling products fluctuates from 308 in June to peaks of 466 in January and 462 in December.
Despite these wide variations in both price and product visibility, the average rating consistently holds at 4.6, indicating that nearly all top-performing products operate within a narrow band of high consumer satisfaction.
This consistency in ratings can be attributed to the nature of Amazon’s ranking algorithm. Products that fail to maintain strong ratings are quickly filtered out of the bestseller ecosystem, leaving only those that meet a minimum quality threshold.
As a result, ratings across top products converge, making it difficult for brands to differentiate purely on customer feedback once they cross this baseline. In effect, ratings determine eligibility, not leadership.
Overall, the analysis highlights three key insights:
- Ratings are a constant: At 4.6 across all months, they act as a minimum threshold for entry into the bestseller cohort.
- Price drives conversion cycles: Fluctuations from $16.0 to $6.3 reflect strategic adjustments aligned with demand and promotional events.
- Rank (product count) reflects competitive intensity: Variations from 308 to 466 products indicate how many brands successfully capture visibility at different times of the year.
Health and Beauty New Product Entries by Month: Why January Surges and Mid-Year Slows Down
The monthly distribution of new product entries in Amazon’s Health & Beauty bestsellers highlights a highly seasonal innovation and entry cycle, where brands time launches and optimizations around demand peaks, promotional events, and inventory strategies.
Table title: New Health and Beauty Bestseller Product Entires by Month in 2025
| Month | Number of Products |
| January | 466 |
| February | 122 |
| March | 126 |
| April | 110 |
| May | 97 |
| June | 58 |
| July | 126 |
| August | 46 |
| September | 68 |
| October | 129 |
| November | 130 |
| December | 129 |
MetricsCart research findings show a sharp spike in January (466 new entries), followed by a steep decline through the first half of the year, reaching a low of 58 in June and 46 in August before recovering again in Q4 with 129–130 entries between October and December.
The January surge (466) is the most prominent outlier and reflects a convergence of multiple factors.
- Focus shifts from launching to scaling
- Brands optimize PDPs, pricing, and reviews
- Existing SKUs are pushed to maximize conversion
- Fewer new entrants break into the competitive set
Following this peak, new entries drop sharply to 122 in February and stabilize around 110–126 through April, indicating a transition from launch-heavy activity to performance consolidation. During this phase, brands focus less on introducing new products and more on scaling visibility and optimizing conversion for existing listings.
The gradual decline to 97 in May and further to 58 in June reflects a tightening competitive environment as brands prepare for major mid-year events like Amazon Prime Day. During this period, the emphasis shifts toward strengthening top-performing SKUs rather than expanding the assortment, leading to fewer new entrants.
The post-Prime Day phase shows mixed recovery. While July sees a rebound to 126 new entries, driven by increased traffic and promotional exposure, the momentum does not sustain. Entries drop again to 46 in August, the year’s lowest point, and remain relatively subdued at 68 in September. This reflects a post-event slowdown in demand, with brands prioritizing inventory clearance and pricing adjustments over launching new products.
The final quarter marks a strong recovery, with 129 new entries in October, 130 in November, and 129 in December. This aligns with peak shopping events and increased consumer demand.
Why Q4 rebounds (129–130 entries):
- Holiday-driven traffic surge
- Launch of seasonal SKUs and bundles
- Events like Black Friday and Cyber Monday
- Higher probability of rapid ranking gains
The MetricsCart research findings show that new product entry into bestseller rankings is not evenly distributed; it is strategically timed around demand peaks and platform events.
What Smart Brands Should Learn From Amazon Health & Beauty Bestsellers
The patterns across this report make one thing clear: Amazon’s Health & Beauty category is not won by size, legacy, or price alone; it is won by how well brands execute across the digital shelf.
- The first and most decisive lesson is that hero products outperform large catalogs. The success of Mighty Patch, ranking among the top with just two SKUs, demonstrates that focused category ownership drives stronger results than SKU expansion.
- At the same time, scale still matters but only when paired with the right pricing strategy. Amazon Basics proves that high SKU volume can dominate the category, but only when combined with aggressive, value-driven pricing (55 products at ~$9 average).
- With average ratings consistently locked at 4.6 across all months, only products that meet this threshold enter and remain in the bestseller ecosystem. This means brands must shift their focus beyond ratings to what actually drives ranking: conversion velocity, pricing competitiveness, and review momentum.
- The surge of 466 new bestseller entries in January, compared to just 46 in August, shows that when you launch is just as important as what you launch.
How MetricsCart Helps Brands Win in Competitive Amazon Categories
Succeeding in Amazon’s Health & Beauty category requires navigating constant shifts in pricing, competition, and consumer behavior. MetricsCart enables brands to stay ahead of these shifts by transforming raw marketplace data into actionable, real-time insights.
By analyzing bestseller cohorts, brands can identify whether they are competing with value-driven players like Amazon Basics or premium leaders like La Roche-Posay, and refine their strategy accordingly. This level of clarity is essential in a category where multiple pricing tiers and positioning strategies coexist.
As brands plan for 2026, the opportunity lies in operationalizing these insights. Product strategies must move away from blind expansion toward focused assortment building, where a few high-performing SKUs drive most visibility and conversion.
Looking ahead, the category will continue to be shaped by blended consumer behavior, where shoppers mix premium and budget products based on perceived value rather than brand loyalty. This creates room for both premium leaders and accessible disruptors to grow, provided they maintain strong product-market fit and digital shelf execution.
MetricsCart’s research suggests that brands aiming to win in 2026 must continuously track pricing movements, competitive positioning, review signals, and category trends. Those that treat the digital shelf as a dynamic system rather than a static storefront will be better equipped to adapt, compete, and scale.
As Amazon’s Health & Beauty category continues to evolve, the brands that succeed will be those that translate insights into action quickly, optimizing not just what they sell, but how they sell it.
Ready to Take Your Health & Beauty Brand to the Next Level?