Highlights
The following findings are drawn from MetricsCart’s digital shelf analysis of Tillamook, January 18–31, 2026.
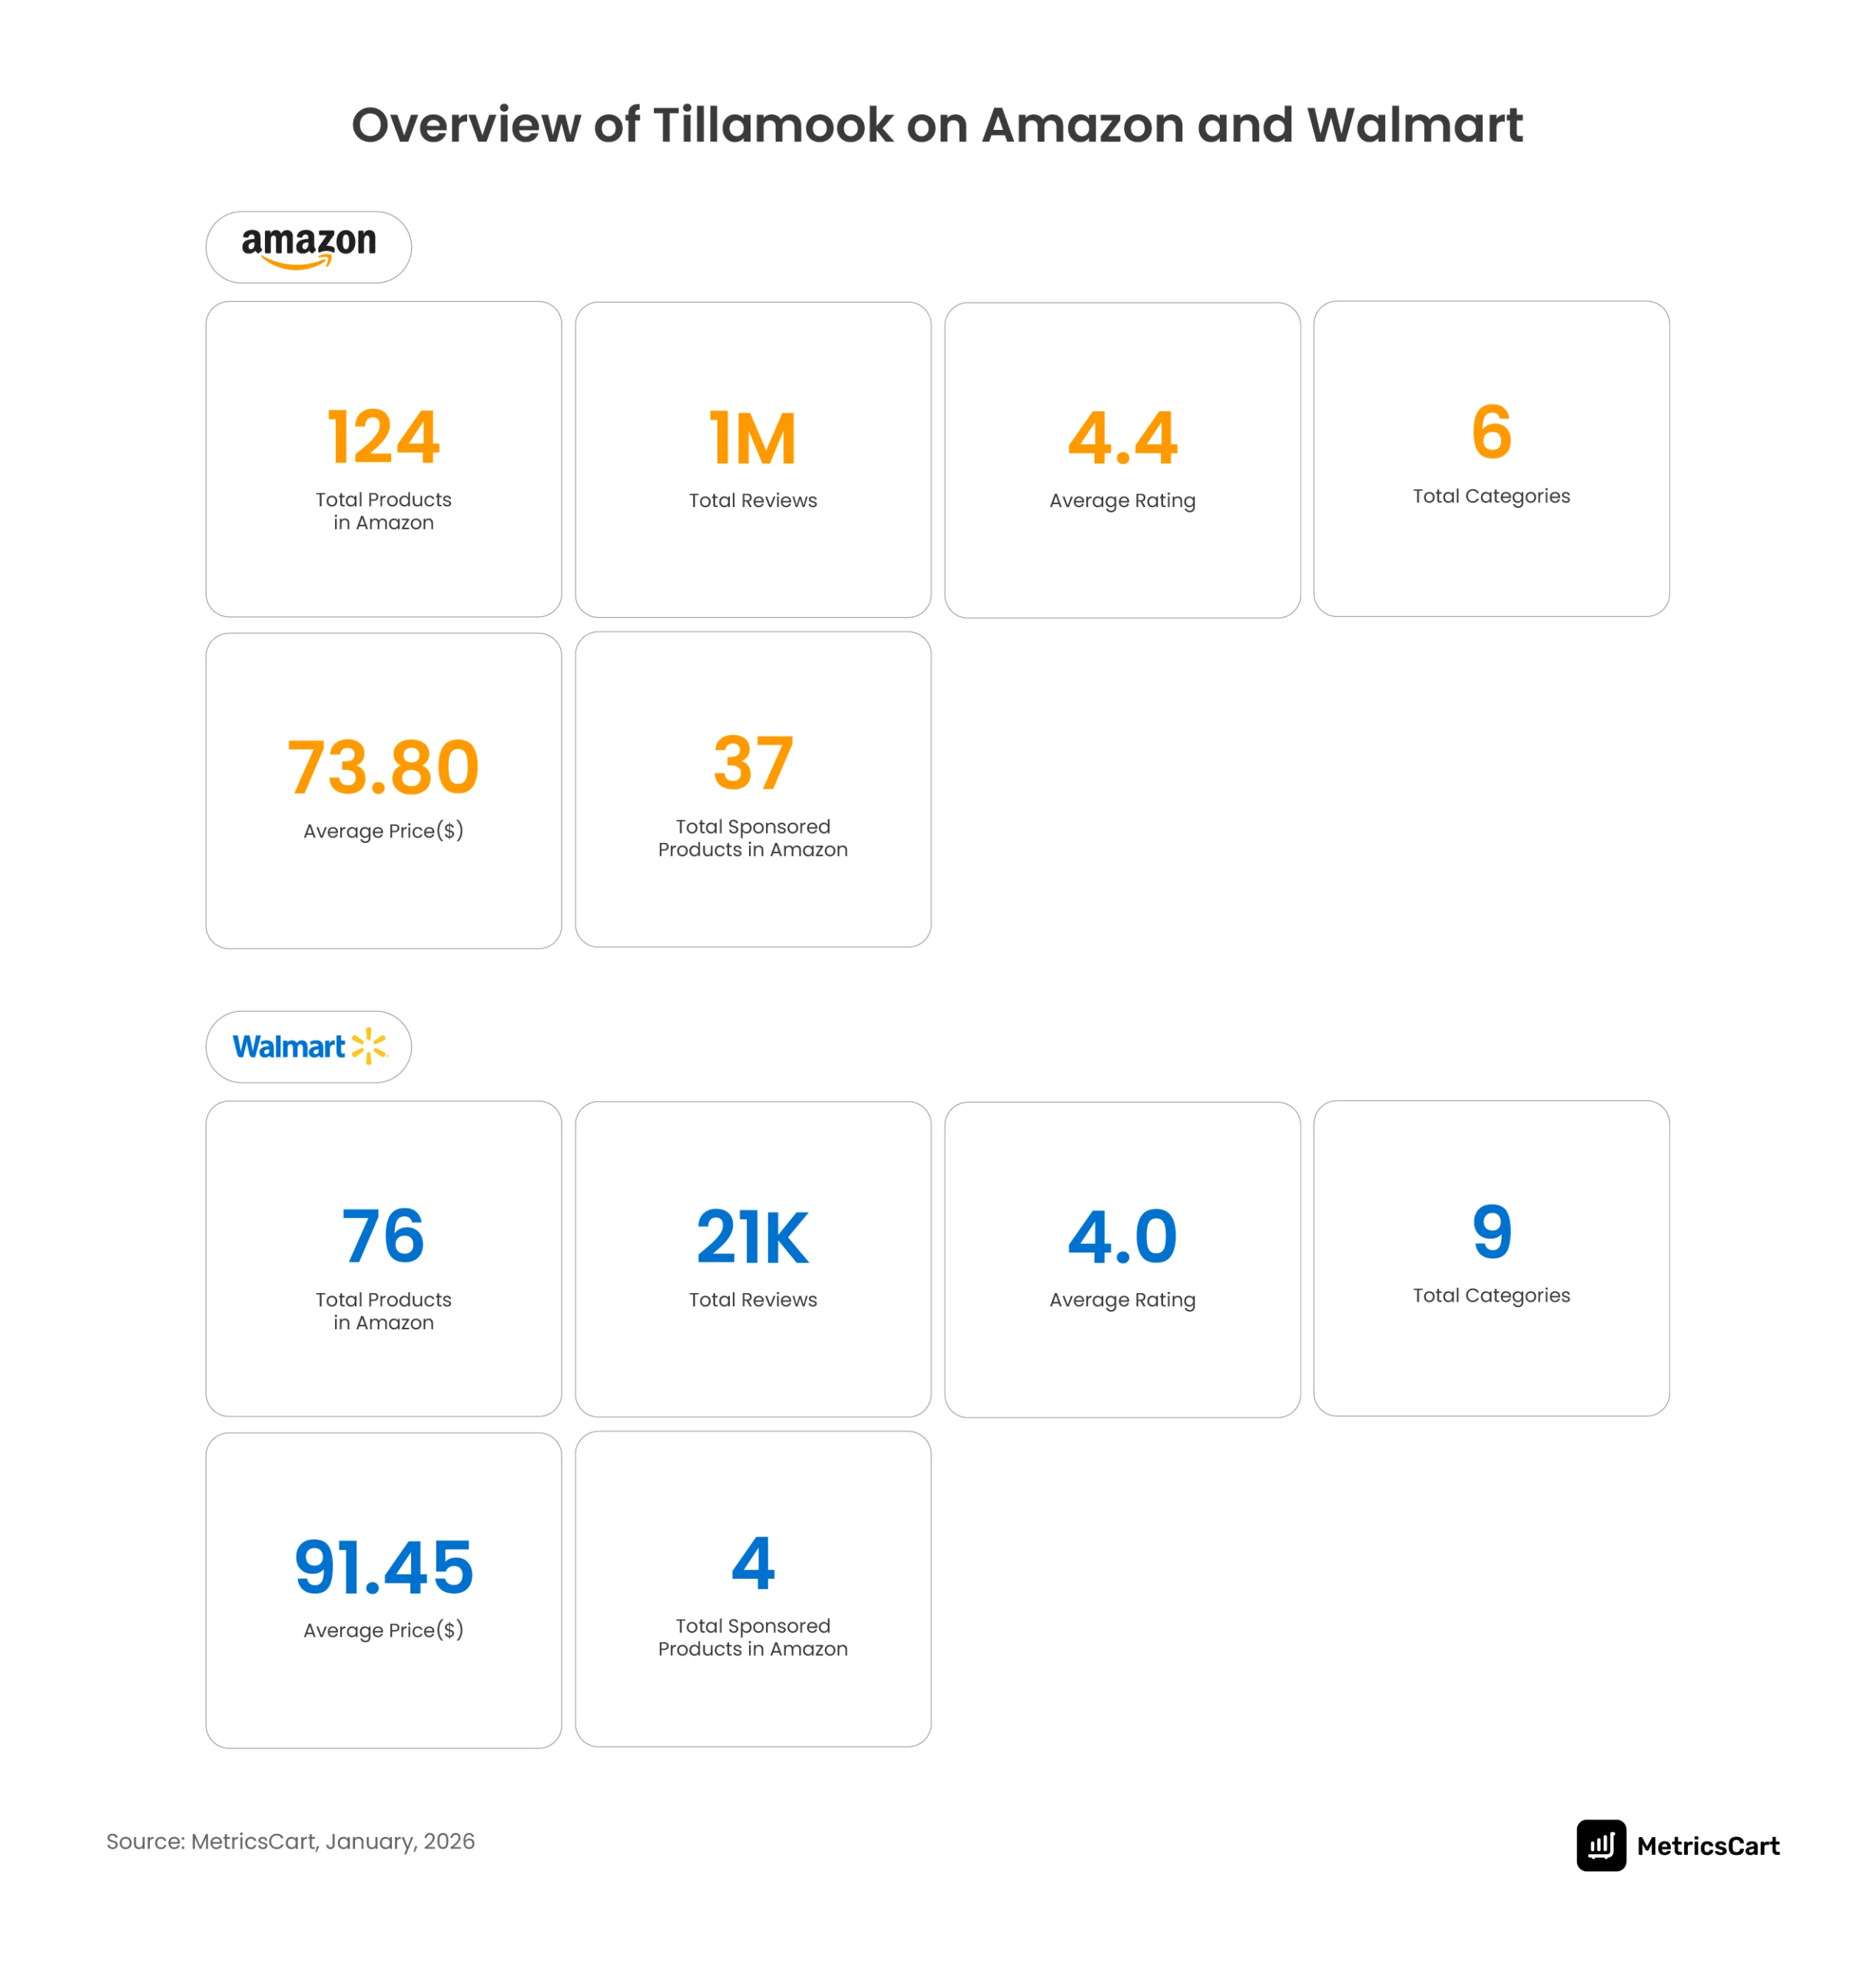
- Amazon carries 38% more products under the name Tillamook than Walmart, with 124 listings compared to 76, making it Tillamook’s primary platform for search visibility and assortment depth.
- Walmart maintains a smaller but more stable shelf, with active SKU count staying around 37–40 products, showing stronger assortment control and premium positioning.
- On Amazon, Tillamook’s most-reviewed products are meat snacks like beef jerky, smoked sausages, and meat sticks, with top SKUs reaching 145,000 reviews, while Walmart remains largely cheese-led.
- 73% of Tillamook products on Amazon fall in the $0–$50 range, compared to only 54% on Walmart, making Amazon the more affordable platform despite Walmart’s lower-price reputation.
- Walmart’s average Tillamook listing price is $91.45, compared to Amazon’s $73.80, showing stronger premium pricing and higher-value basket behavior on Walmart.
- Tillamook invests far more aggressively in retail media on Amazon, where 29% of listings are sponsored, compared to only 5% on Walmart, creating a nearly 9x sponsored product gap.
- First-party sellers anchor pricing on both platforms, with Amazon.com (59 SKUs) and Walmart.com (30 SKUs) holding the largest share of listings at the lowest average prices.
- Food Service Direct has the highest average price on both Amazon ($137) and Walmart ($138), a strong signal to conduct MAP monitoring, as it shows how third-party sellers can influence premium price perception across marketplaces.
About the Report: This report analyzes Tillamook’s digital shelf performance across Amazon and Walmart using the MetricsCart Digital Shelf Analytics platform. The analysis is based on the brand’s marketplace performance tracked between January 18 and January 31, 2026, covering daily changes in SKU availability, pricing movements, sponsored product visibility, seller activity, ratings, and review velocity across both platforms.
By monitoring these shifts over time, this Tillamook on Amazon and Walmart analysis helps CPG brands benchmark platform strategy and understand how assortment, pricing, and retail media decisions shape e-commerce success.
Introduction
Search for “Tillamook” on Amazon or Walmart and you’ll find far more than cheese.
From cheddar and butter to beef jerky, meat sticks, and smoked sausages, the Tillamook name appears across multiple high-traffic grocery categories and generates millions of customer interactions every year.
That makes Tillamook an interesting digital shelf case study.
While consumers often recognize the name for its dairy heritage, marketplace insights tells a broader story about assortment strategy, pricing architecture, review generation, sponsored visibility, and seller management. Together, these factors determine how often products appear in search results, attract shopper attention, and ultimately convert into sales.
Tillamook’s Assortment: What Each Platform Gets
The digital shelf strategy of Tillamook on Amazon and Walmart isn’t based on a one-size-fits-all approach. Instead of repeating the same product mix across both retailers, Tillamook adjusts assortment depth and category focus based on how shoppers behave on each platform.
Tillamook on Amazon is built for scale, visibility, and high-frequency purchases; meanwhile, on Walmart, the brand focuses on stronger premium positioning and broader category diversification.
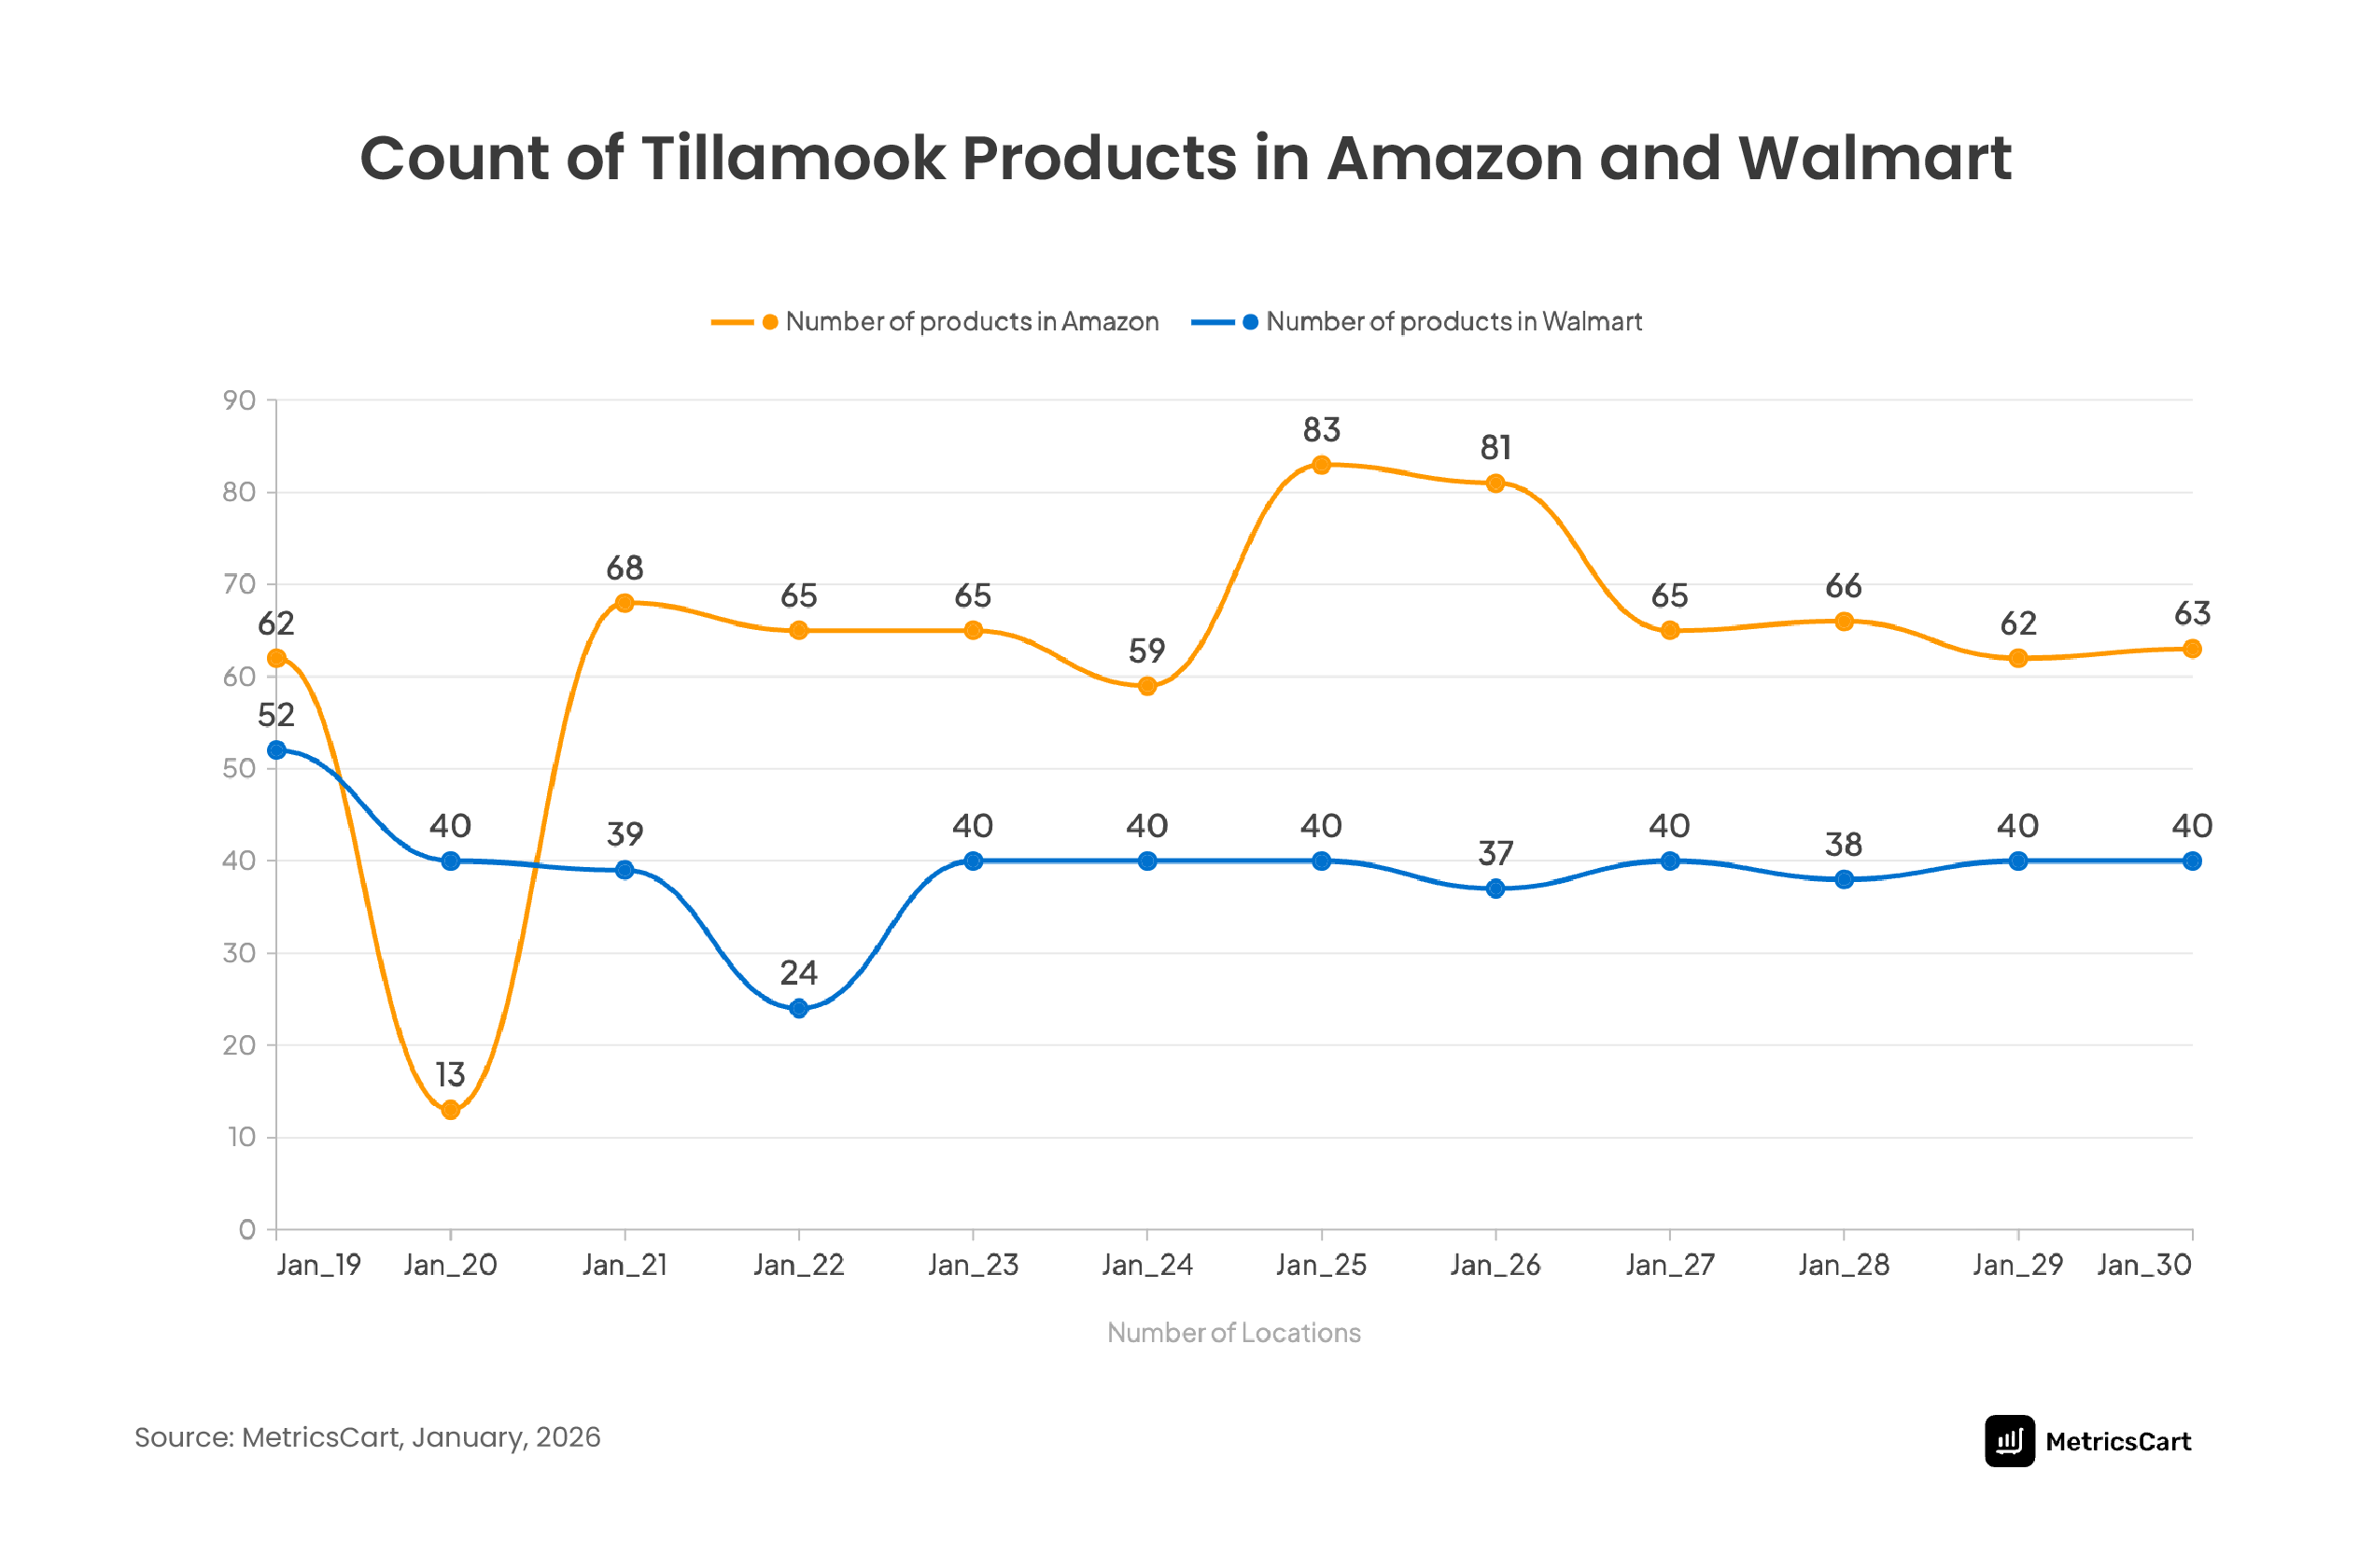
The product count graph makes this difference immediately clear. Amazon carries 38% more Tillamook products than Walmart, with 124 total listings compared to Walmart’s 76. During the reporting period, Amazon’s active SKU count fluctuated between 59 and 83 products, while Walmart remained much more stable at around 37 to 40 products.
This larger assortment gives Amazon a stronger Share of Search advantage. More SKUs create more searchable entry points, more Sponsored Product opportunities, and more chances to accumulate ratings and reviews.
Walmart’s smaller, more stable shelf reflects tighter assortment control and a stronger focus on profitability rather than on aggressive expansion.
On January 20, Amazon’s Tillamook assortment dropped sharply to just 13 active products, an 89% decrease in SKU visibility compared to normal listing levels. At the same time, the average listing price surged to $158 as lower-priced SKUs disappeared from the shelf. This is a mathematical outlier indicating a critical supply chain or availability disruption rather than normal marketplace fluctuation. This out-of-stock inflation pattern likely impacted conversion rates, Sponsored Product efficiency, and overall Share of Search performance.
Tillamook on Amazon: Cheese and Meat Snacks Dominate
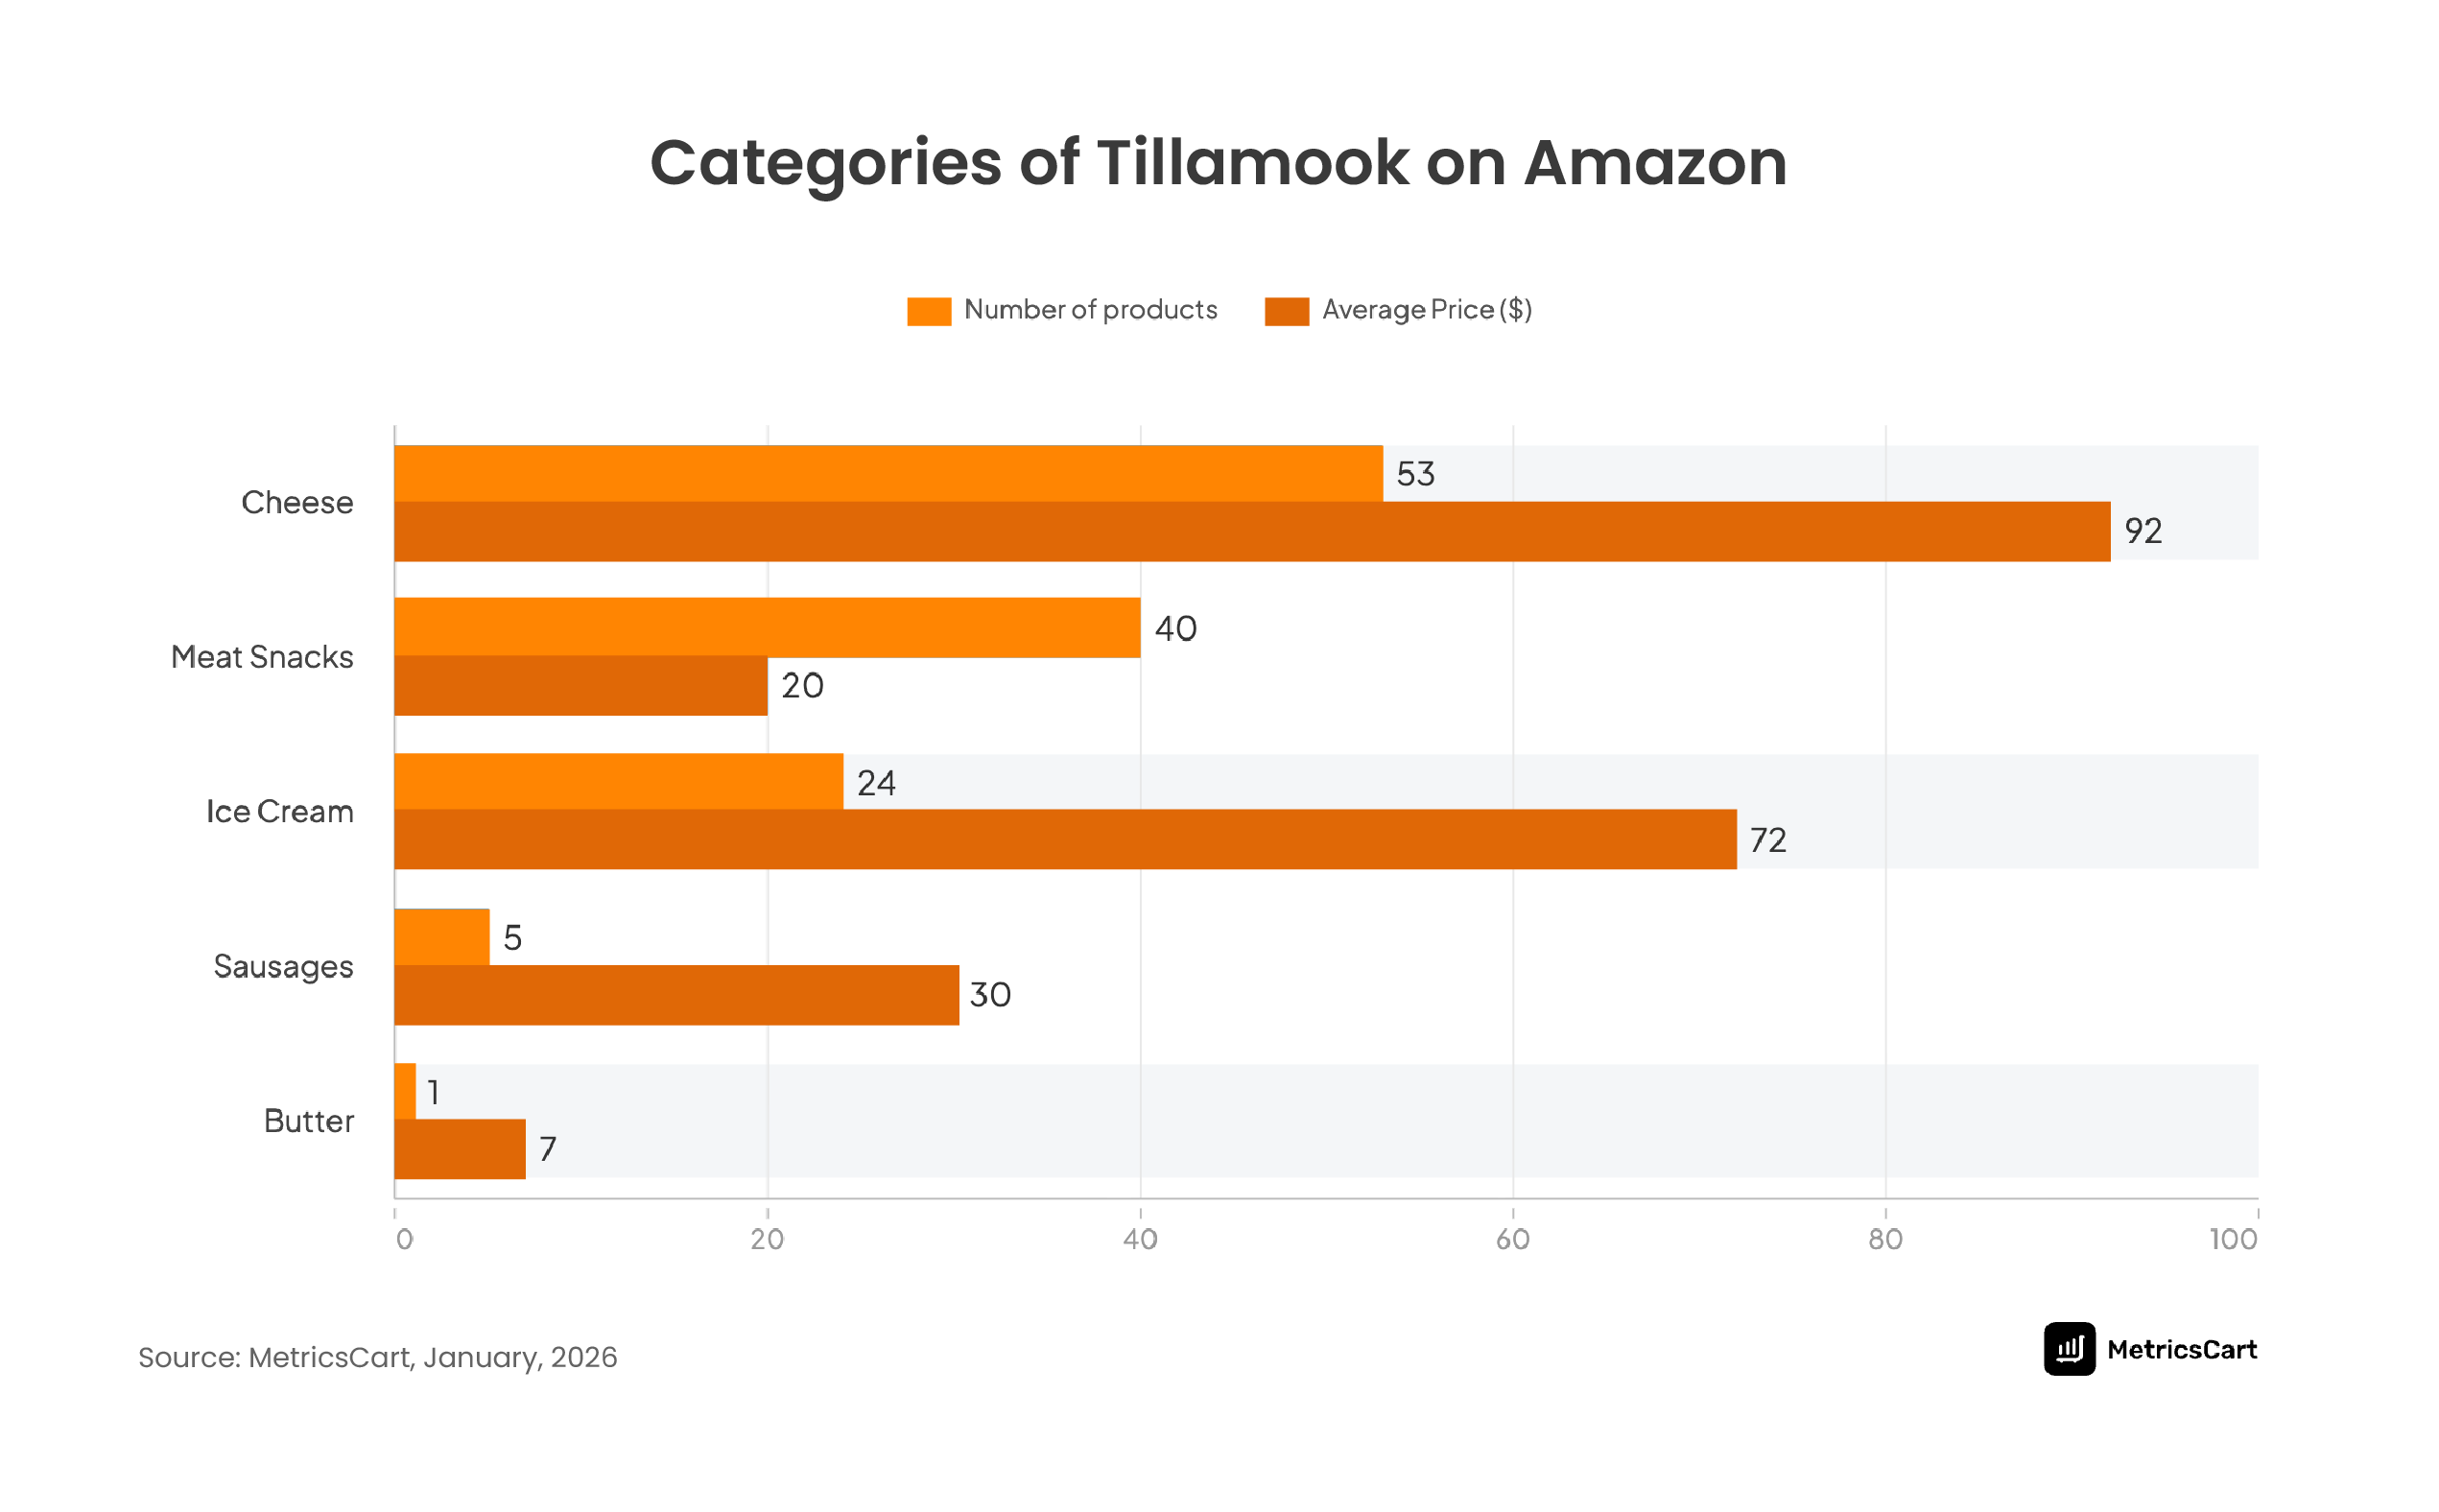
Cheese is Tillamook’s strongest category on Amazon and the main driver of search visibility. The category analysis reveals that Amazon carries more than double the number of cheese SKUs compared to Walmart, helping Tillamook dominate high-intent searches around cheddar, sliced cheese, and bulk cheese packs.
Meanwhile, meat snacks like beef jerky, smoked meats, and meat sticks generate the highest customer engagement on Amazon. Tillamook’s top-performing Amazon products are meat snacks, with leading SKUs reaching up to 145,000 reviews, far ahead of cheese products.
This tells us that Amazon shoppers’ behavior is driven more by convenience and repeat snacking purchases than by Tillamook’s traditional dairy identity. For brands, this is critical: platform behavior should shape assortment decisions, not just brand heritage.
Tillamook on Walmart: A More Diversified Dairy and Snack Shelf
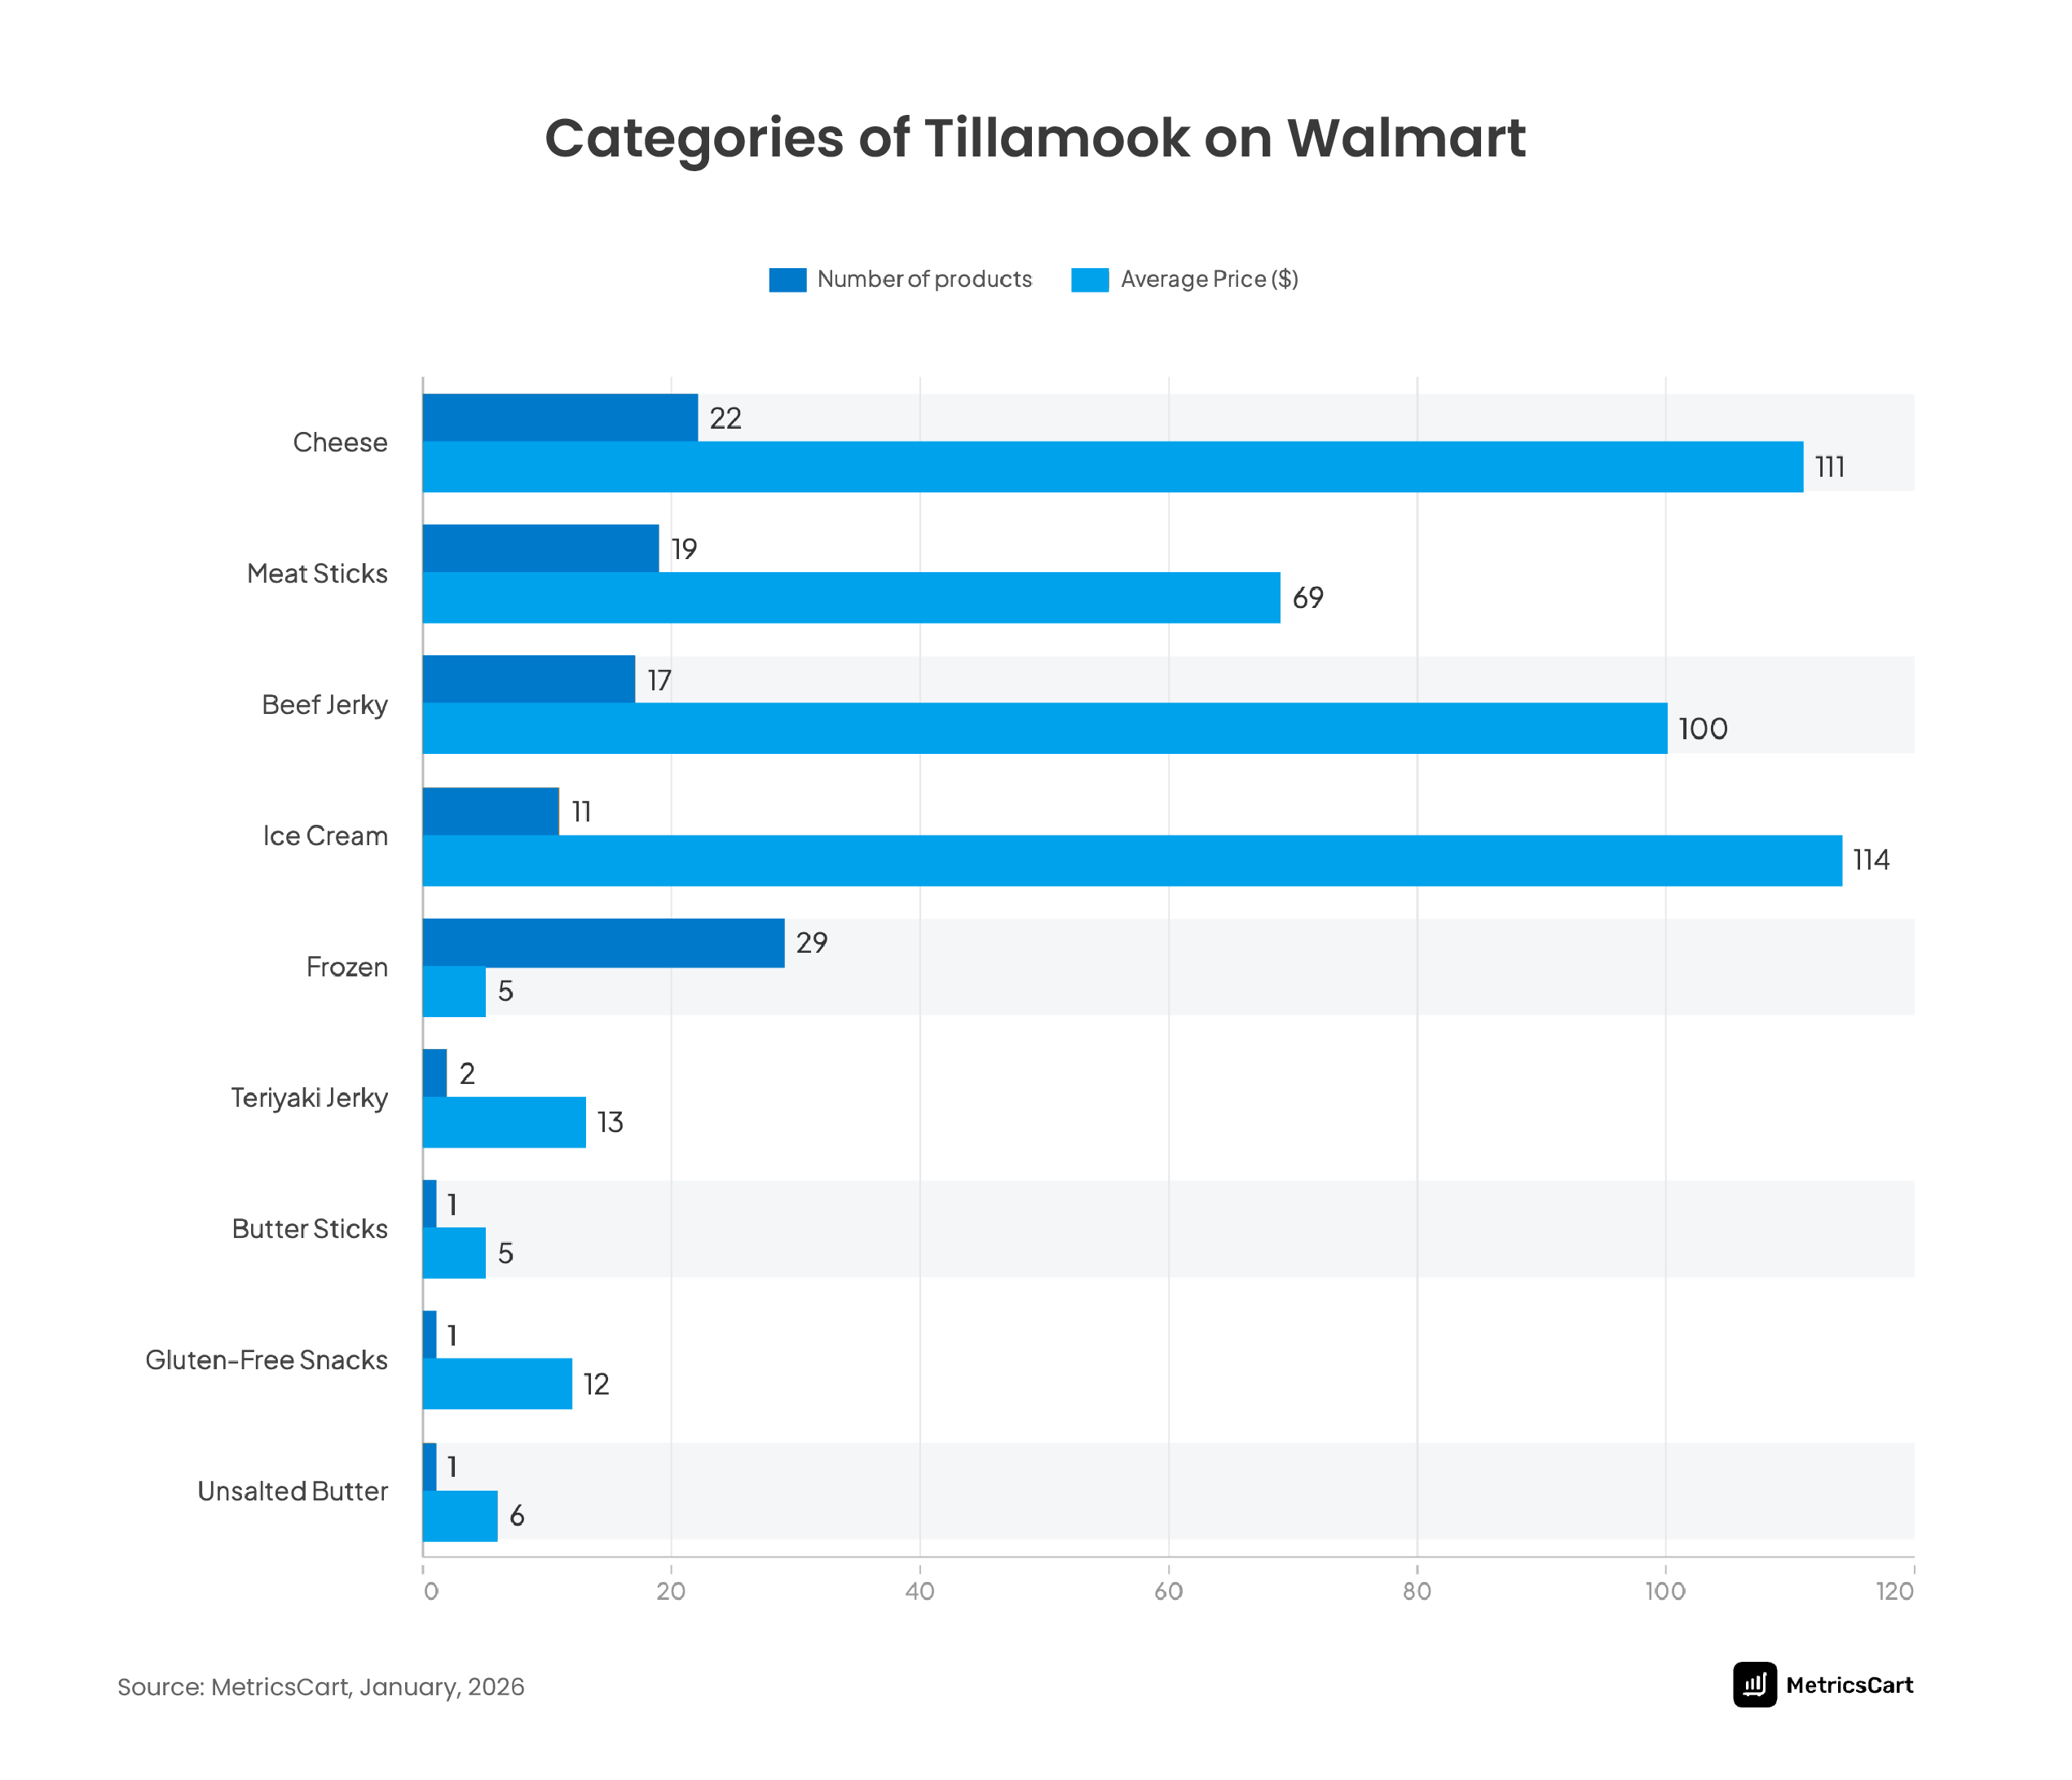
Walmart follows a more balanced assortment strategy. Cheese remains the largest category, but the platform has stronger visibility across meat sticks, beef jerky, butter, and ice cream, creating a broader household grocery shelf instead of a search-heavy marketplace.
Ice cream stands out because it has fewer SKUs but one of the highest average prices, showing premium positioning rather than volume-led sales. This suggests Walmart is a stronger platform for larger basket purchases and higher-value dairy products.
READ MORE | Grocery & Gourmet 2025: The Year in Amazon Bestsellers
Which is Cheaper: Amazon or Walmart for Tillamook?
| Price Range | Amazon | Walmart |
| Lowest Listed Price | $1.50 (Pepperoni Stick, 1.44 oz) | $3.00 (Cream Cheese Brick, 8 oz) |
| Affordable Range Ceiling | $4.70 | $5.60 |
| % of SKUs Priced Under $50 | 73% | 54% |
| Top Affordable Categories | Pepperoni, Cheese | Cheese, Butter, Ice Cream |
| Most Expensive Single SKU | $289 (Cheddar Cheese, 5 lb × 6 cases) | $300 (Beef Jerky, Pack of 48) |
Despite Walmart’s lower-price reputation, MetricsCart’s analysis finds Amazon carries 73% of Tillamook SKUs under $50, compared to 54% on Walmart.
Plus, the lowest price range falls between $1.5 and $4.7, making Amazon the stronger platform for impulse purchases and repeat-buy snack categories. This lower entry price improves:
- Conversion rates
- Sponsored Product efficiency
- Review generation
- Organic ranking performance
Walmart shows the opposite pattern. While affordable Tillamook products are still available, especially across cheese, butter, and ice cream, the entry price range is slightly higher at $3 to $5.6, already above Amazon’s lower threshold.
The bigger difference appears at the premium end. Walmart hosts the highest-priced Tillamook products in the report, with premium listings ranging from $139 to $300, mainly across bulk dairy packs, cheese, and jerky products
This suggests Walmart functions as Tillamook’s stronger premium shelf, where larger pack sizes and higher-value purchases are more common.
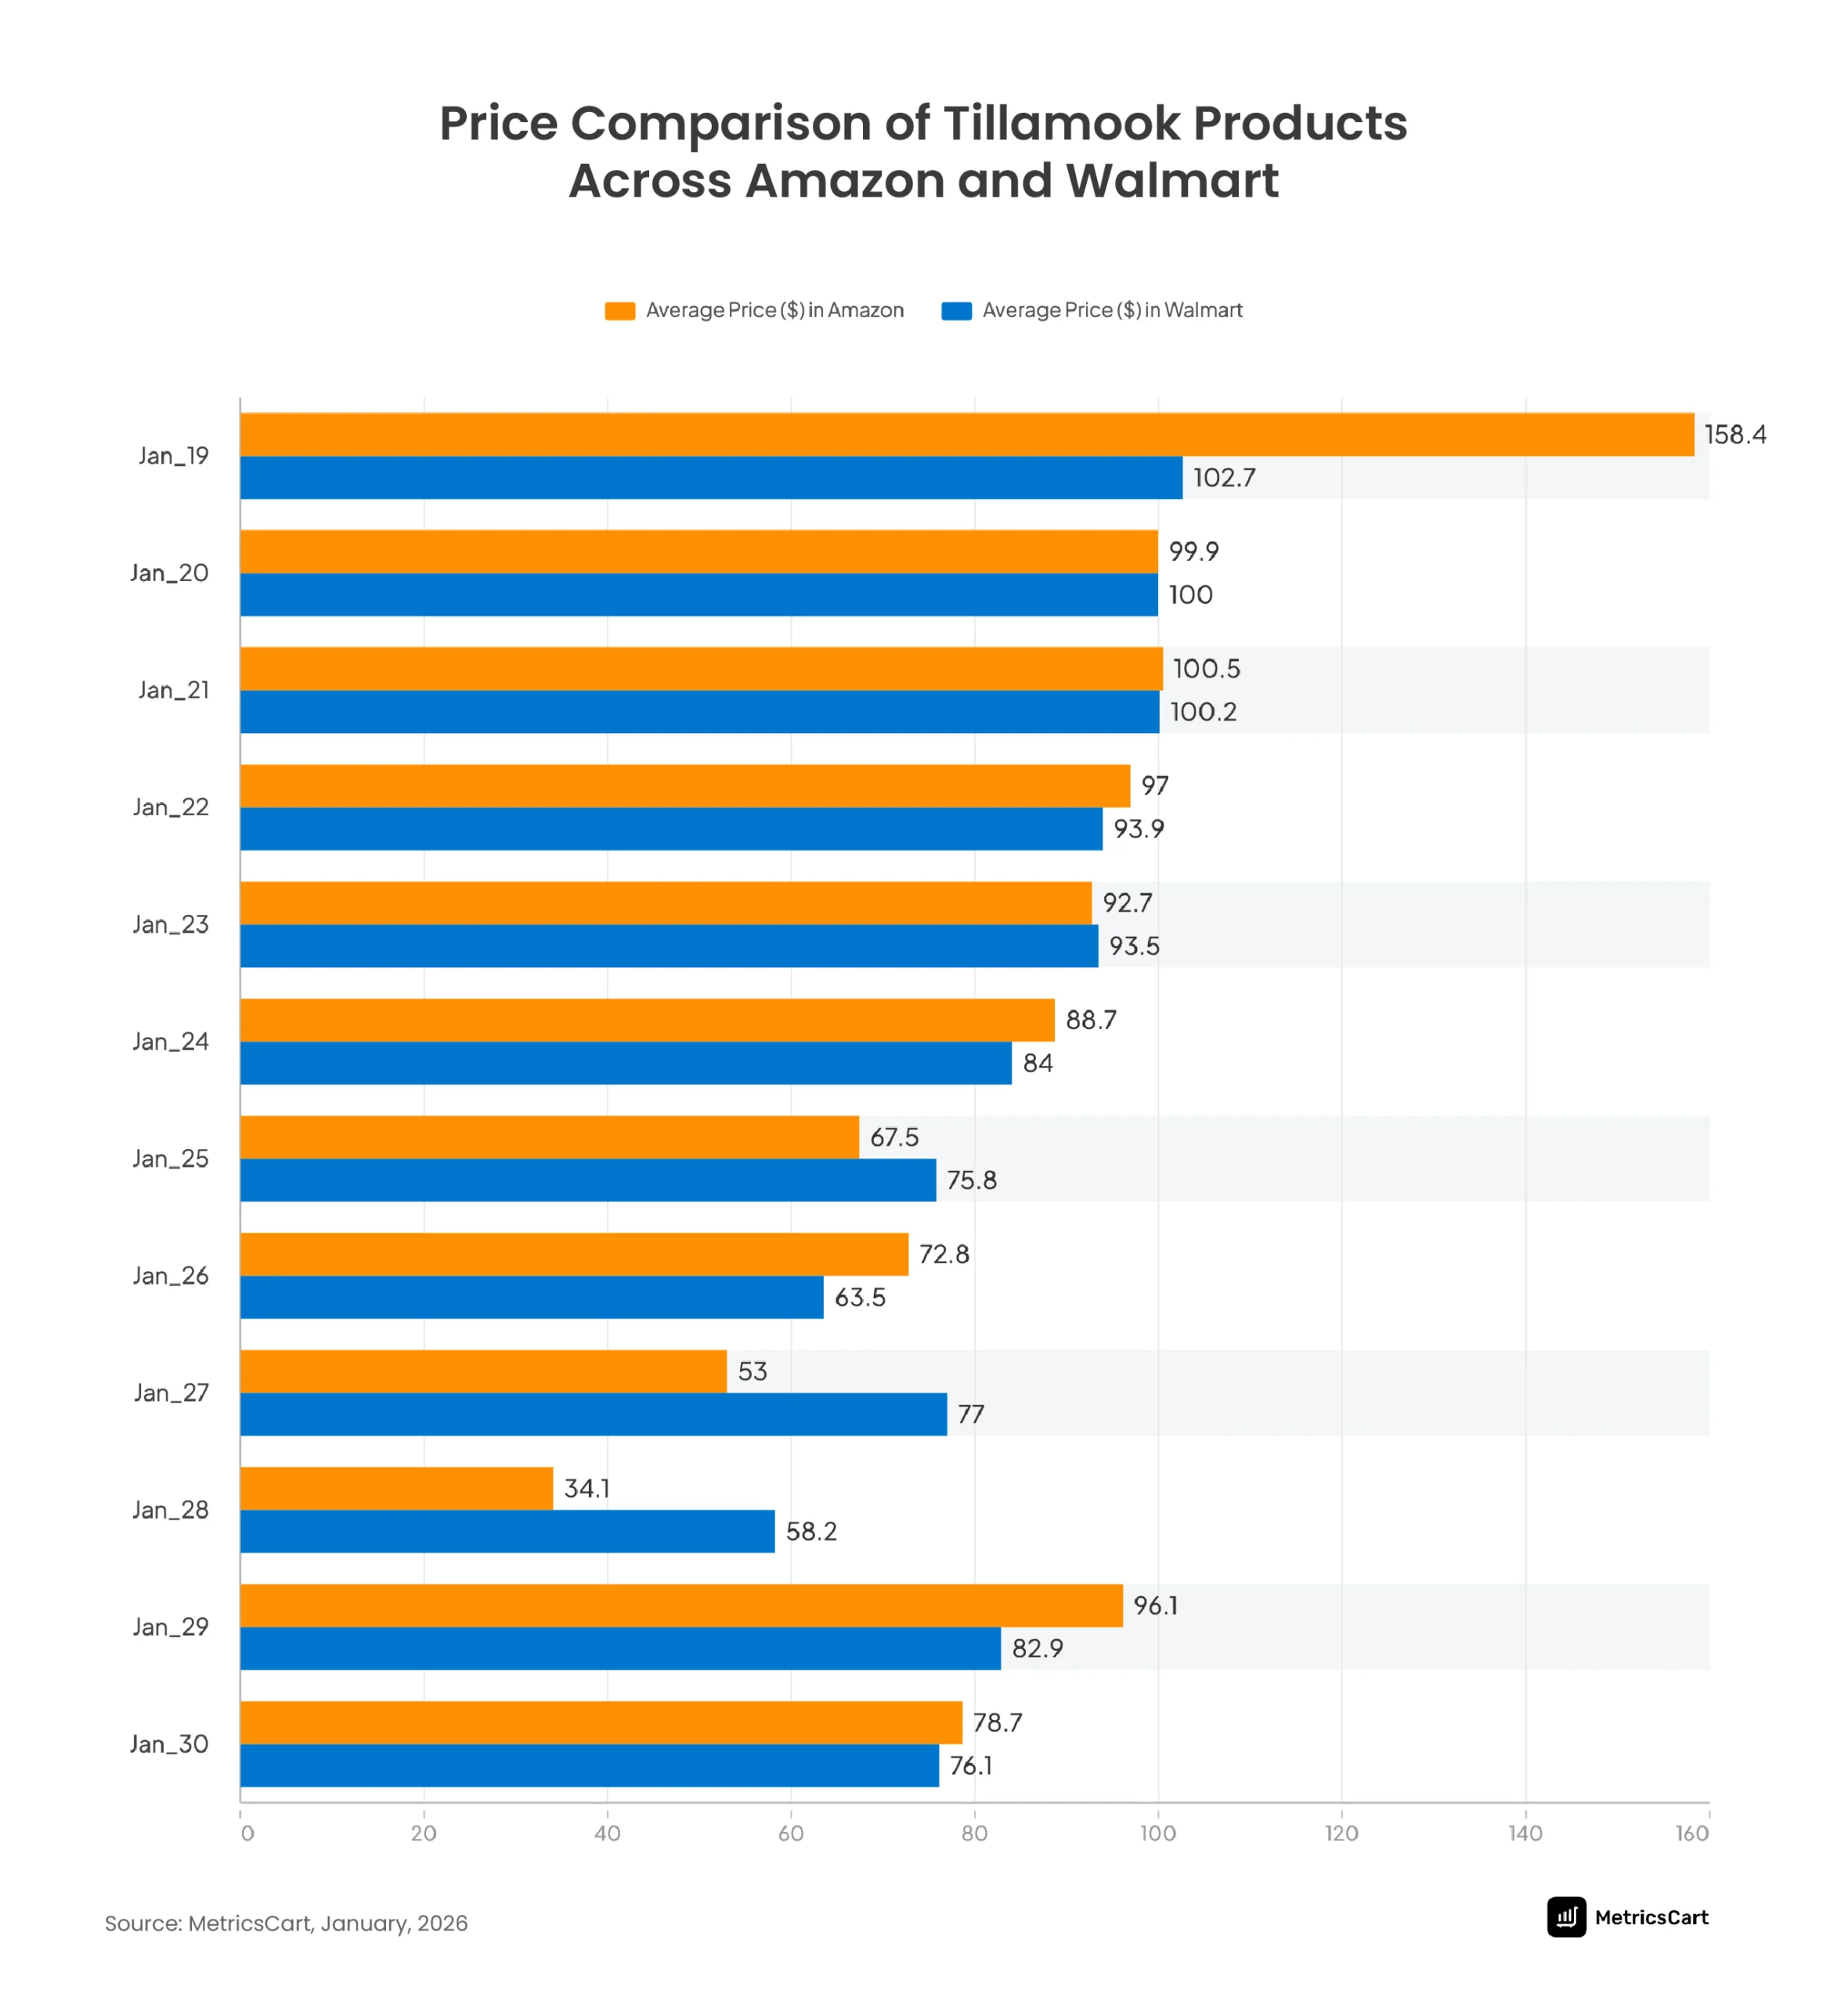
The average price comparison supports this clearly:
- Amazon average price: $73.80
- Walmart average price: $91.45
That is not a small gap. Walmart’s average Tillamook listing is roughly 24% more expensive than that of Amazon.
And this pricing pattern also reflects how Tillamook uses each retailer differently. Amazon is optimized for accessibility, repeat purchases, and search-driven conversion. Walmart is optimized for premium positioning, controlled assortment, and larger household purchases.
READ MORE | Price Matching on Amazon vs. Walmart: What Every Brand and Seller Should Know
What are the Best Tillamook Products to Buy: What Shoppers Are Actually Saying
Review volume is one of the most reliable proxies for purchase frequency available on public-facing digital shelf data. While it does not capture repurchase rate, basket attachment, and promotional lift, it does tell you, at scale, which SKUs shoppers are returning to and rating.
Most Reviewed Tillamook Products on Amazon and Walmart
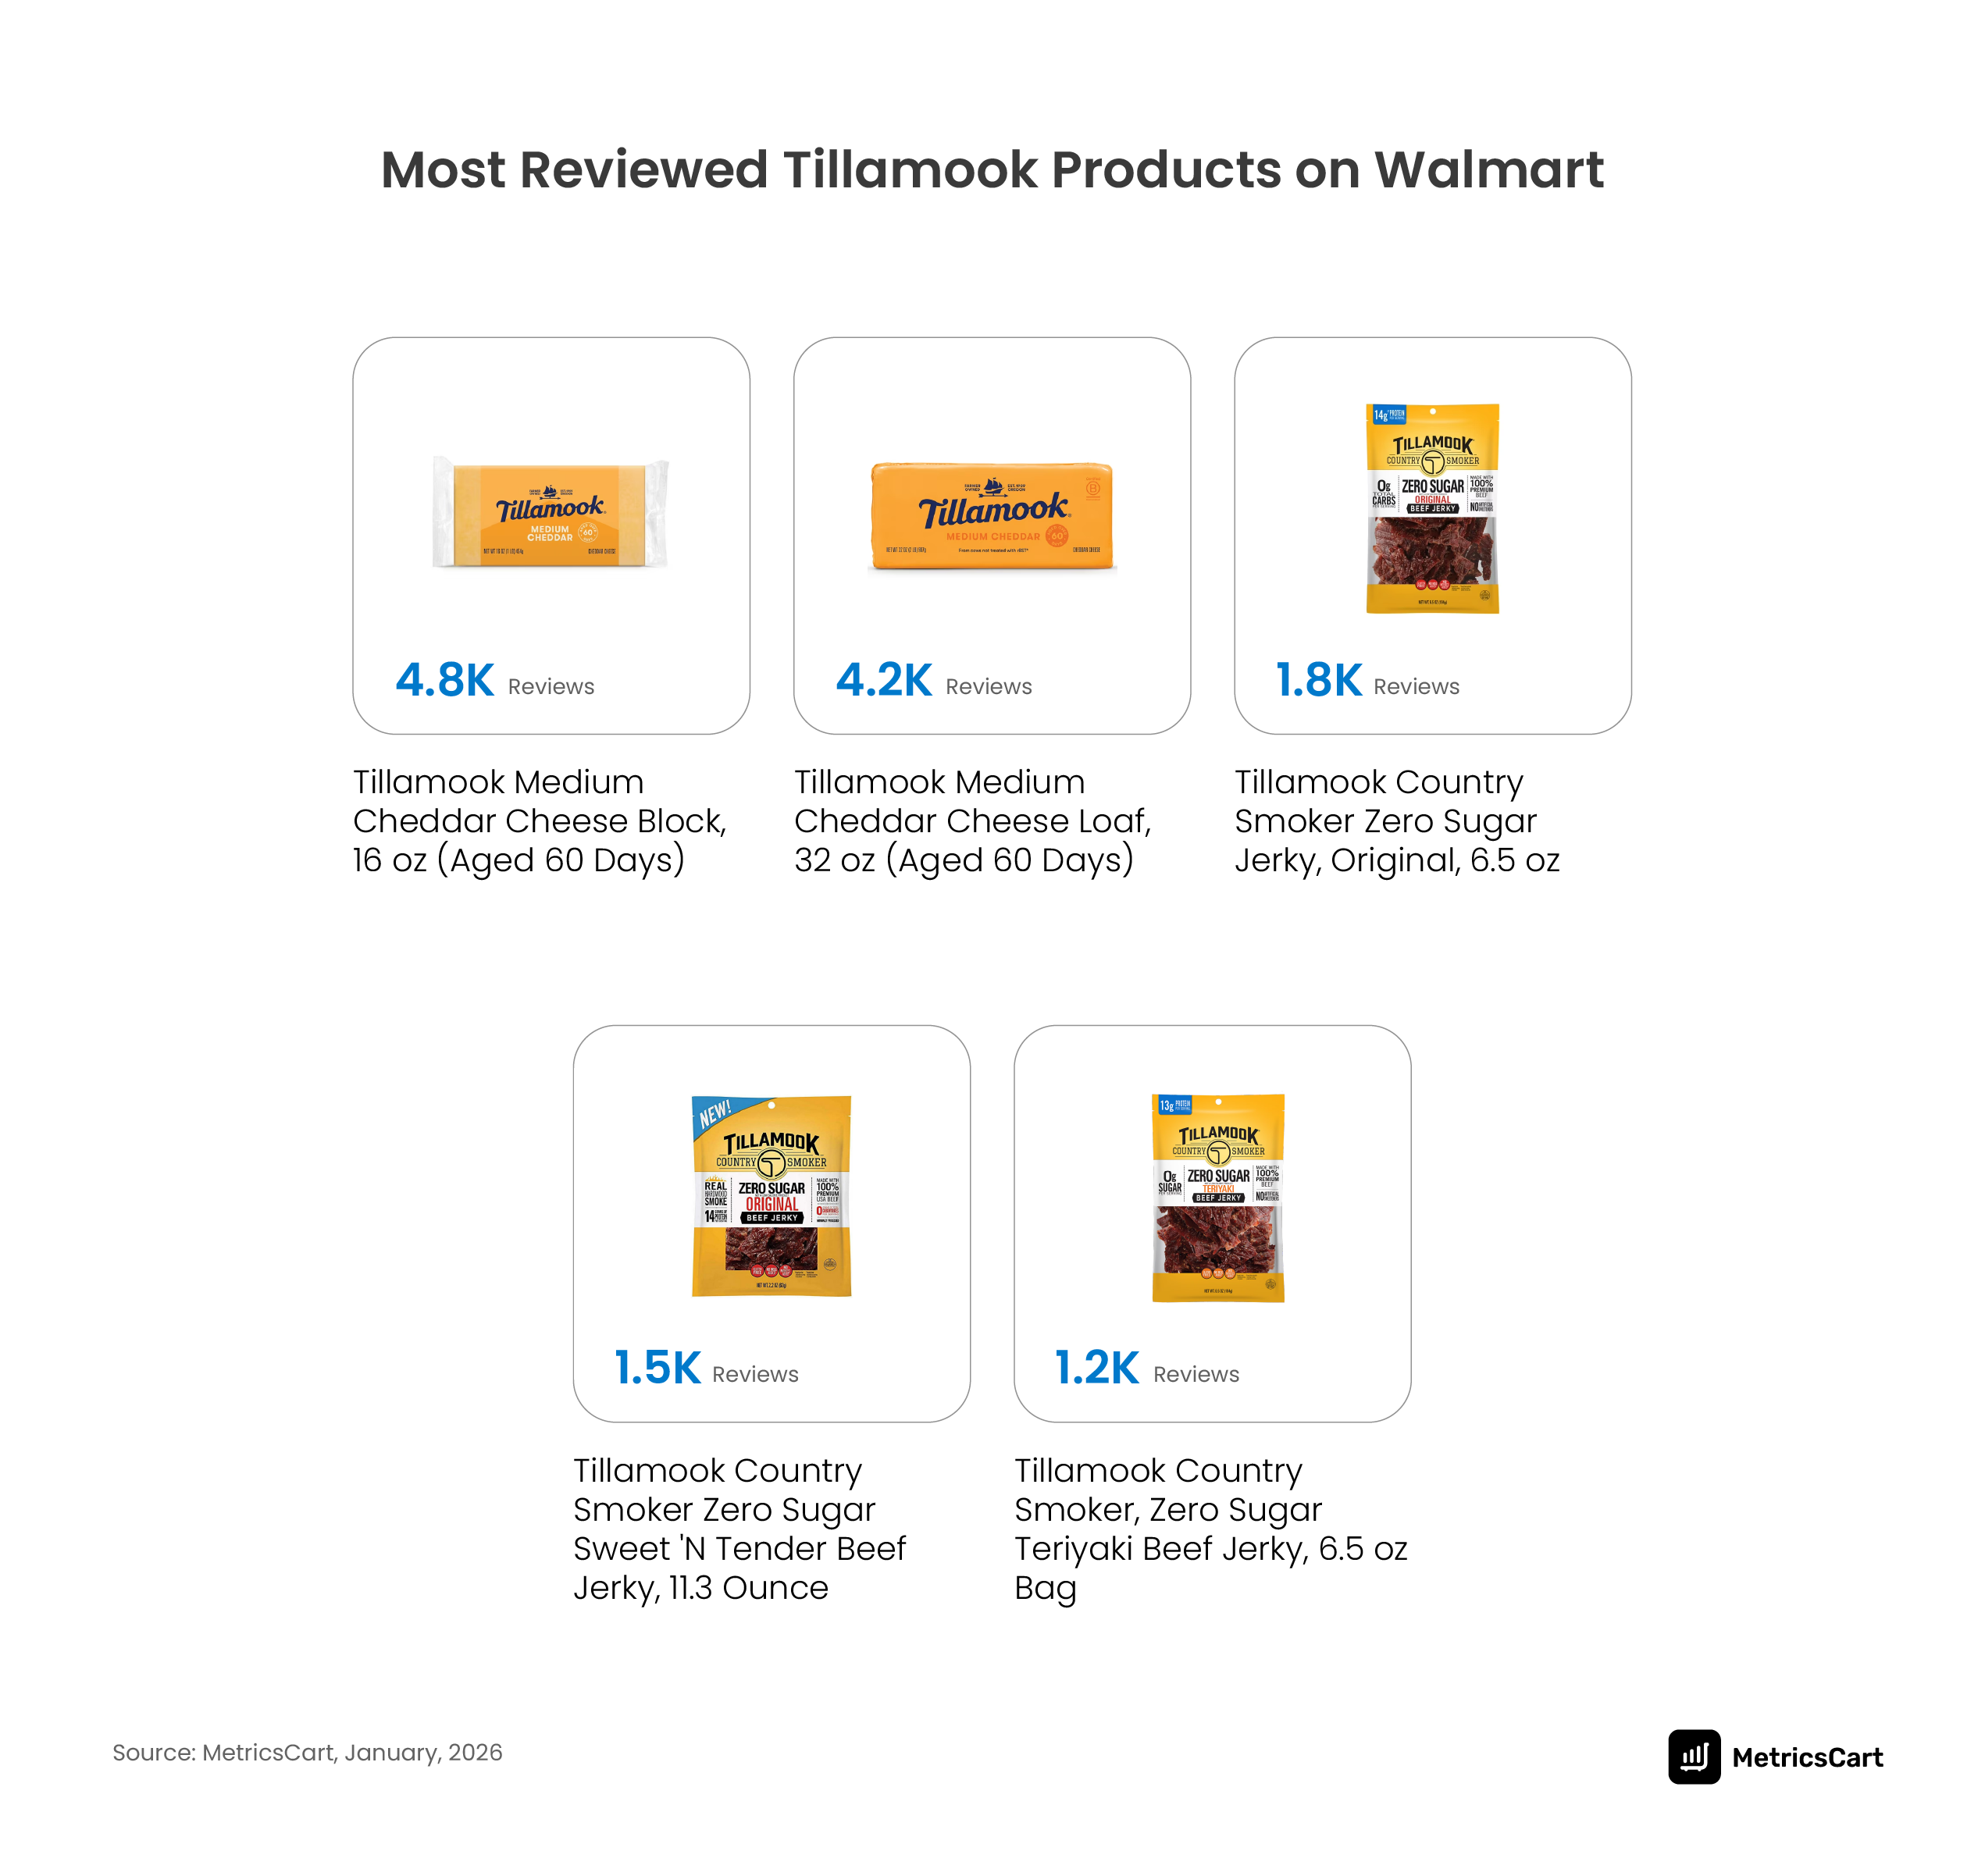 As per the review analysis done using MetricsCart Ratings and Review Analysis platform, the most-reviewed products on Amazon are mainly meat snacks such as beef jerky, smoked sausages, and meat sticks, not cheese products.
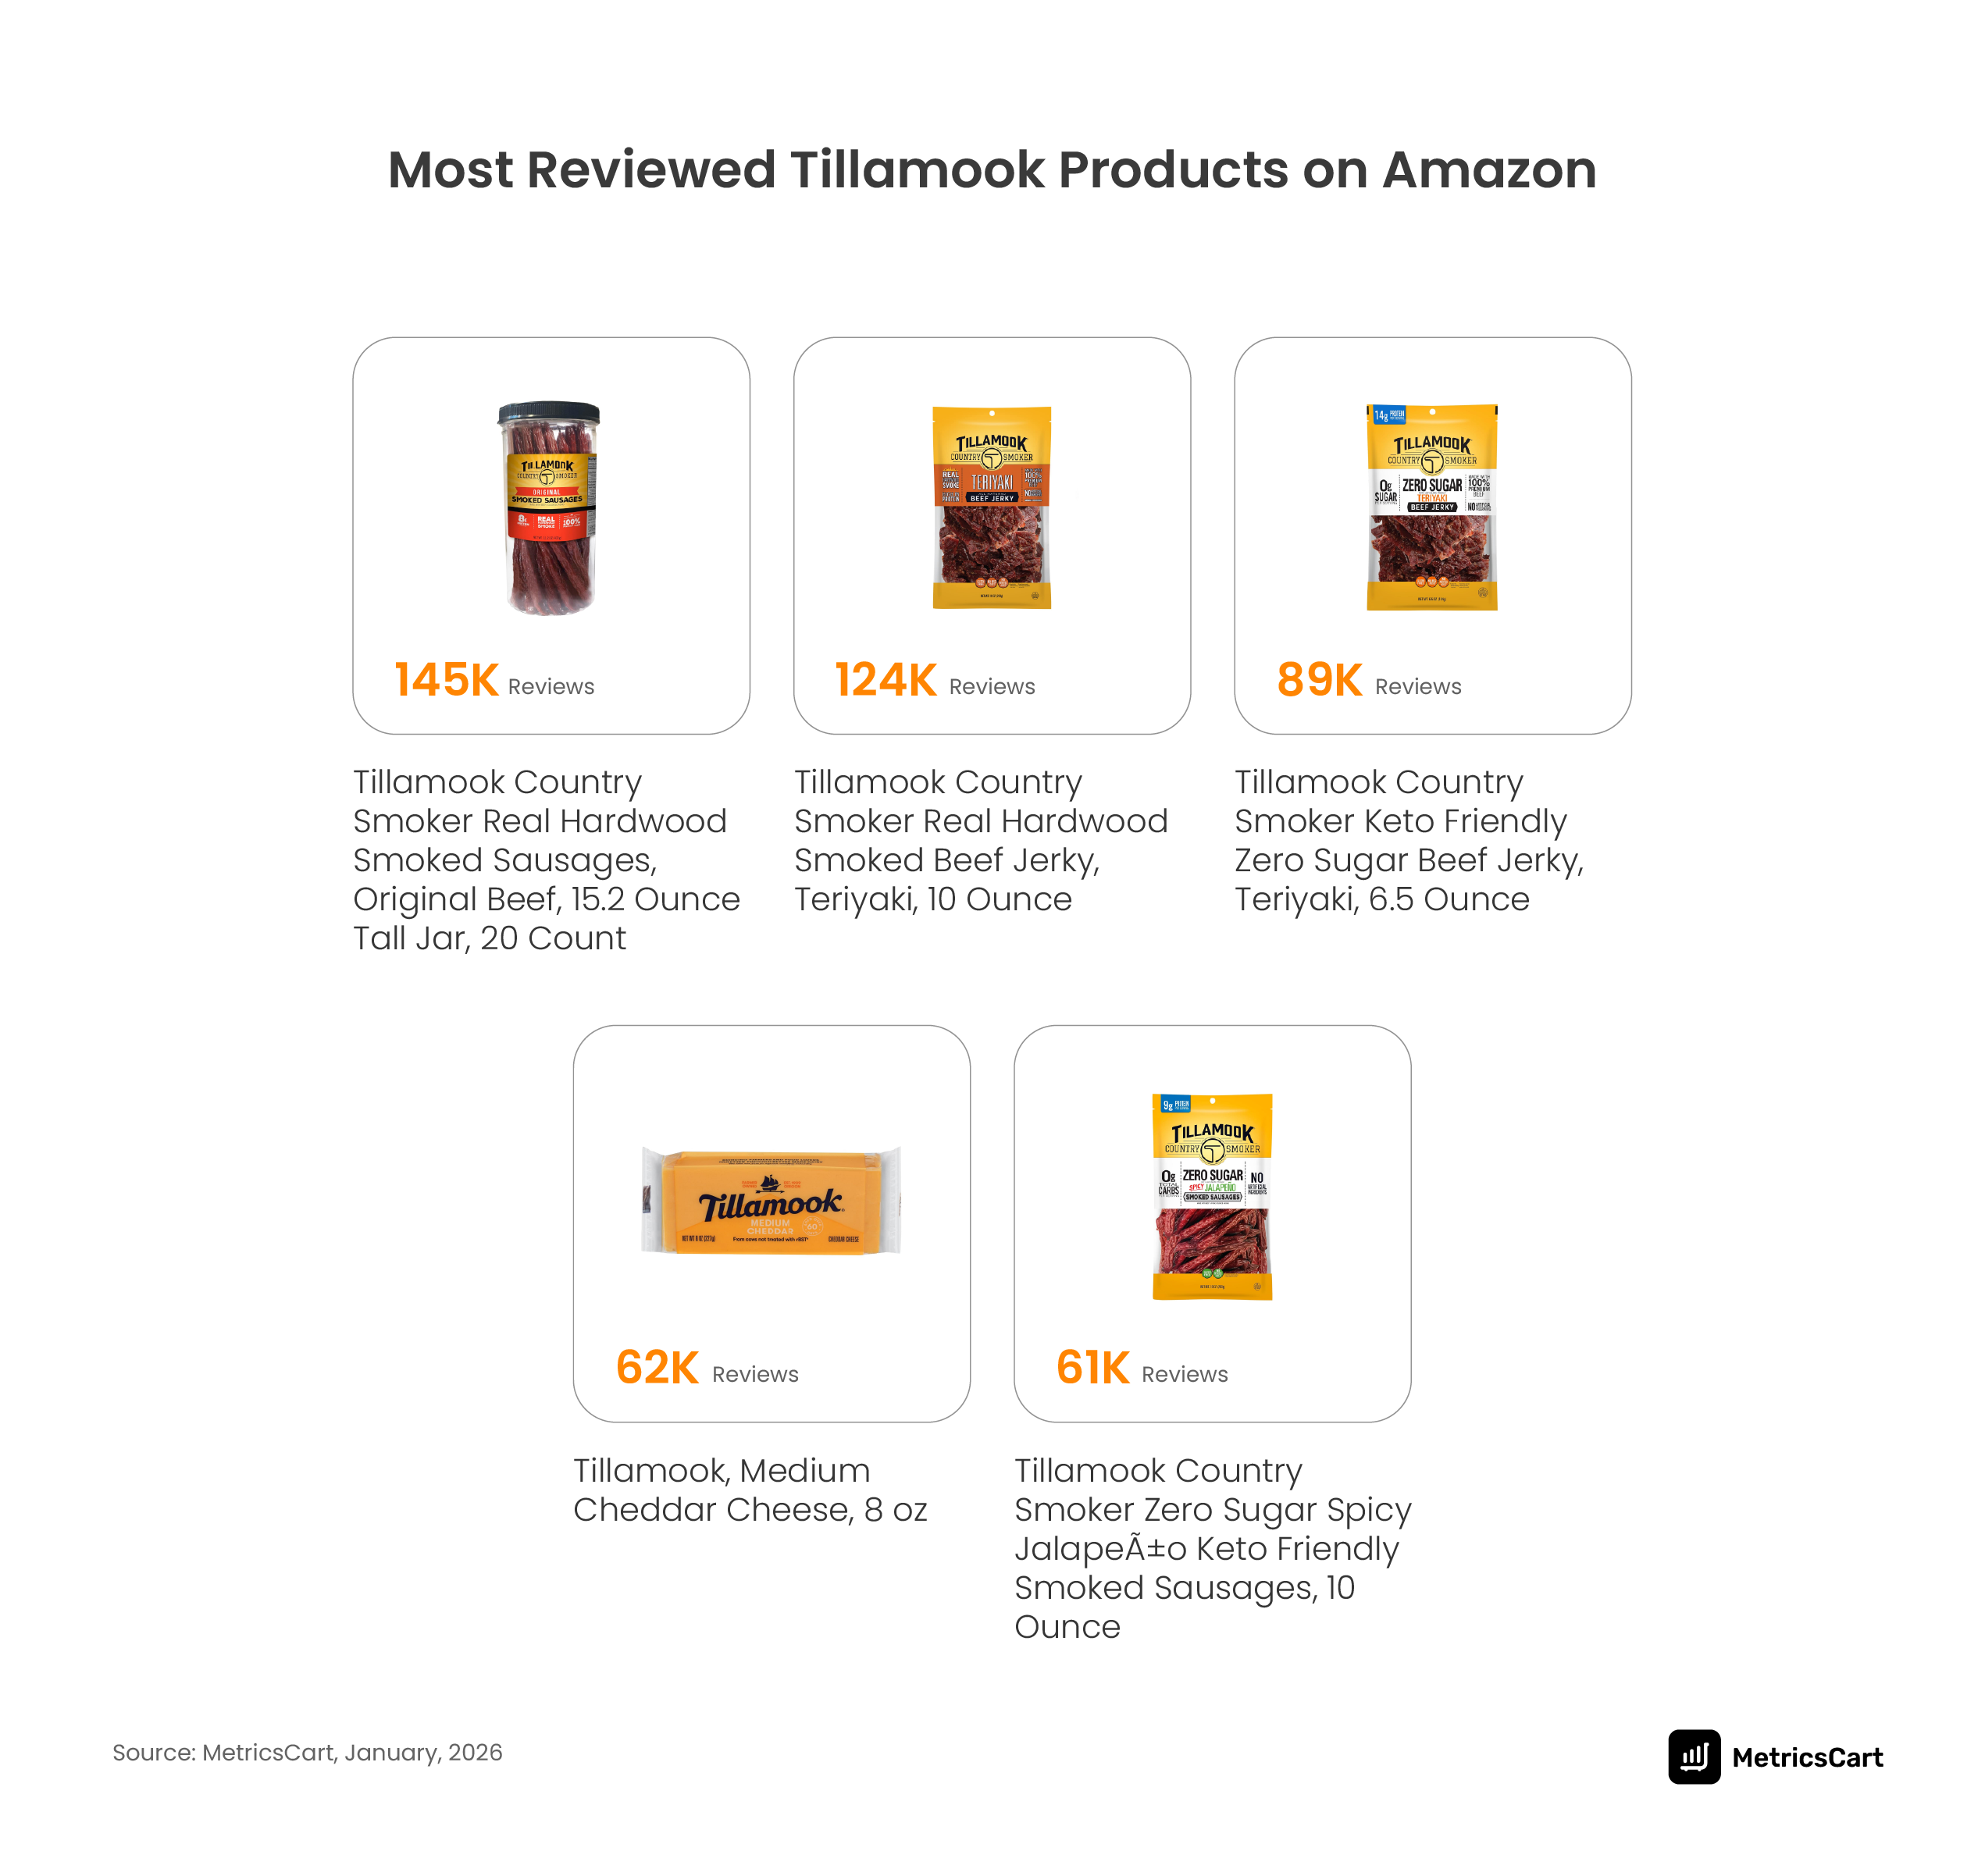
This is a strong platform signal because Tillamook is widely recognized as a cheese brand, but Amazon shoppers are buying more snackable, repeat-purchase products from the brand. This confirms that Amazon works more like a high-frequency snacking channel, where convenience and repeat buying drive both reviews and search visibility.
Meanwhile, on Walmart, the most-reviewed products are mostly cheese products, which aligns with Tillamook’s core brand identity. Shoppers at Walmart are behaving more like grocery buyers, purchasing cheese and dairy products as part of planned household shopping rather than quick snack replenishment.
Tillamook’s Retail Media Investment: Sponsored Product Strategy and Share of Search
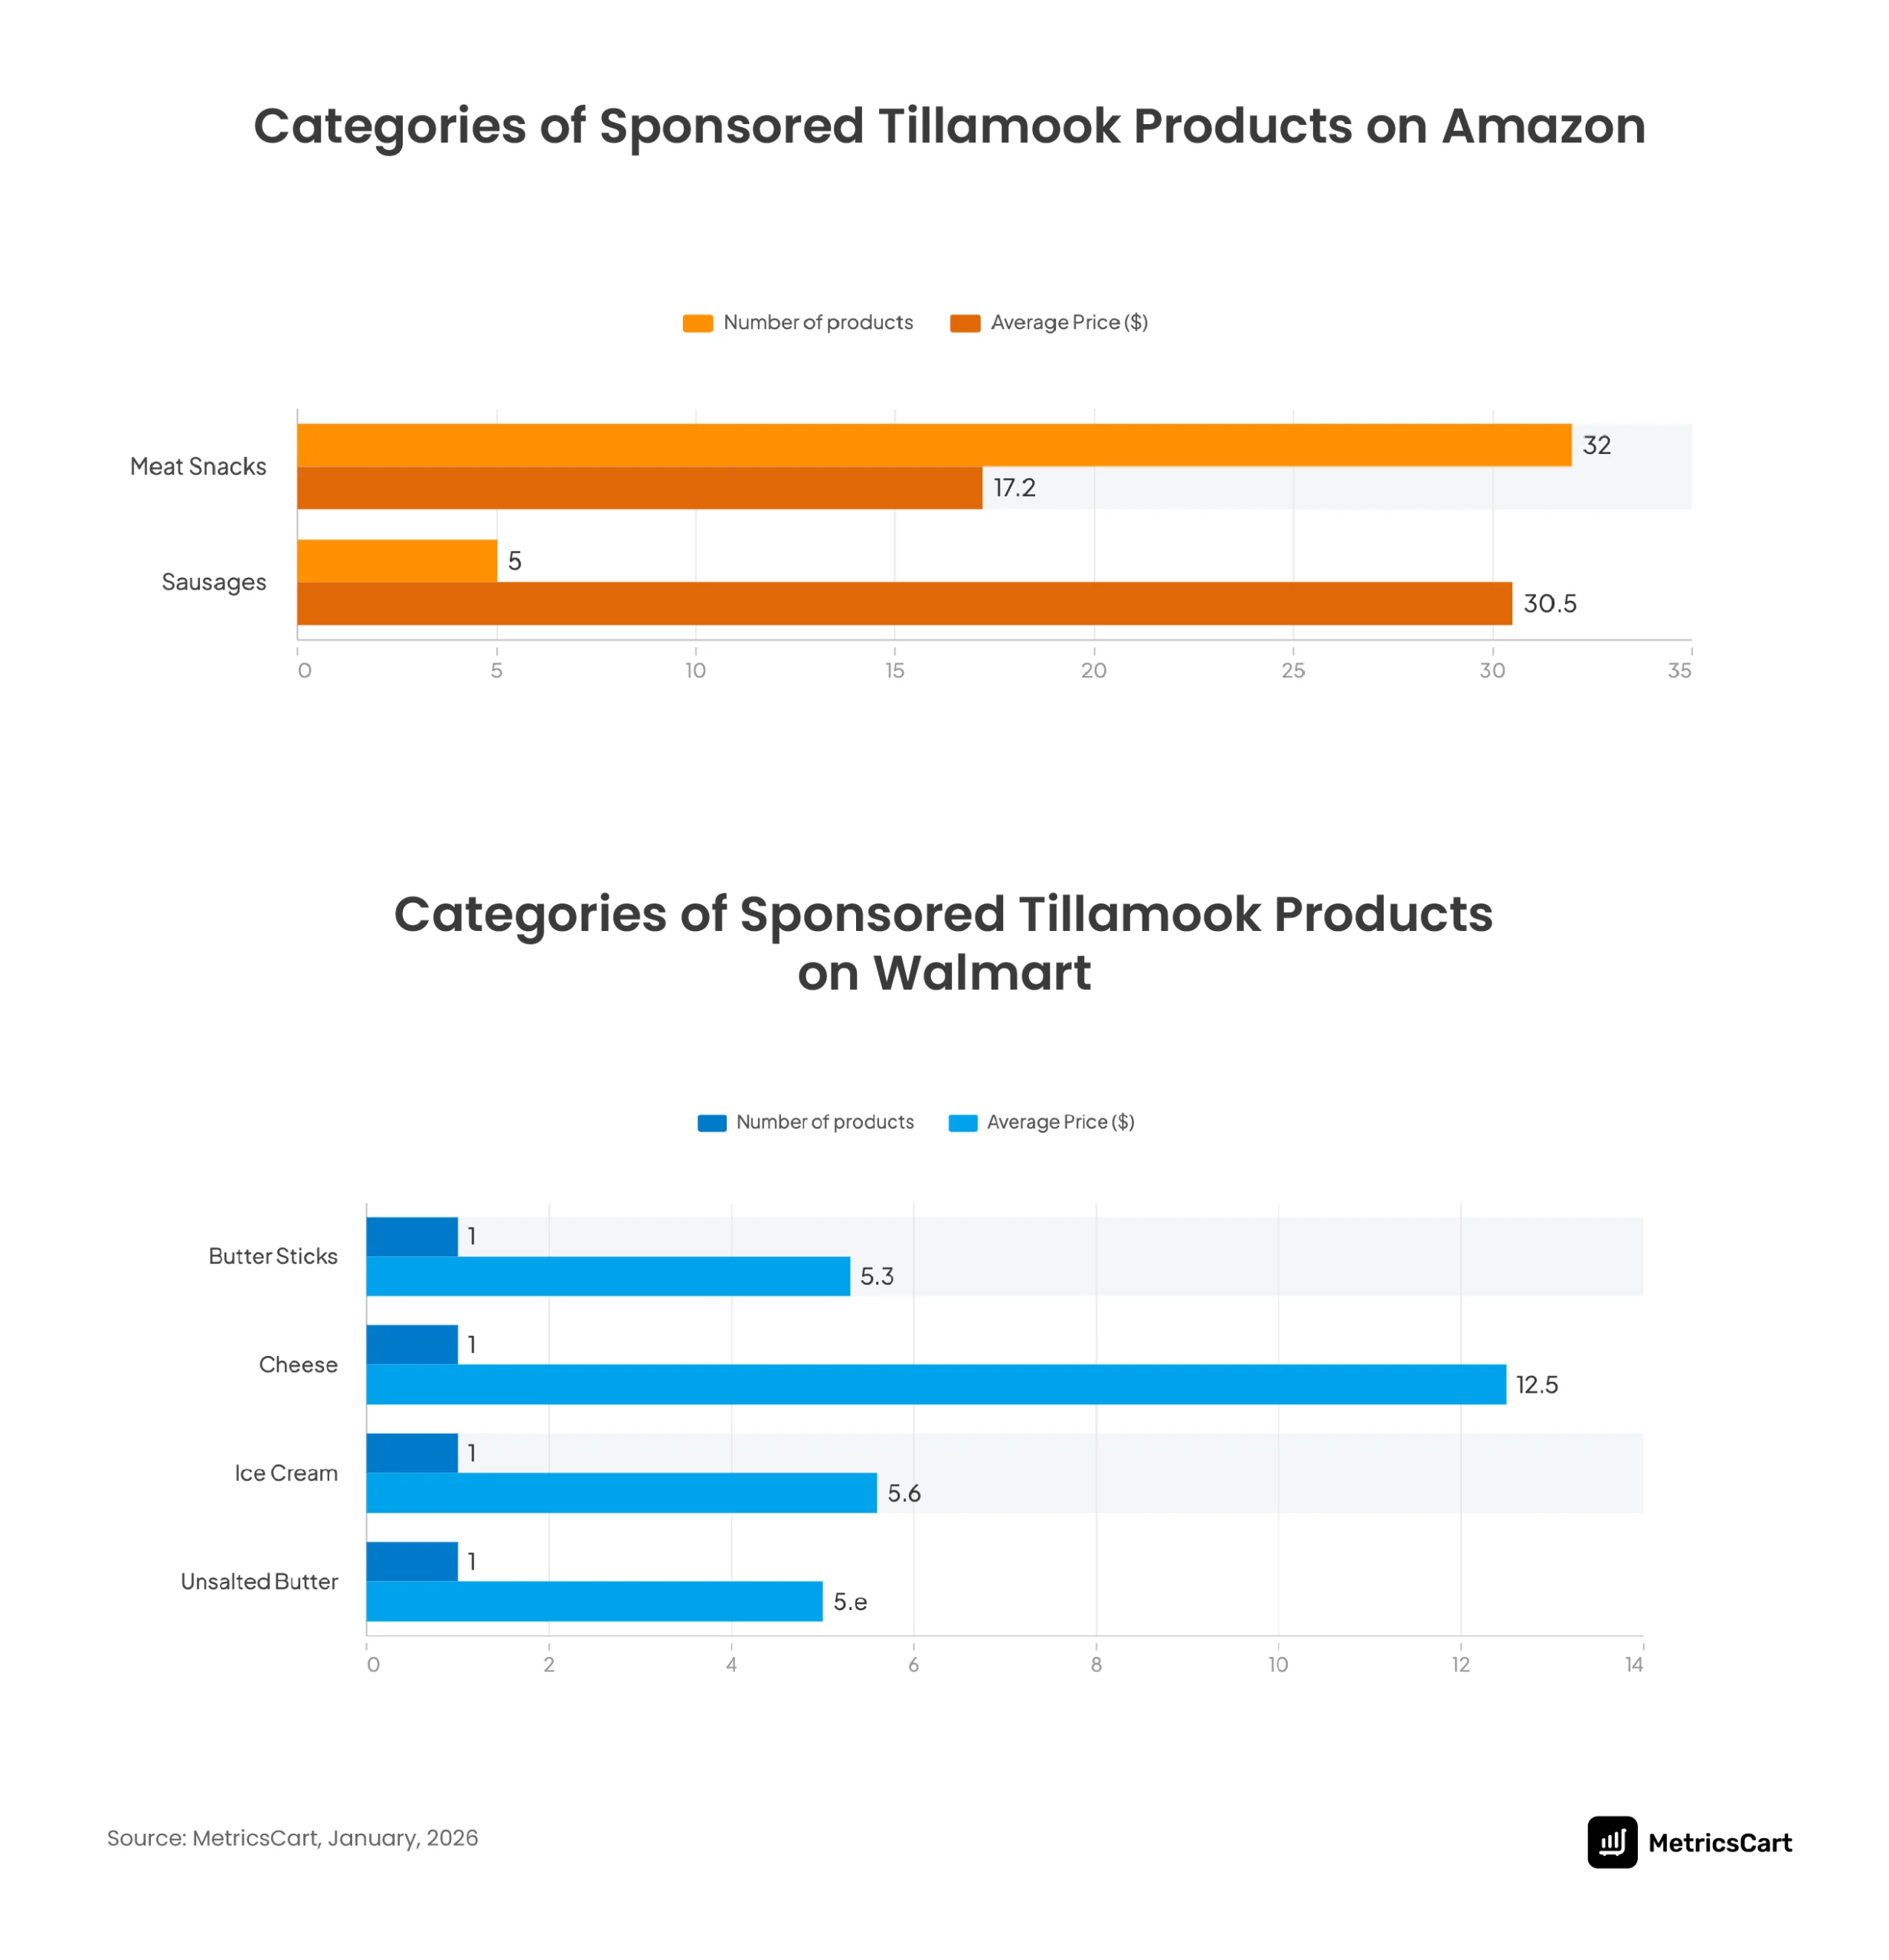
Sponsored product coverage is one of the clearest windows into a brand’s retail media strategy. Unlike organic rank, which accumulates over time, sponsored products reflect active budget allocation decisions made by the brand’s retail media team or agency. Here is what Tillamook’s coverage looks like.
READ MORE | Superpowered Ads: How Retail Media Networks Increase Brand Visibility Online
Amazon: 29% Sponsored Products
Of Tillamook’s 124 Amazon listings, 37 carry sponsored placement, meaning Tillamook is actively paying for search visibility on nearly one in three of its products. The category breakdown of those sponsored products tells a specific story:
- Meat Snacks: 32 sponsored SKUs, average price $17.20.
This is where the media budget is concentrated. Tillamook is spending to defend and expand its meat snack visibility on Amazon, not its cheese position.
- Sausages: 5 sponsored SKUs, average price $30.50.
Sponsored at a higher average price point, suggesting these are being promoted to a shopper willing to pay for premium pack sizes.
This is an offense-mode retail media strategy, where the brand is running sponsored ads for products in the highest-performing Amazon categories to accelerate velocity rather than to introduce or defend its brand-defining cheese range.
Walmart: Only 5% Sponsored Products
On Walmart, only 4 of 76 products carry sponsored placement. The categories those four products represent are:
- Butter Sticks (1 sponsored SKU, avg. $5.30)
- Cheese (1 sponsored SKU, avg. $12.50 — the highest-priced sponsored category on Walmart)
- Ice Cream (1 sponsored SKU, avg. $5.60)
- Unsalted Butter (1 sponsored SKU, avg. $5.30)
All four are dairy. All four are core Tillamook identity categories. With no sponsored presence in meat snacks or newer categories, Tillamook’s Walmart media spend focuses on maintaining search visibility for established products rather than expanding into new shopper segments.
Who Is Selling Tillamook: The Seller Landscape
Understanding who sells a brand on a marketplace is as important as understanding what they sell. Seller activity shapes pricing architecture, MAP compliance, and the end-to-end experience a shopper encounters before they ever add a product to their cart.
For Tillamook, the seller data across Amazon and Walmart tells two stories: a clean, well-anchored first-party picture, and a more complex third-party landscape with pricing patterns that deserve active attention.
| Sellers of Tillamook Products on Walmart | ||
| Seller | SKUs Listed | Avg. Price |
| Walmart.com | 30 | $12 |
| Overstock Drugstore | 28 | $106 |
| Food Service Direct | 11 | $138 |
| Courage Consulting | 2 | $56 |
| RocketDSD | 2 | $95 |
| Atmada Nutrition | 1 | $112 |
| Gourmet Dash | 1 | $101 |
| UsaVitamins | 1 | $20 |
First-Party Sellers: Price Anchors Holding Firm
The first-party picture is clean and consistent. Walmart.com leads Walmart by volume (30 SKUs, avg. $12) and Amazon.com leads Amazon by volume (59 SKUs, avg. $11). Both platforms’ owned sellers price at the low end, functioning as price anchors that set shopper expectations for the brand’s everyday value.
| Sellers of Tillamook Products on Amazon | ||
| Seller | SKUs Listed | Avg. Price |
| Amazon.com | 59 | $11 |
| University Gifts (US Company) | 21 | $124 |
| FoodserviceDirect Inc. | 9 | $137 |
| Ice Cream Source | 6 | $129 |
| AmazonFresh | 4 | $5 |
| AmazingAHF | 3 | $40 |
| Dads Deals NC | 2 | $20 |
| Eternity Essentials | 2 | $94 |
| Cheese Delicatessen | 1 | $110 |
Third-Party Sellers: Where Pricing Gets Complicated
The most notable pattern here involves Food Service Direct. This single seller lists Tillamook products at an average of $138 on Walmart and $137 on Amazon, a cross-platform price gap of just $1.
That near-identical premium pricing, maintained simultaneously across two competing retail platforms, is not coincidental. It is characteristic of a bulk-format or foodservice distributor operating across both marketplaces through a centralized pricing model.
On its own, that is not necessarily a compliance violation. But it is a structural risk. When a third-party seller consistently lists a brand’s products at a significant premium above first-party pricing and does so across multiple platforms at once, it gradually creates a secondary price perception for that brand.
Shoppers who encounter Food Service Direct’s listings before finding Walmart.com or Amazon.com’s anchor pricing may calibrate their expectations around the higher number. Over time, that erodes the pricing clarity the brand worked to establish.
A second pattern worth flagging is University Gifts (US Company) on Amazon, which holds 21 listings at an average price of $124. That is a meaningful volume of high-priced SKUs from a seller whose storefront name carries no food retail signal.
For Tillamook’s category managers, this is exactly the kind of seller activity that warrants investigation: not because the listings are necessarily in violation, but because unauthorized or loosely authorized distributors at this price point and volume can quietly undercut brand positioning without triggering any obvious compliance alert.
Closing the pricing gap requires visibility before it requires action. Brands need to know, on a daily basis, which sellers are active, what they are charging, how that pricing compares across platforms, and whether their listing volume is growing. That level of seller intelligence, i.e, tracking authorization status, price alignment, and SKU-level activity across Amazon, Walmart, and beyond, is precisely what MetricsCart’s MAP Monitoring and Enforcement is built to deliver. Most Minimum Advertised Price(MAP) violations and seller drift issues do not announce themselves. They accumulate quietly, listing by listing, until they are visible in pricing data that is already weeks old. MetricsCart surfaces them in real time, so brand teams can act on seller behavior as it happens, not after it has already shaped shopper perception.
READ MORE | MAP Compliance Monitoring: How It Helps Brands Navigate Price Matching Issues
What CPG Brands Can Learn from Tillamook’s Digital Shelf
The findings across assortment, pricing, retail media, and seller landscape point to three strategic lessons that apply well beyond Tillamook.
1. Platform Behavior ≠ Brand Identity
Tillamook’s brand heritage is built on cheese. However, its most reviewed, most purchased, and most sponsored products on Amazon are meat snacks. That means a brand manager optimizing Tillamook’s Amazon presence based on brand identity, prioritizing cheese visibility and cheese search terms, will misallocate effort and budget.
Brands must consider platform behavior, as revealed by review velocity and sponsored placement patterns, as the more reliable guide to where a platform’s shoppers have decided a brand lives. Compete on that basis, not on what the brand says it is.
2. Retail Media Gap = Share of Voice Gap
A 9x difference in sponsored product coverage between Amazon and Walmart is not a nuance. It is a competitive opening.
Any dairy or snack brand with Walmart ambitions looking at Tillamook’s Walmart search real estate right now is looking at a platform where the category leader has chosen not to aggressively defend its position with retail media.
That gap does not stay open forever. The brands that identify it through Share of Search monitoring and move into it systematically are the ones that will own those Walmart search positions when the data is reviewed six months from now.
3. Stability is a Strategy
Walmart’s flat 37–40 SKU count throughout the entire January monitoring period is not an accident. While Amazon’s listings fluctuated between 13 and 83, a swing driven by inventory events, listing activity, and one significant Out-of-Stock event on January 20, Walmart’s assortment held steady.
For brands managing channel conflict, that kind of stability signals deliberate assortment control: a curated, consistent shelf rather than an open marketplace listing free-for-all.
Building that discipline into Walmart’s assortment requires coordination between the brand team, the account team, and whoever is managing third-party seller activity, but the outcome is a more predictable, more controllable shelf position.
The analysis in this report was built using MetricsCart’s Digital Shelf Analytics platform, which tracks SKU availability, pricing movements, sponsored product coverage, seller activity, and review velocity daily across Amazon, Walmart, and 150+ other major retailers.
If you’re a brand manager, category lead, or retail media strategist, benchmarking your own digital shelf performance against brands like Tillamook, MetricsCart gives you that visibility in real time.
Track and Optimize Your Digital Shelf Before Competitors Claim It.