Market Size & Growth Trajectory
The global protein powder and supplements market has transitioned from a specialized sports nutrition product into a mainstream consumer lifestyle staple. Driven by surging health awareness, the adoption of active lifestyles, and shifting dietary habits toward high-protein diets, the market is experiencing strong global expansion.
- Current Market Value (2026): The global protein supplements market is valued between $20.1 billion and $29.87 billion, depending on the subcategory scope (powders alone vs. broader supplement formats).
- Future Forecast: The market is projected to reach between $33.4 billion and $63.54 billion by 2035.
- Compound Annual Growth Rate (CAGR): The market is expanding at a steady 5.8% to 8.72% CAGR.
- Regional Landscape: North America remains the dominant global market, holding roughly 40% to 50% of total revenue share, while the Asia-Pacific region (anchored by rapidly urbanizing fitness sectors in China and India) is on track to be the fastest-growing market.
E-Commerce Market: Amazon for Protein Brands
The e-commerce landscape has become the primary battleground for the category, capturing a massive portion of revenue. According to Digital Shelf Insights (DSI) from MetricsCart, the protein powder marketplace on Amazon is highly consolidated, heavily driven by social proof, and historically resilient in pricing:
- Massive Consumer Footprint: The protein powder category on Amazon commands over 50 million consumer reviews with a highly positive category average rating of 4.4 stars.
- Price Benchmarking: Category pricing remains remarkably stable online, with average prices fluctuating narrowly between $48.10 and $48.60, demonstrating strong price consistency on the digital shelf.
- Top Best-Selling Brands:
- Orgain: Leads the category performance with 15 products listed among Amazon’s best-sellers, capturing organic and plant-based demand.
- MuscleTech: Follows with 13 products in the best-seller tier, dominating the performance-centric sports nutrition market.
- The Power of Moats: Optimum Nutrition (owned by Glanbia Performance Nutrition) anchors the category with an unrivaled digital moat of over 11.3 million reviews, providing immense visibility and baseline trust.
Key Industry & Consumer Trends
1. The Rise of “Powerhouse Protein” & Everyday Wellness
Protein is no longer locked to the gym locker room. Industry data indicate that protein consumption is scaling globally as it expands into weight management, healthy aging, and satiety. It is increasingly viewed as an everyday macronutrient by non-athlete demographics and aging populations.
2. The GLP-1 Tailwinds & “Fibermaxxing”
The rising popularity of prescription GLP-1 weight-loss medications is heavily shifting nutrition habits. Patients on these regimens prioritize high-protein intake to preserve lean muscle mass alongside fiber for gut health. This has triggered a massive shift in consumer preference toward highly bioavailable protein supplements.
3. Animal vs. Plant Realignment
- Whey Dominance: Animal-based proteins (specifically whey) maintain over 45% of the overall market share, experiencing double-digit growth due to their complete amino acid profile and taste familiarity.
- Plant-Based Maturation: While pure plant-based growth has leveled off after its initial spike, whole-food plant alternatives (like pea protein and legumes) and hybrid blends (animal + plant) are emerging to win over clean-label seekers.
Strategic Growth Guide for Protein Powder Brands
If you are a protein powder brand navigating this hyper-competitive marketplace, your operations must be highly synchronized across five core pillars:
1. Pricing Strategy
Setting a premium retail price (e.g., $60+) is effective only if you can defend it. Your pricing strategy must prioritize MAP (Minimum Advertised Price) compliance. Online marketplaces are prone to algorithmic matching; if a single unauthorized third-party (3P) seller slashes prices, it can trigger an immediate, platform-wide downward spiral that erodes profit margins and ruins retail partnerships.
2. Marketing
- Targeting Broad Use-Cases: Move your creative assets away from traditional “hardcore bodybuilding.” Focus ad copy on functional benefits such as weight maintenance, muscle retention (supporting aging and GLP-1 demographics), and versatile daily macro routines.
- Review Accrual Flywheel: Given that category giants possess millions of reviews, allocating a portion of your marketing budget to post-purchase engagement programs and verified sampling is non-negotiable for building a baseline of organic conversion.
3. Distribution & Channel Mix
- Balanced Omnichannel Approach: While ecommerce accounts for over 80% of protein supplement revenues, a healthy mix is required. Use a Direct-to-Consumer (DTC) site to cultivate core community data, Amazon for scalable high-velocity fulfillment, and strategic brick-and-mortar retail (GNC, specialty health channels) to anchor mainstream credibility.
- Quick Commerce (Q-Comm): Brands must prepare layouts for rapid-delivery integrations (e.g., rapid grocery apps) to capture instant-need fulfillment among busy consumers seeking meal replacements or post-workout solutions.
4. R&D / Product Development
- Clean Label & Functional Filtering: Focus product development on allergen-friendly (Gluten-Free) and lifestyle-compatible (Keto/Low Carb) attributes, as these dictate modern digital search queries.
- Flavor Familiarity First: Innovate conservatively on flavors. Consumer data show that while exotic variations drive temporary social media buzz, standard profiles (Vanilla and Chocolate) capture the overwhelming majority of repeat-purchase behavior.
5. Supply Chain
- Hedging Commodity Volatility: Whey, soy, and plant protein inputs are subject to severe price volatility due to environmental, climate, and agricultural pressures. Supply chain leaders must utilize multi-geographic sourcing and long-term procurement contracts to preserve margin stability.
Why Digital Shelf Tools Serve as Growth Infrastructure
Managing an online brand blind to real-time marketplace shifts is a fast track to margin degradation. Digital shelf intelligence acts as vital operational infrastructure in the following ways:
Real-Time Price Erosion Defense
Rogue third-party (3P) sellers frequently exploit automated pricing loops to bypass pricing agreements. Digital shelf analytics act as an automated radar system to identify these infractions before they permanently degrade your positioning.
Case Study (Premier Protein): A snapshot of Premier Protein’s performance on Amazon highlights exactly how damaging unmonitored 3P activity can be. Across their core liquid and powder items, several premium SKUs are facing critical price erosion due to intense unauthorized 3P competition undercutting the brand’s intended value:
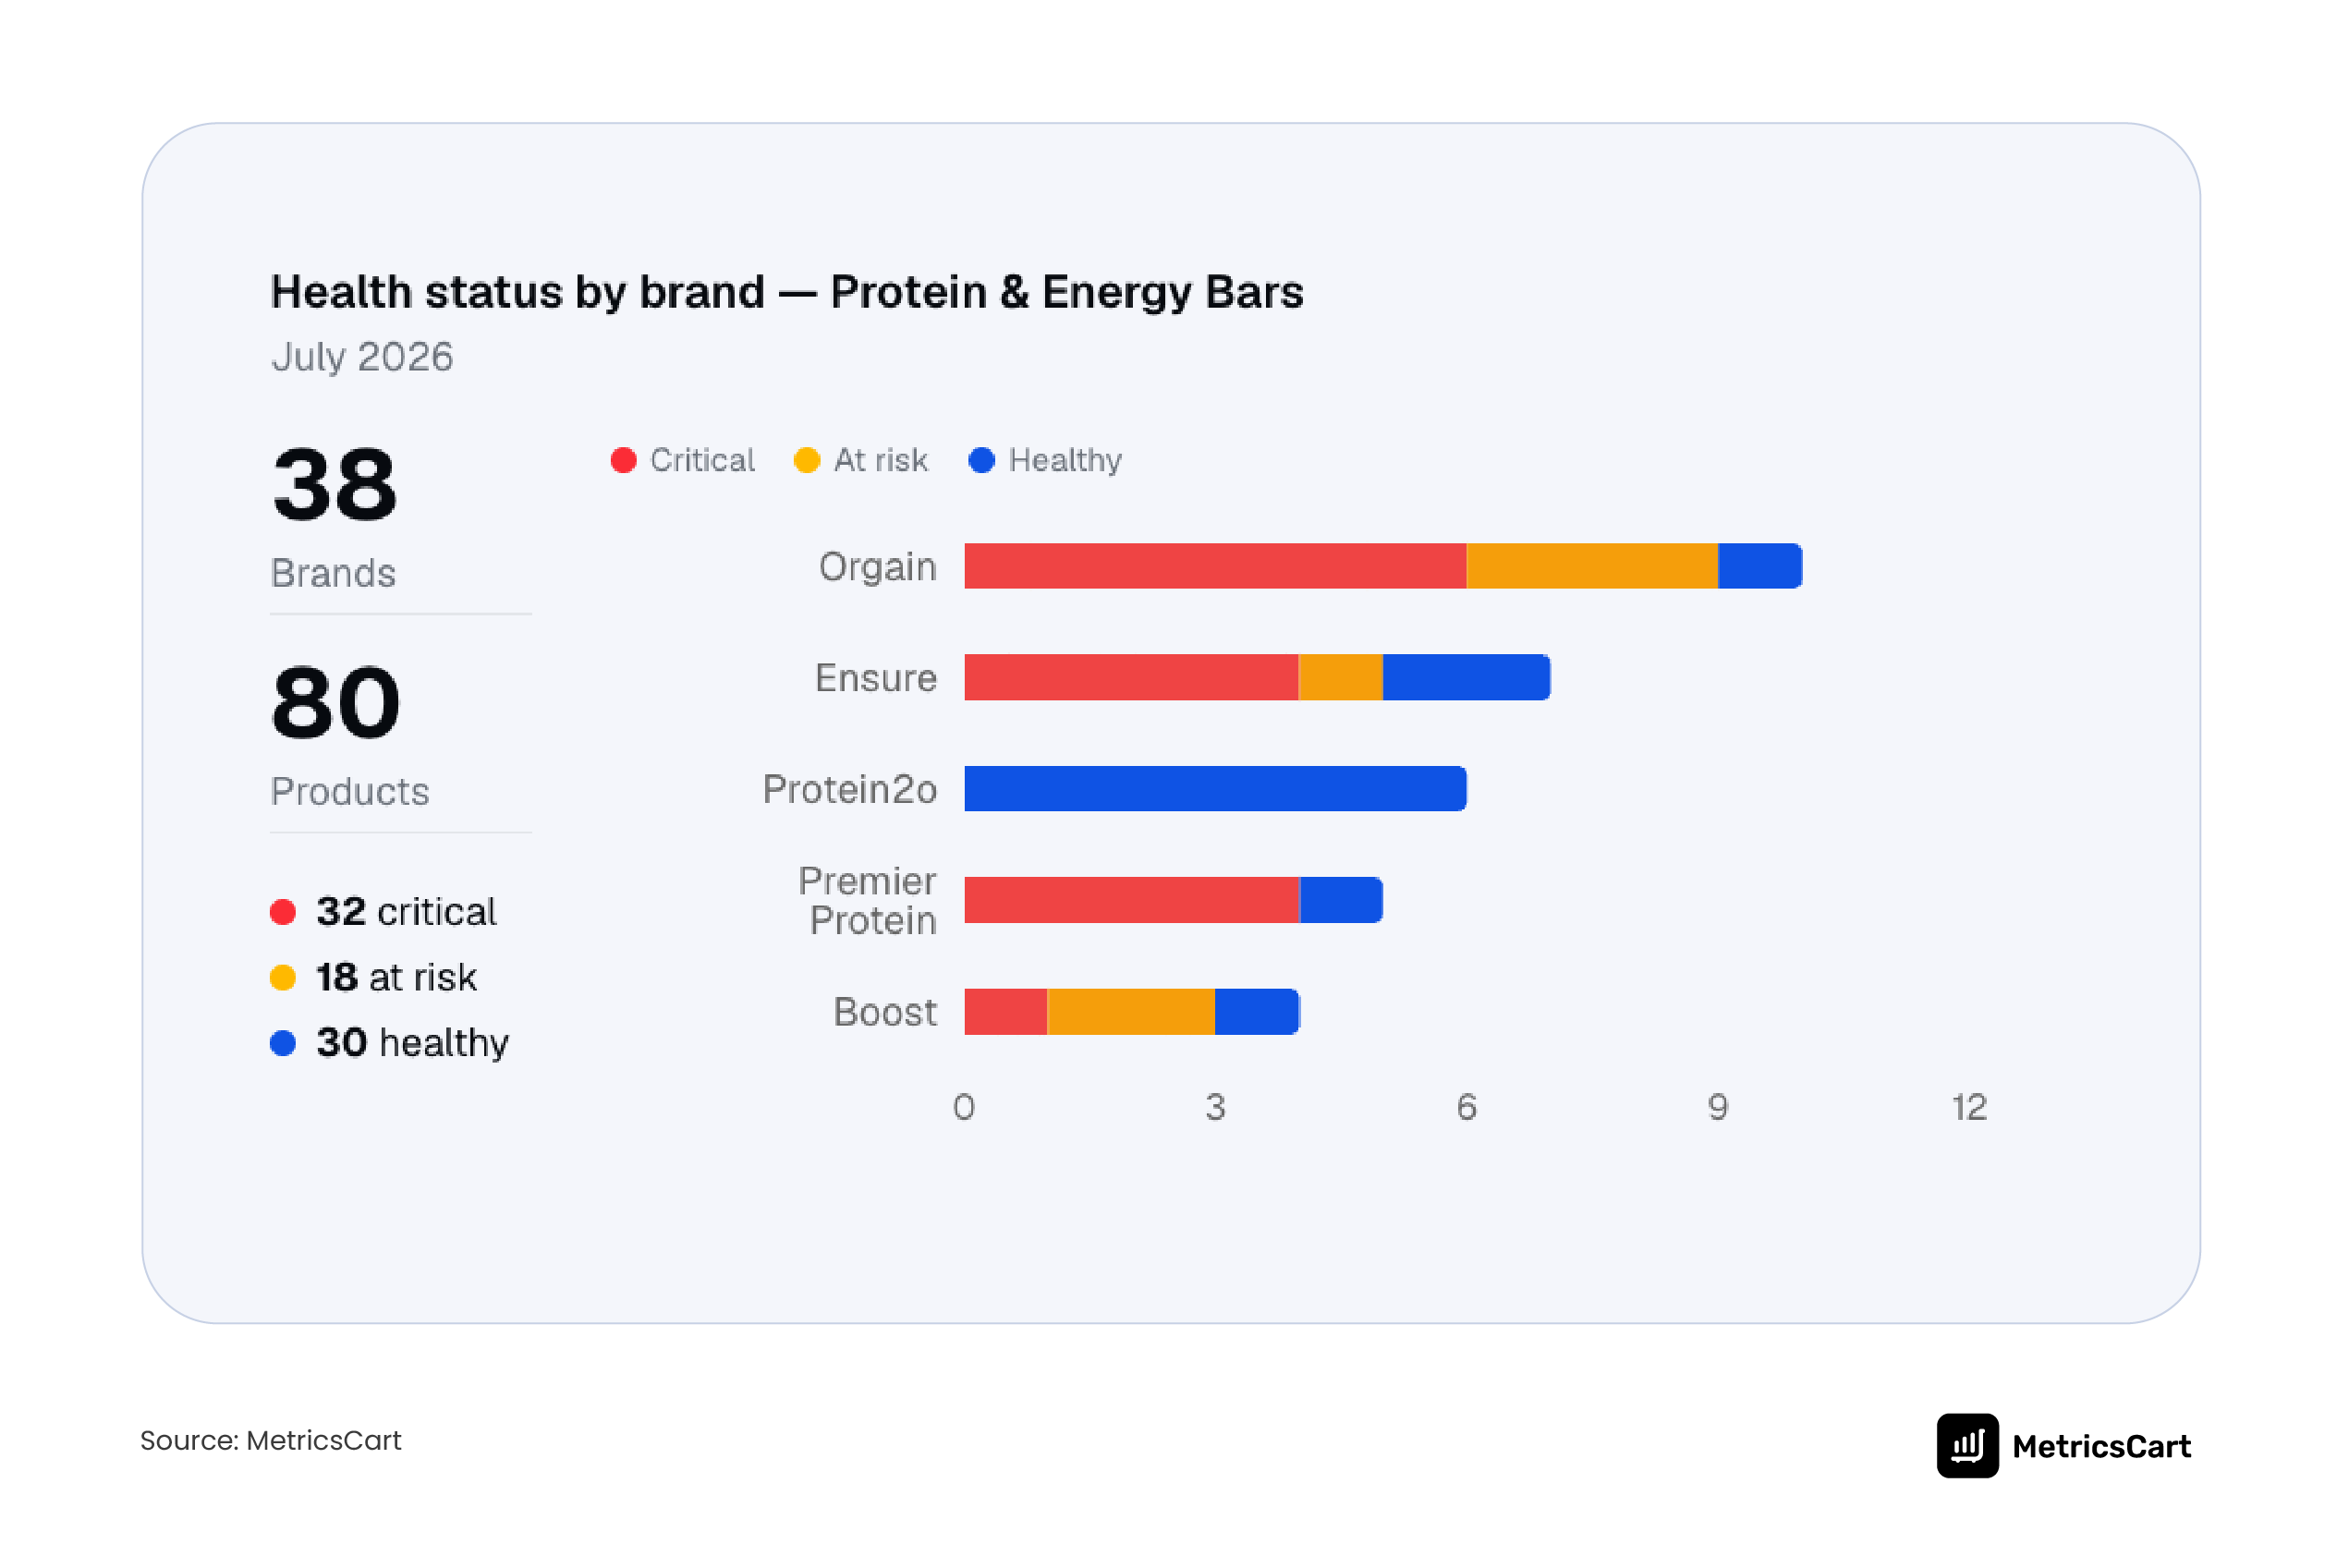
Without digital shelf tools that provide immediate alerts on these Critical deviations, a brand’s floor price can collapse, forcing legitimate 1P retail partners to stop ordering stock.
Share of Search & Visibility Optimization
On Amazon, out-of-sight means out-of-business. Digital shelf metrics track how your brand ranks for highly competitive organic keywords such as “Gluten-Free Protein” or “Keto Whey”. If an algorithm update or a competitor’s aggressive ad spend knocks you off the first page, digital shelf visibility tracking sounds an early alarm, helping you recalibrate your search engine optimization (SEO) and retail media spend.
Inventory & Out-of-Stock (OOS) Protection
Marketplace algorithms harshly penalize product listings that run out of stock by stripping their organic search rankings. Digital shelf tools bridge the gap between your supply chain and your live retail endpoints, ensuring that local or national inventory drawdowns are flagged before algorithmic suppression ruins months of paid marketing momentum.