Key Highlights
- Digital shelf metrics explain the factors that drive sales performance, not just the final outcome.
- A strong digital shelf starts with the fundamentals: visibility, content, availability, and pricing.
- Metrics like product availability, content quality, price position, and Buy Box ownership act as foundational indicators that influence search visibility, conversions, and revenue outcomes.
- Digital shelf performance is interconnected. A single issue can trigger multiple problems.
- Marketplace monitoring needs to be continuous, not periodic.
- Monitoring thousands of SKUs across multiple retailers requires automation, and for this, brands need a centralized digital shelf analytics platform like MetricsCart.
Introduction
Procter & Gamble (P&G), one of the world’s largest CPG companies, reported quarterly net sales of approximately $21.2 billion in its latest earnings report. A remarkable number, right?
While we don’t know the exact metrics P&G tracks internally, what we do know is that brands can only deliver results like these consistently when they get the fundamentals right on the digital shelf.
Products need to be easy to find, available when shoppers want them, competitively priced, and supported by accurate content and positive customer reviews. And these are outcomes that can be achieved only by measuring the right digital shelf score analytics, tracking the right metrics, identifying issues early, and continuously improving performance.
This guide covers the 11 most important digital shelf metrics every brand should track, what each one measures, and why they matter for ecommerce growth.
What Are Digital Shelf Metrics?
Digital shelf metrics are measurable indicators that help brands evaluate how well their products perform across online marketplaces and retailer websites.
They track the factors that influence product discoverability, availability, pricing, content quality, customer perception, and overall ecommerce performance.
Unlike traditional business KPIs, which measure outcomes such as revenue or profit, digital shelf metrics monitor the conditions that lead to those outcomes. Think of it this way. Business KPIs tell you what happened, while digital shelf metrics help explain why it happened.
For example, a decline in revenue doesn’t reveal whether customers couldn’t find your product, whether it was out of stock, or whether negative reviews discouraged purchases. Digital shelf metrics uncover these issues before they begin affecting sales, giving brands the opportunity to identify problems early and take corrective action.
Top 11 Digital Shelf Metrics to Track in 2026
Not every metric deserves equal attention. Some act as leading indicators of digital shelf performance, while others help explain why products gain or lose visibility, conversions, and sales.
Instead of tracking dozens of KPIs, focus on these 11 core digital shelf metrics that have the biggest impact on ecommerce performance.
| Pillar | Core Metric | What It Measures | Recommended Tracking Frequency |
| Visibility | Share of Search | Your brand’s visibility in search results compared to competitors for relevant keywords. | Daily (or real-time during campaigns and product launches) |
| Share of Shelf | The percentage of category shelf space occupied by your products versus competitors. | Daily to Weekly | |
| Product Display Page Quality | Content Compliance | Whether product listings meet retailer and brand standards for titles, images, descriptions, attributes, and other PDP elements. | Daily |
| Content Completeness | How complete and informative your product detail pages are across all required content fields. | Weekly (and after content updates) | |
| Availability & Assortment | Product Availability | Whether products are available for purchase across marketplaces, retailers, or store locations. | Real-time or Daily |
| Out-of-Stock (OOS) Rate | How often products become unavailable for purchase over a given period. | Real-time or Daily | |
| Assortment Coverage | The percentage of your planned product catalog available across retailers and marketplaces. | Weekly | |
| Pricing & Marketplace Position | Price Position | How your product’s price compares with competitors and category averages. | Real-time or Daily |
| Buy Box Ownership | The percentage of time your product wins the Buy Box on marketplaces with multiple sellers. | Real-time or Daily | |
| Customer Feedback | Average Rating | The overall star rating customers assign to your product. | Daily |
| Aspect-Based Sentiment | Customer sentiment toward specific product attributes such as quality, packaging, value, durability, or taste. | Weekly (or Daily for high-volume products) |

1. Visibility Metrics
Visibility is the starting point of every ecommerce purchase journey. Before shoppers can compare products, read reviews, or evaluate pricing, they first need to find your product. Even the best listing cannot generate sales if it doesn’t appear where customers are searching.
Share of Search shows whether your brand is gaining or losing visibility against competitors for high-value keywords. A declining share often signals that competitors are capturing more shopper attention.
Share of Shelf provides a broader view of your brand’s presence within a category. Instead of focusing on individual keywords, it helps measure how much digital shelf space your products occupy compared to competitors, making it easier to identify changes in overall category visibility.

In episode 30 of the Digital Shelf Insider podcast, Rohan explains how the definition of digital shelf intelligence is shifting with the rise of AI and LLMs. He discusses the new expectations of brands and agencies, including a demand for actionable recommendations and hyper-personalized dashboards. He also reveals a common problem: data overload.
Watch the full episode here:
2. Content Quality Metrics
Once shoppers reach your product page, the quality of your listing influences whether they continue to purchase or leave for a competitor. Complete, accurate, and engaging product content builds confidence, answers customer questions, and helps marketplace algorithms better understand your products.
Content Compliance is the digital shelf score analytics that helps ensures listings meet both retailer requirements and your brand standards. Maintaining consistent product information across channels improves customer trust while reducing content-related errors.
Content Completeness highlights whether shoppers have access to all the information they need before making a purchase. Missing images, specifications, feature bullets, or product attributes can reduce conversions and limit search visibility on many marketplaces.
Strong product content doesn’t just improve the customer experience. It also supports better discoverability and conversion across the digital shelf.
READ MORE | Amazon Product Title Policy Updates 2025: A Seller’s Guide to Title Optimization
3. Availability & Assortment Metrics
Product demand means very little if customers cannot complete a purchase. Availability and assortment are thus one of the most important digital shelf KPIs that help brands identify inventory and distribution issues before they lead to lost sales and dissatisfied customers.
Product Availability helps brands monitor whether products remain consistently purchasable across retailers, marketplaces, and locations. Frequent availability gaps can quickly affect customer trust and marketplace performance.
Out-of-Stock (OOS) Rate helps quantify how often products become unavailable. Repeated stockouts don’t just result in missed sales. They can also reduce search visibility and encourage shoppers to switch to competing brands.
Assortment Coverage reveals whether your complete product portfolio is reaching the market. Missing variants, pack sizes, or regional assortments can limit customer choice and reduce category growth opportunities.
Together, these metrics help ensure customers can always find and purchase the products they expect.
4. Pricing & Marketplace Position
Pricing influences far more than conversions. It affects competitiveness, profitability, marketplace visibility, and even which seller ultimately wins the sale. Monitoring pricing-related metrics helps brands maintain control while responding quickly to changing market conditions.
Price Position shows whether your products are priced competitively within the category. Accurate retail price monitoring helps brands balance growth and profitability without relying on unnecessary discounting.
Buy Box Ownership measures how consistently your product secures the primary purchase position on marketplaces like Amazon. Losing the Buy Box often means losing visibility and sales, even when your product listing remains active.
Monitoring these metrics also helps brands detect pricing inconsistencies, marketplace disruptions, and seller activity before they begin impacting revenue.
READ MORE | Improve Your Sales With Buy Box Monitoring: What Brands Need To Know
5. Customer Feedback Metrics
Customer feedback offers one of the clearest views into product performance because it comes directly from the people using your products. Reviews reveal not only whether customers are satisfied but also what they consistently appreciate or struggle with after purchase.
Average Rating remains one of the strongest trust signals on the digital shelf. Products with higher ratings generally attract more shopper confidence and achieve stronger conversion rates.
Aspect-Based Sentiment goes beyond the overall star rating by analyzing opinions about specific product attributes such as quality, packaging, durability, taste, scent, or value. This helps brands uncover recurring issues that might otherwise remain hidden inside thousands of customer reviews.
Together, these metrics help brands prioritize product improvements, strengthen customer satisfaction, and build long-term marketplace performance.
READ MORE | How Does Aspect-Based Sentiment Analysis Help Brands: A Complete Guide
How Digital Shelf Metrics Work Together
While the above are the core product performance metrics every brand should monitor, they don’t work in isolation. A change in one metric often influences several others.
For example, a product that goes out of stock may lose the Buy Box, which can reduce its search visibility and ultimately affect sales. Similarly, incomplete product content can lower conversion rates, making it harder for a product to maintain strong search rankings over time.
That’s why it’s important to look at these metrics as part of a broader measurement framework rather than as individual KPIs.
Which Digital Shelf KPIs Matter Most?
While all 12 metrics contribute to ecommerce performance, some have a much greater influence on the others. A good way to do digital shelf analytics is to prioritize metrics based on their impact.
Priority 1: Build a Strong Foundation
Start with the metrics that determine whether customers can discover and purchase your products.
- Product Availability keeps products purchasable across retailers and marketplaces.
- Content Quality ensures shoppers have the information they need while improving marketplace visibility.
- Price Position helps products remain competitive without sacrificing margins.
These foundational metrics influence almost every other aspect of digital shelf performance. If a product is out of stock, poorly optimized, or significantly overpriced, improvements in other metrics will have limited impact.
Competitive pricing isn’t just about matching your competitors. Brands also need a well-defined Minimum Advertised Price (MAP) policy to prevent unauthorized discounting, protect brand value, and maintain healthy retailer relationships. Continuously monitoring and enforcing MAP compliance helps identify violations early before they impact pricing consistency, profitability, and brand perception. MAP monitoring software like MetricsCart automates violation detection, evidence collection, and enforcement across online retailers, making it easier to protect pricing integrity at scale.
Priority 2: Improve Visibility and Customer Trust
Once the fundamentals are in place, focus on the metrics that help attract shoppers and build confidence.
- Share of Search
- Share of Shelf
- Buy Box Ownership
- Average Rating
- Aspect-Based Sentiment
Together, these metrics determine how easily customers discover your products and how likely they are to choose them over competing options.
READ MORE | The Hidden Costs of Inconsistent Product Content: Are You Losing Sales?
Priority 3: Measure Business Outcomes
Finally, monitor business KPIs such as revenue, traffic, conversion rate, and sales growth to evaluate whether improvements on the digital shelf are translating into commercial results.
Rather than chasing every KPI at once, focus on fixing the foundational metrics first. Improvements in availability, content, pricing, and customer experience often lead to stronger visibility, better conversions, and sustainable ecommerce growth over time.
How MetricsCart Helps Track Digital Shelf Metrics
Ecommerce marketplaces are highly dynamic. Prices change by minute, listings get updated without notice, competitors adjust their strategies, and inventory levels and consumer sentiments fluctuate frequently.
Because of this constant movement, brands must accurately and continuously track their digital shelf score to identify issues before they affect performance.
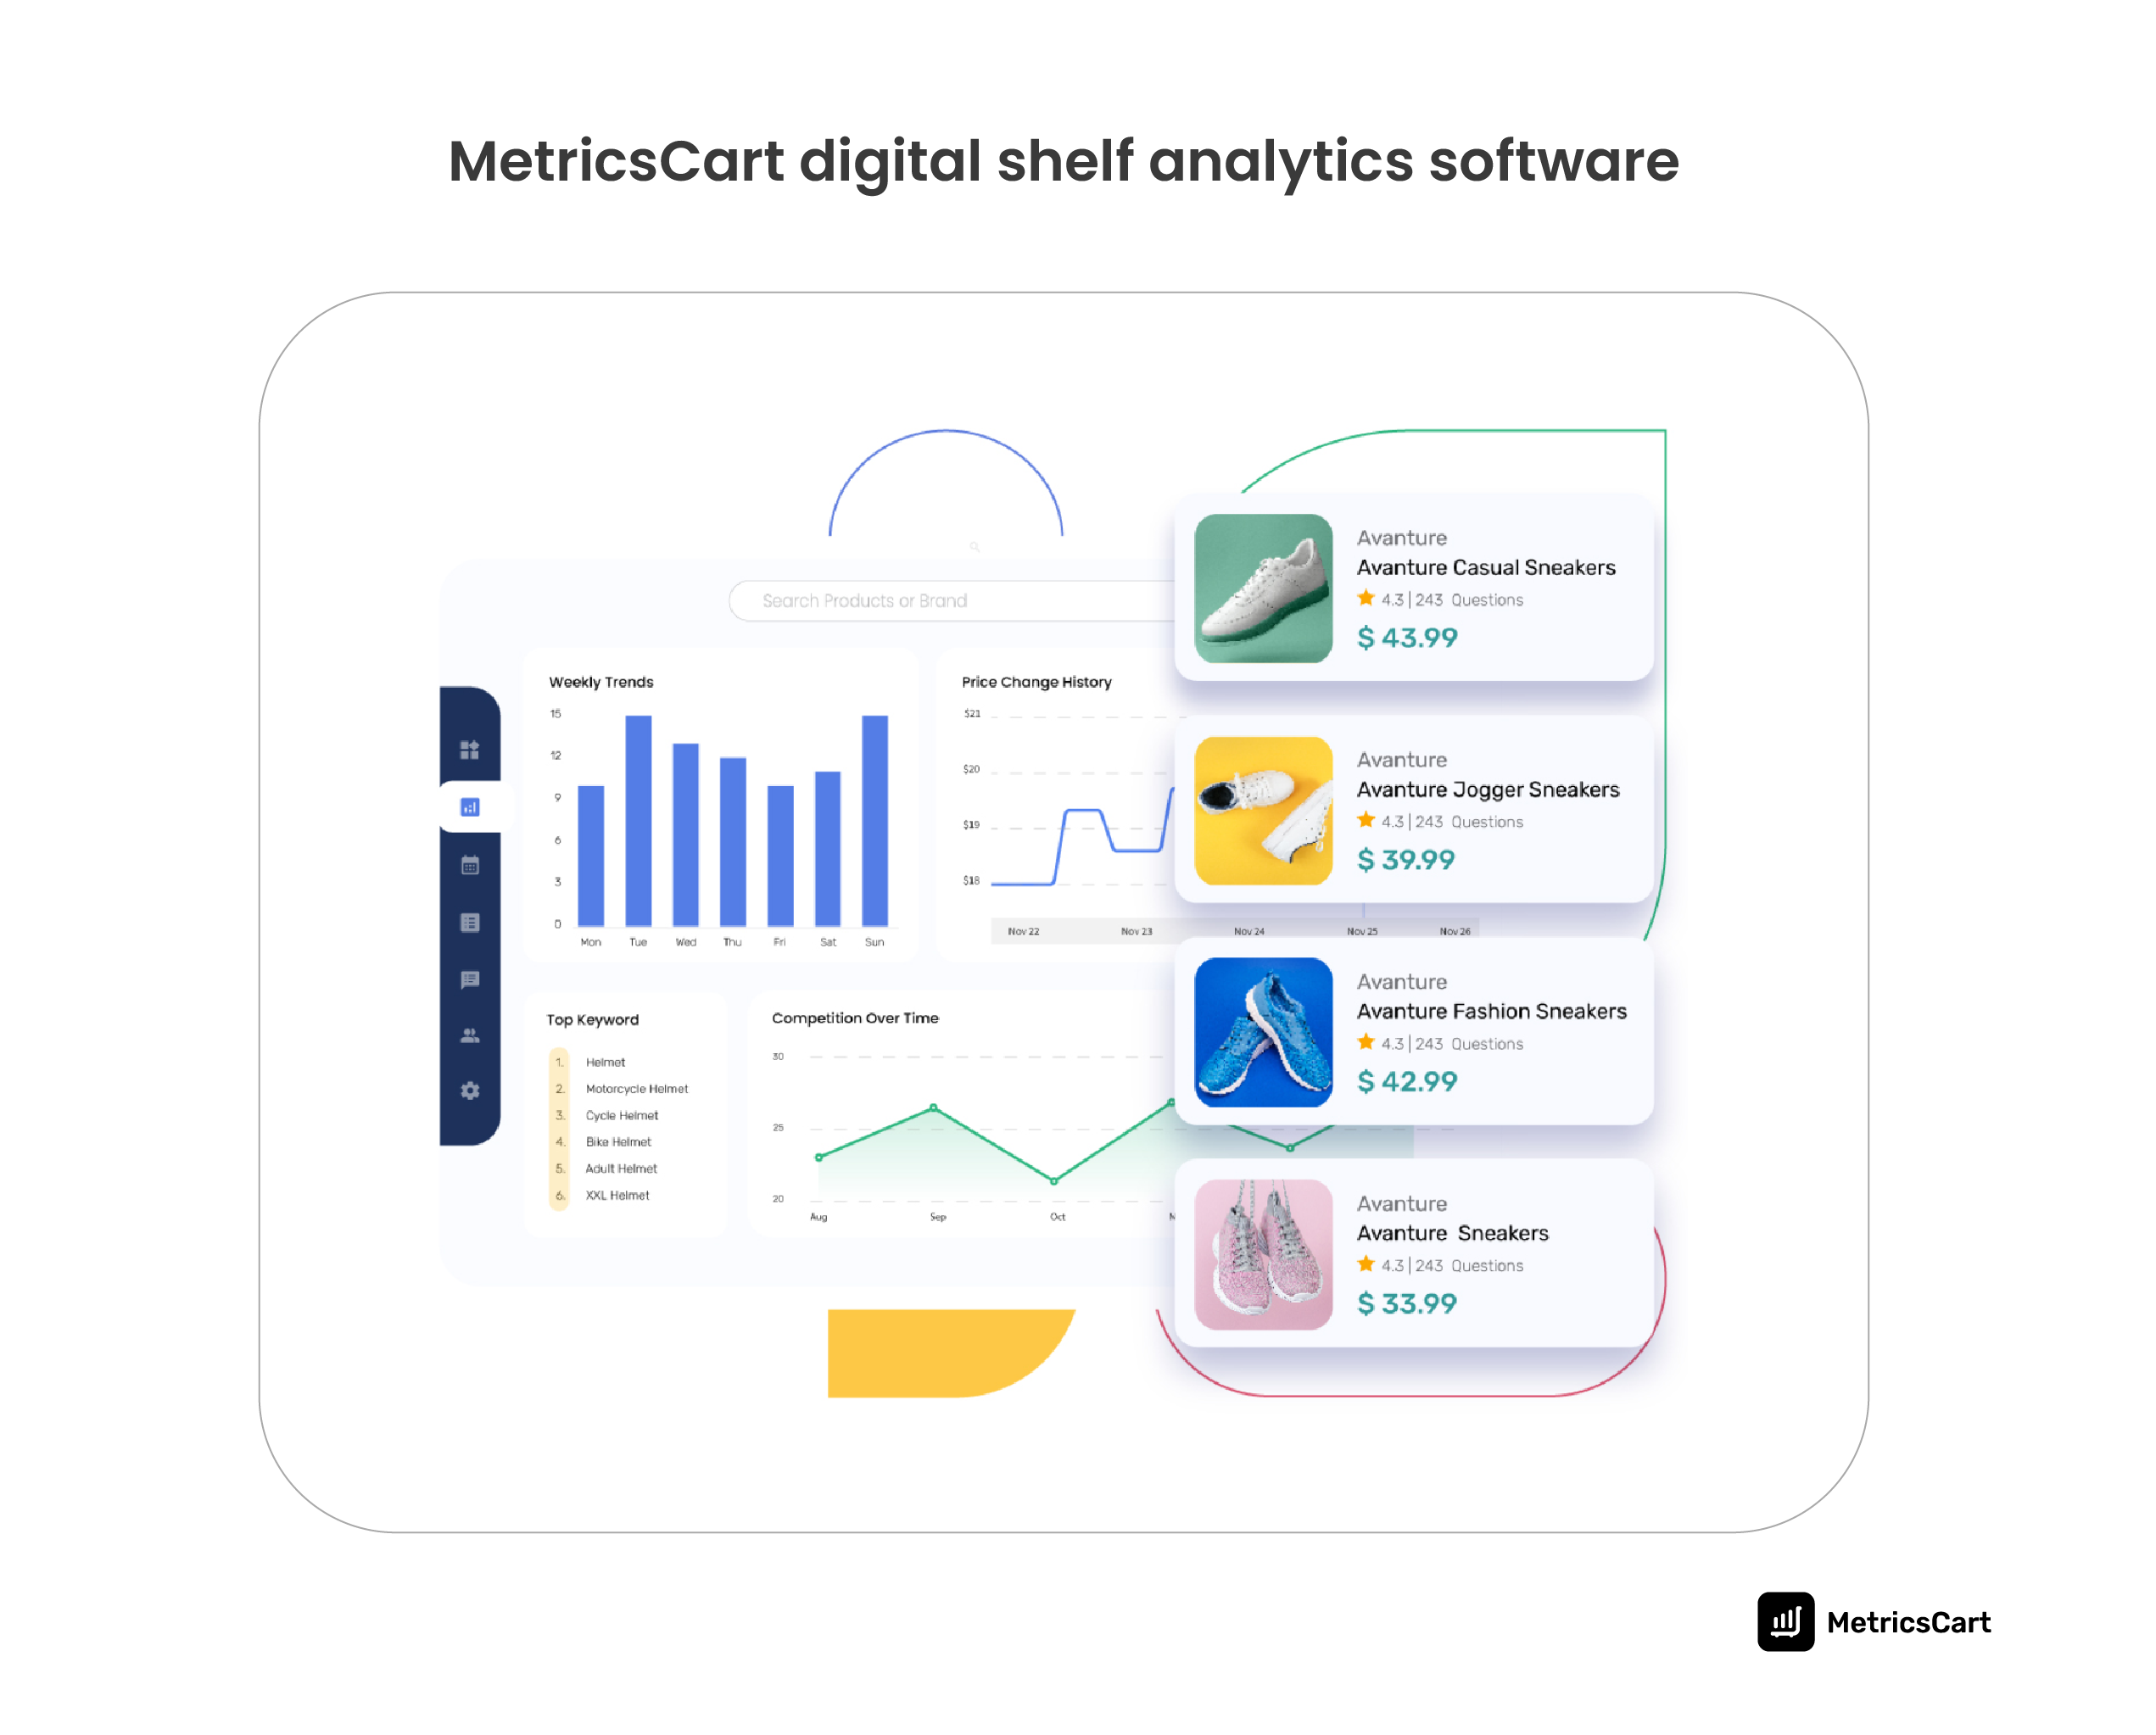
A digital commerce intelligence platform like MetricsCart helps brands overcome this challenge. Instead of relying on multiple tools to monitor different areas of digital shelf performance, MetricsCart brings critical metrics together in one customizable platform.
Brands can use MetricsCart to track visibility, content compliance, pricing, promotions, availability, assortment, Buy Box performance, and aspect-based consumer intelligence from a single place, aligned with the metrics and workflows that matter most to their business.
With coverage across 150+ retailers and marketplaces, MetricsCart helps global CPG teams benchmark competitors, identify performance changes early, and take action before marketplace issues impact revenue.
Accurately Track Every Digital Shelf Metrics That Shape Your E-commerce Success with MetricsCart.
FAQs
A digital shelf score is a composite measure of a product’s overall performance across multiple digital shelf metrics. It typically combines factors such as search visibility, content quality, product availability, pricing, ratings, reviews, and Buy Box performance into a single score, making it easier for brands to evaluate and improve ecommerce performance.
Digital shelf metrics measure the factors that influence product performance, such as visibility, pricing, content quality, availability, and customer sentiment. Ecommerce KPIs measure business outcomes like revenue, conversion rate, average order value, and sales growth. Digital shelf metrics help brands understand why those business KPIs improve or decline.
The ideal tracking frequency depends on the metric. Pricing, product availability, Buy Box ownership, and search visibility should be monitored daily or in real time because they change frequently. Metrics such as content completeness and assortment coverage can typically be reviewed weekly, while customer sentiment should be monitored continuously for emerging trends.
Product performance often varies between retailers because search algorithms, pricing, assortment, customer reviews, and competitor activity differ from one marketplace to another. Monitoring digital shelf metrics across multiple channels helps brands identify retailer-specific issues and maintain a consistent customer experience everywhere they sell.
Brands often struggle with fragmented data, frequent marketplace changes, inconsistent retailer standards, thousands of SKUs, and manual reporting. As marketplaces become more dynamic, doing digital score analytics across multiple retailers requires automation and centralized analytics to provide timely, actionable insights.