If you think simply having a product online is enough to win on the digital shelf, you’re already losing. To ensure success in e-commerce, you need to optimize every inch of your digital shelf.
The question is: How do you know if your content’s really working? That’s where product content KPIs come into the picture. They provide insights into your product page performance and identify potential content opportunities.
Moreover, with the right content compliance monitoring software—like what MetricsCart offers—you can track them, improve your online performance, and outplay the competition.
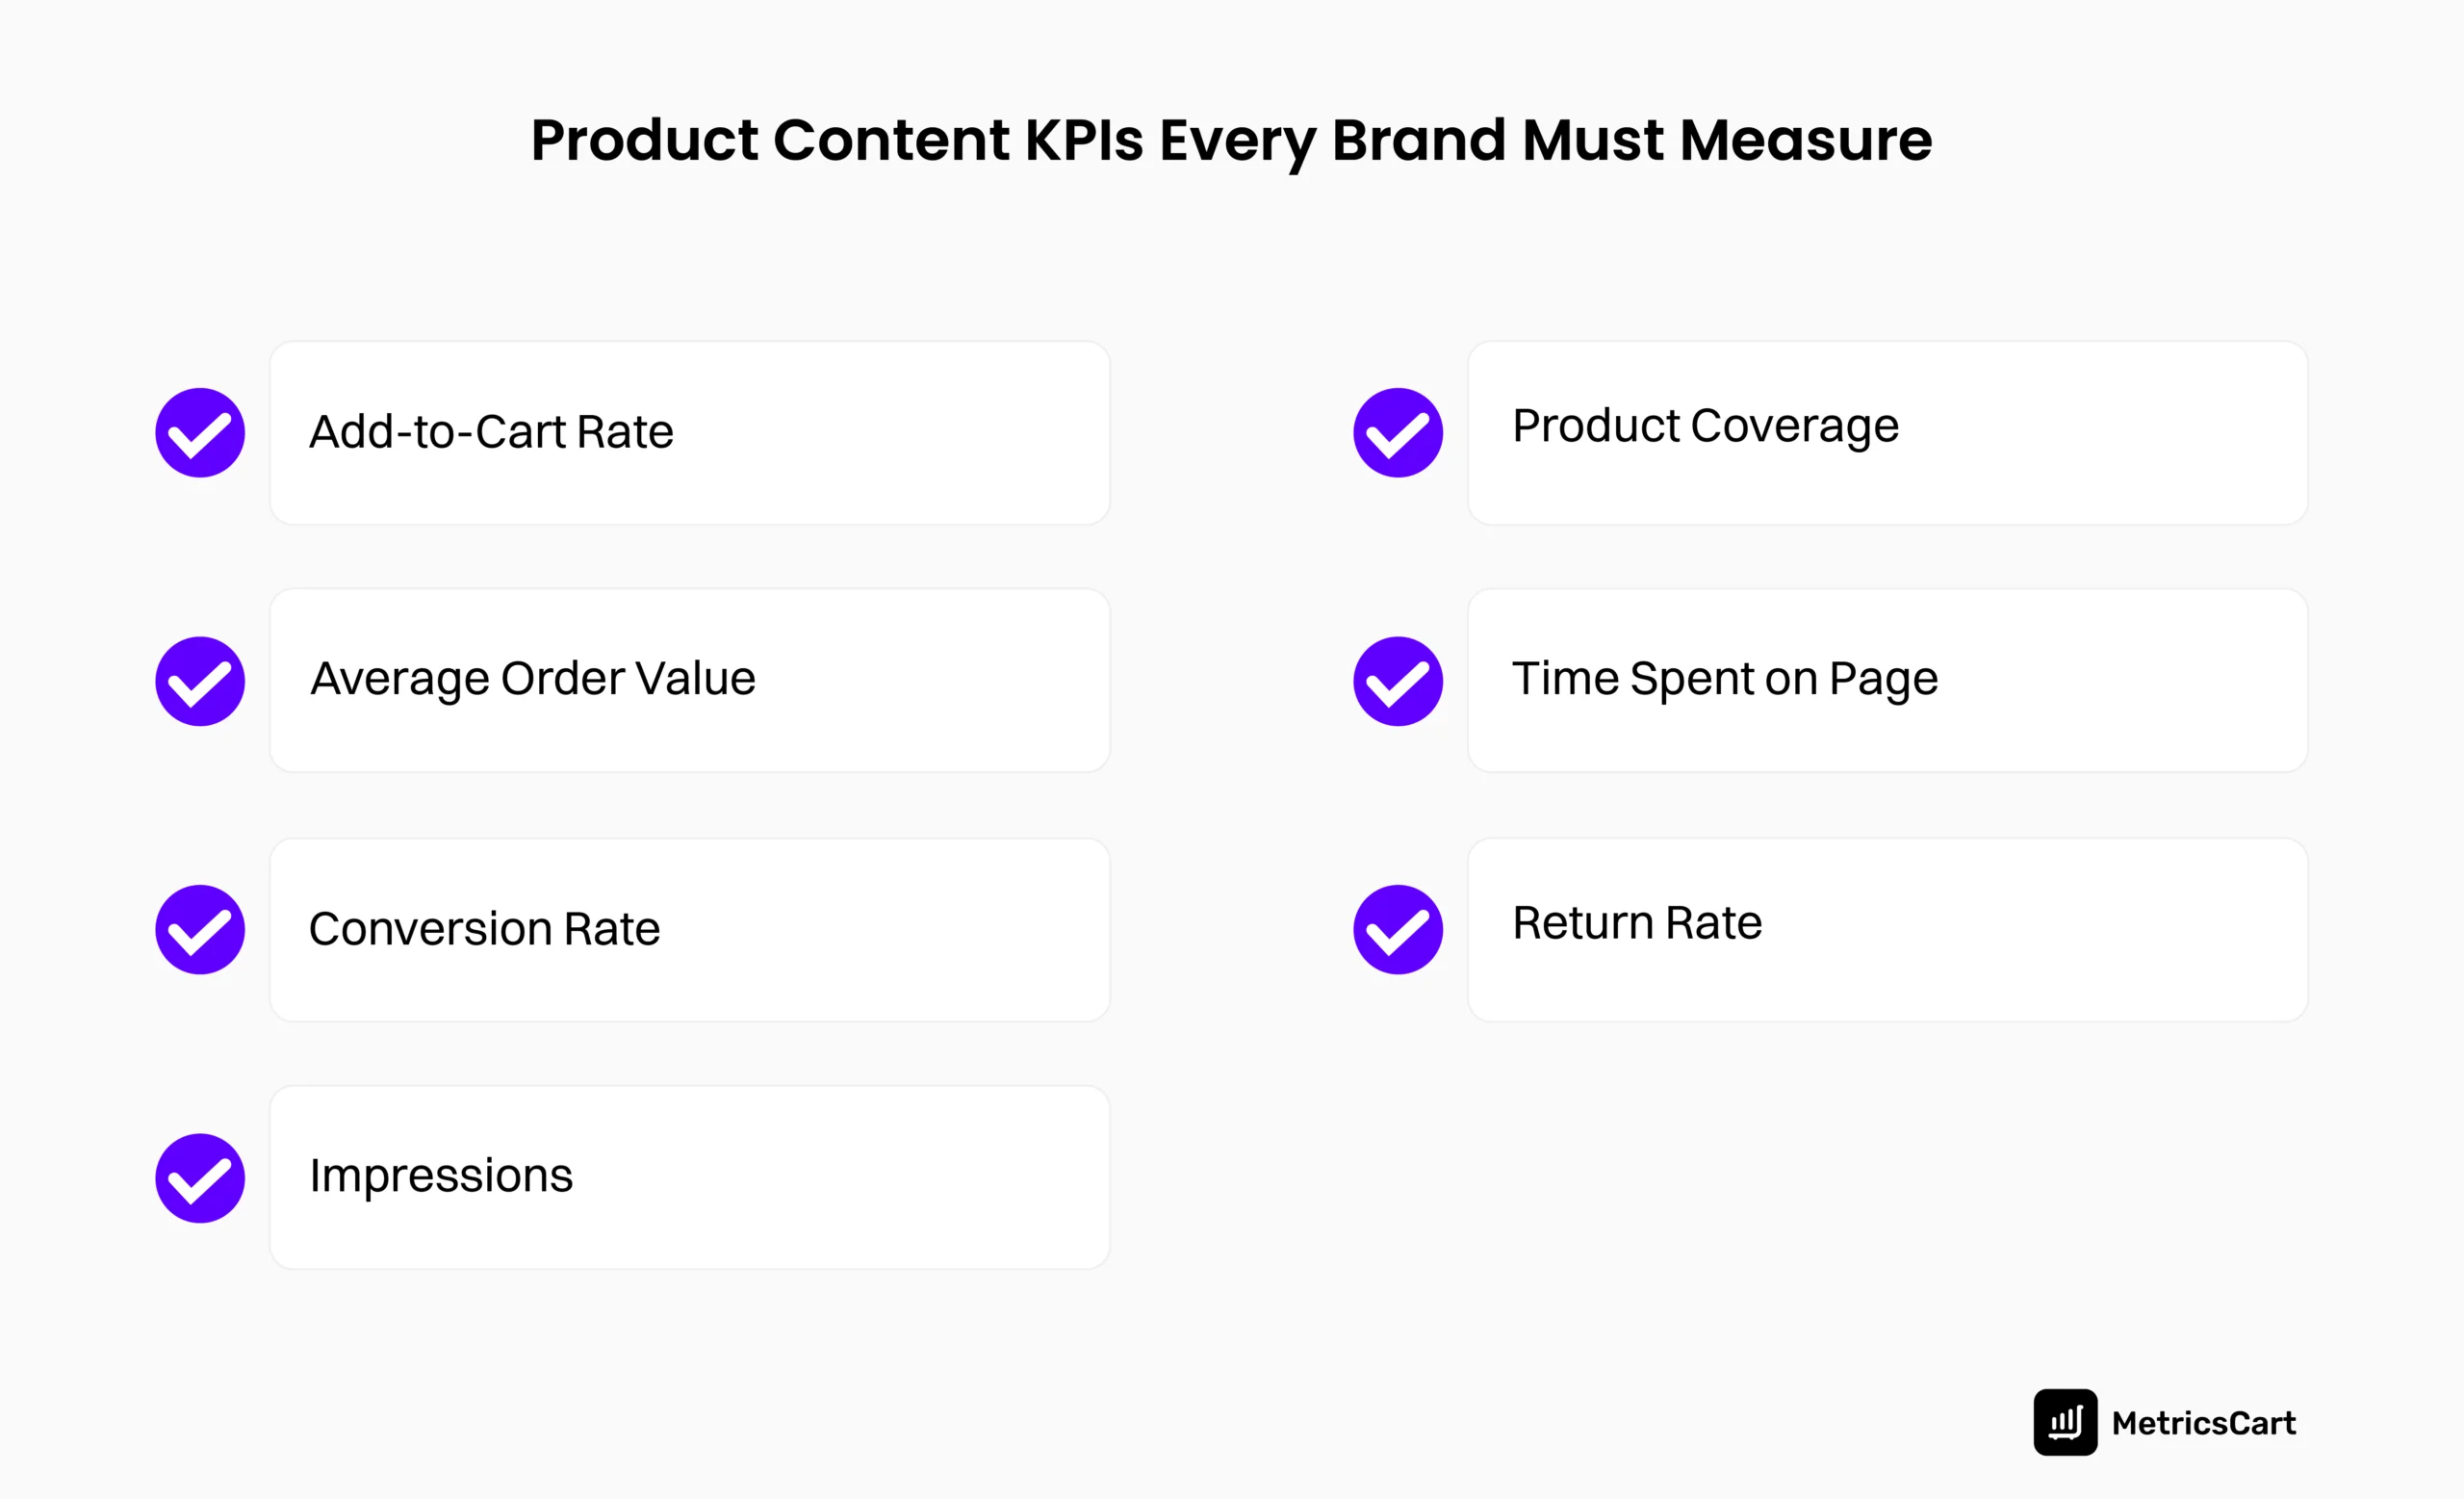
7 KPIs To Measure Your Product Content Strategy
Add-to-Cart Rate
The add-to-cart rate shows you the percentage of page visitors who have clicked your “Add to cart” or “Buy” button and added the product to their shopping cart.
It is calculated as follows:
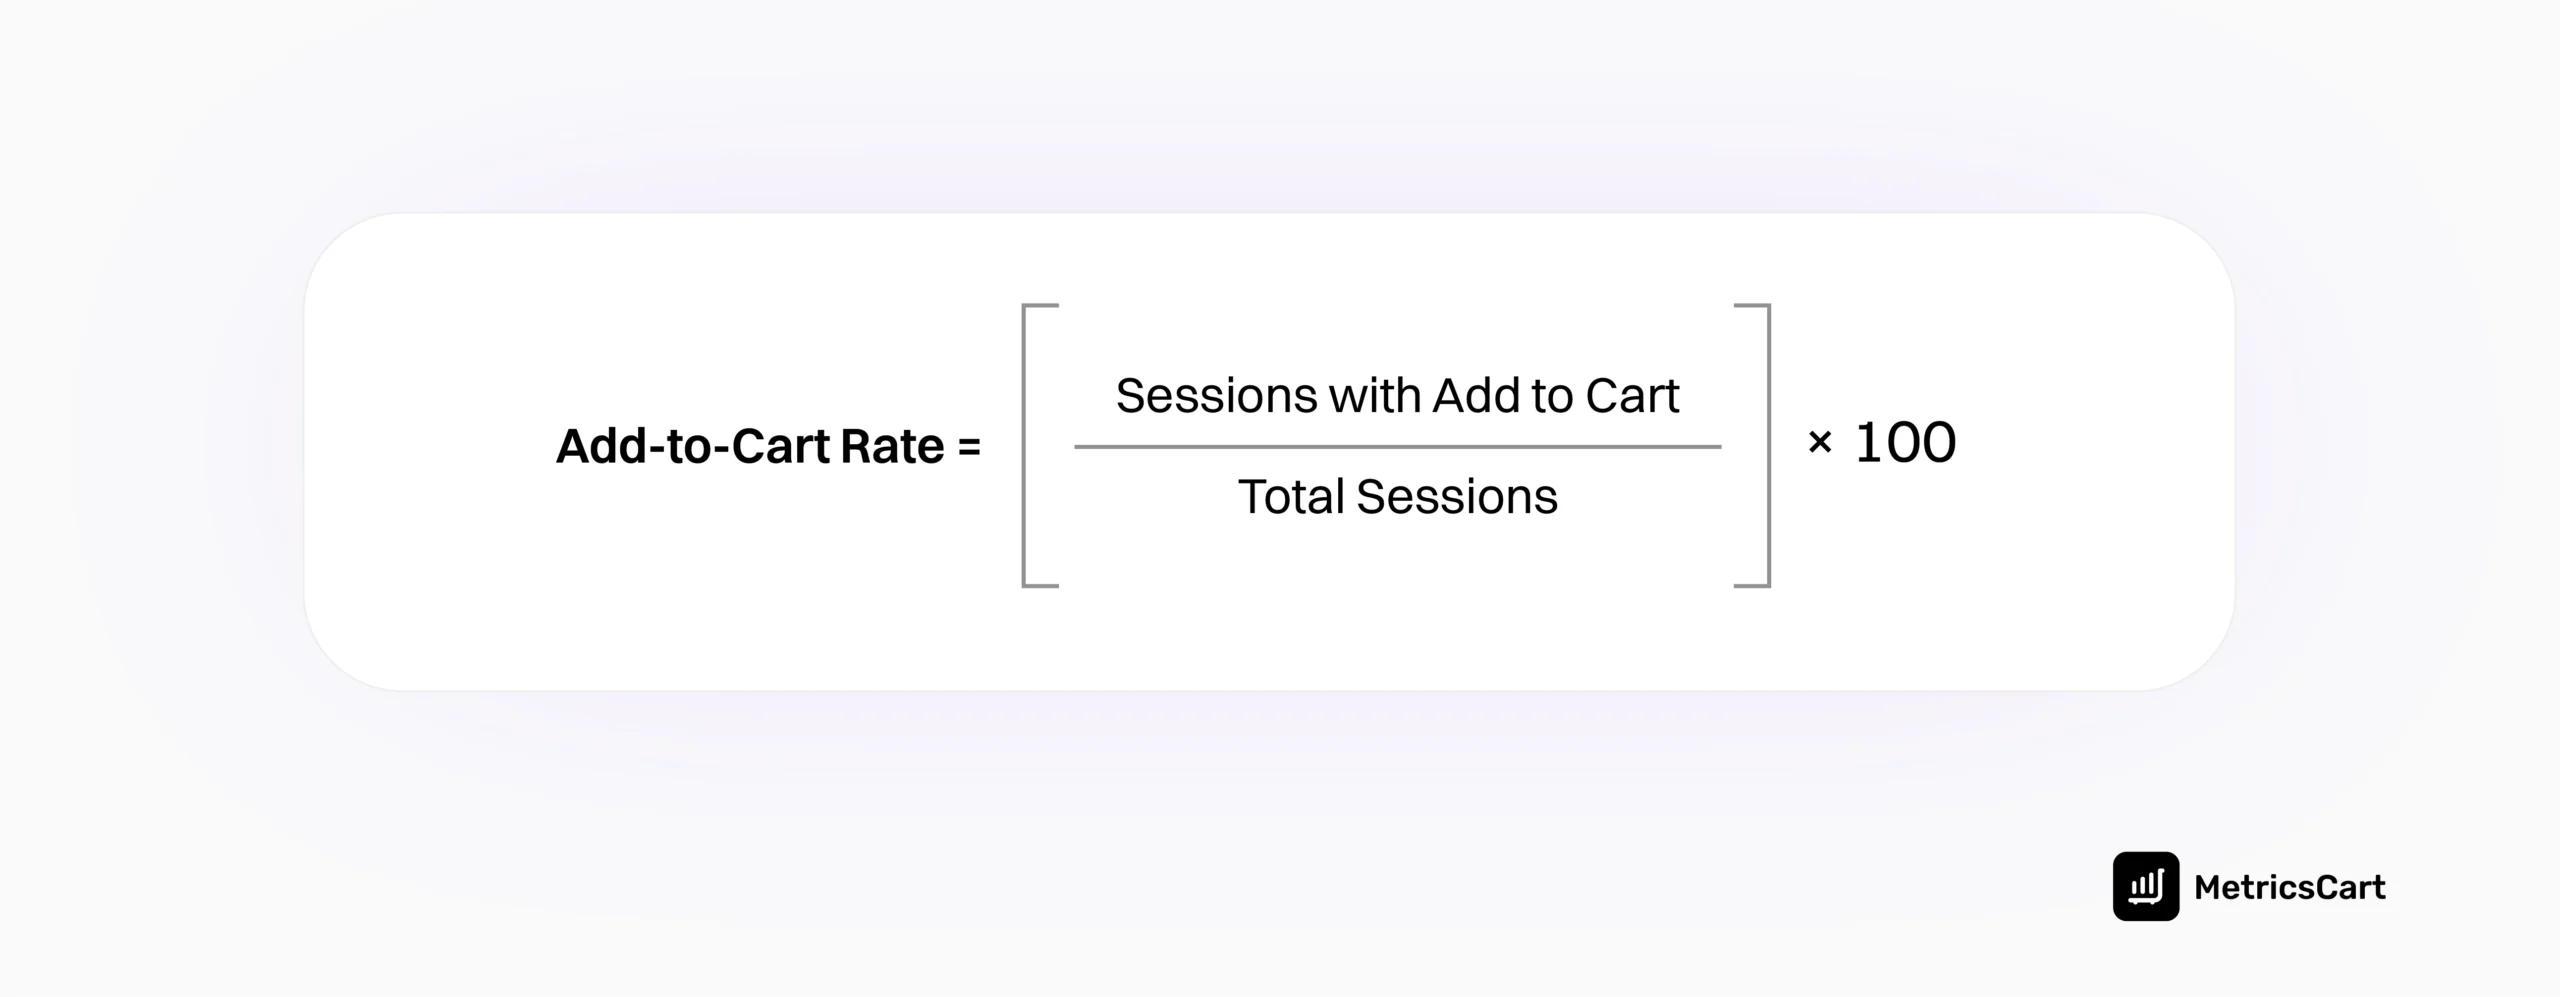
The higher your add-to-cart rate, the more certain you can be that your product content is doing its job well. It indicates that product descriptions, visuals, and pricing resonate well with visitors and shows whether your product page content effectively drives purchasing behavior.
Average Order Value
Average Order Value (AOV) measures the average total of each customer order. It gives insight into consumer purchasing patterns and helps you adjust your product offerings or marketing strategies.
It is calculated by:
Average Order Value (AOV) measures the average total of each customer order. It gives insight into consumer purchasing patterns and helps you adjust your product offerings or marketing strategies.
It is calculated by:
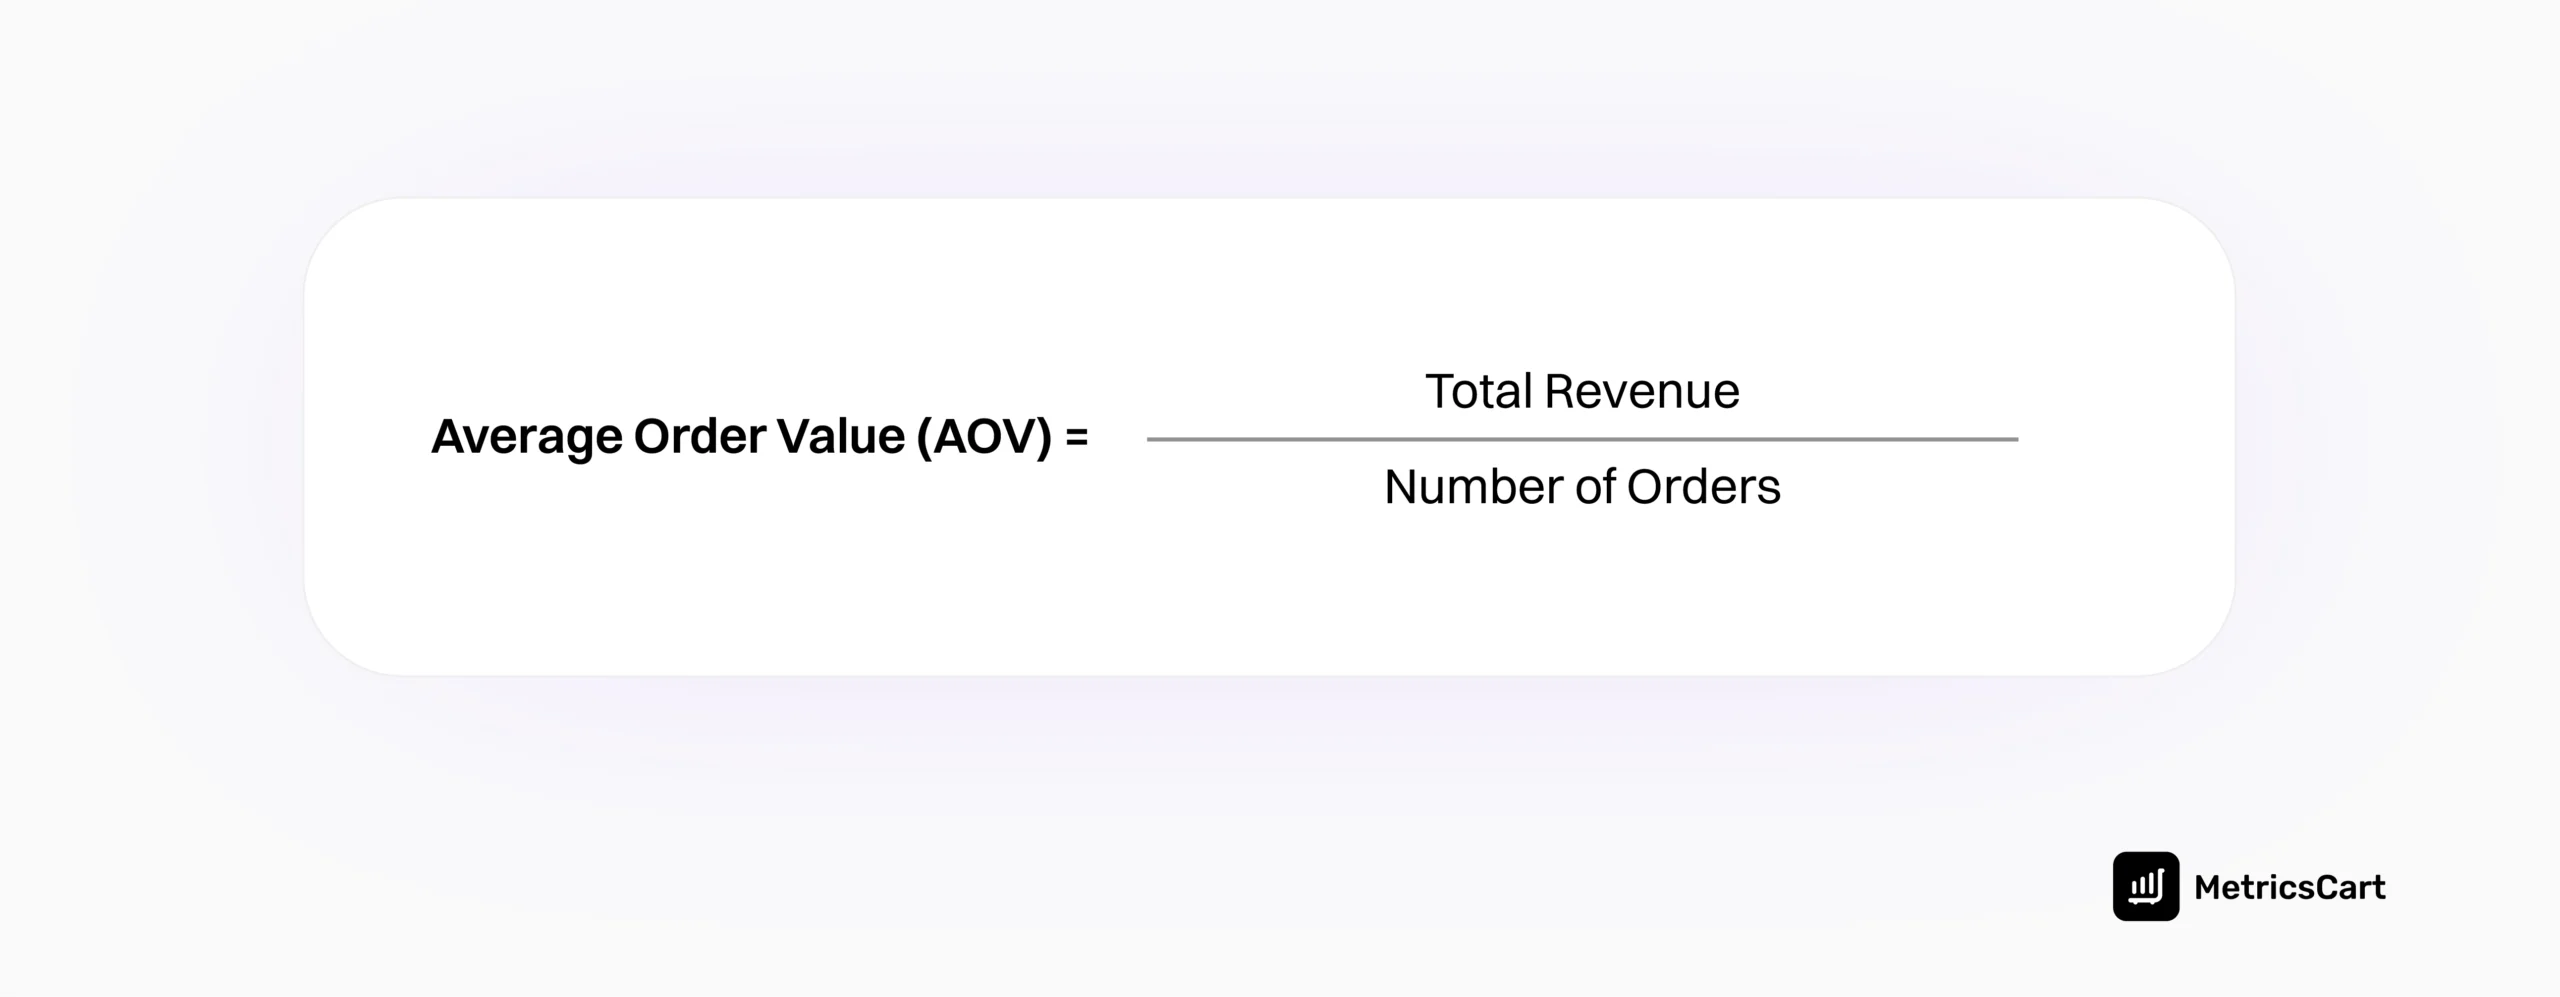
A higher AOV suggests that upselling or bundling strategies are working effectively. To improve the AOV, you can cross-sell related products or offer discounts on higher quantities. For example, by suggesting complementary products in your content (such as “Customers also bought”), you can incentivize shoppers to add more to their cart.
Conversion Rate
The Conversion Rate measures the percentage of visitors to your PDP who complete a purchase. By analyzing this KPI, you can assess how well your content is optimized to convert browsers into buyers. It directly correlates with your overall sales performance.
High conversion rates indicate that your product descriptions, images, and CTAs are effectively persuading customers to purchase.
Impressions
Impressions track the number of times your product page is viewed, regardless of whether it leads to an action. This product detail page KPI helps gauge the visibility and reach of your products on the digital shelf.
However, impressions alone aren’t enough—you need high-quality content to convert them into clicks and sales. Therefore, if your products have high impressions but low conversion rates, you need to refine the product content strategy.
Product Coverage
Product coverage measures the extent to which available products are displayed or marketed on an e-commerce platform. It can be measured by analyzing where your products are listed and whether they meet the content guidelines, such as descriptions, images, specifications, etc.
Therefore, you need to ensure that all your product details are filled out on every platform and regularly audit your listings for accuracy. Platforms like MetricsCart content compliance monitoring software can help you ensure your product information is compliant and consistent across all channels.

Time Spent on Page
Time spent on the page measures how long users stay on your product detail page before navigating away. It indicates how compelling and informative your product content is. The longer a user stays on a page, the more engaged they are with your content.
If users spend minimal time on pages, this may suggest that product descriptions or images are not compelling enough, necessitating improvements in content quality. Therefore, you need to answer all the potential questions in your listing so they don’t leave to find information elsewhere.
Return Rate
Return rate refers to the percentage of products returned after purchase. A high return rate can signal problems with your product descriptions or images, including discrepancies between product information and the product itself.
When product content doesn’t match customer expectations, it leads to dissatisfaction and returns, which ultimately hurts your bottom line. Thus, brand managers should ensure that the product descriptions and images align with the product. Moreover, you can include customer reviews and sizing charts, which can help set accurate expectations and reduce returns.
READ MORE | Want to Learn Why Content Compliance is Important for Product Pages? Check out Content Compliance on Product Detail Pages: Why It Matters?
Conclusion
Working on improving these KPIs is just the first step. You need to convert these KPIs into informed decisions for product page optimization to drive real ROI.
With a robust content compliance and optimization solution like MetricsCart, you’re not just collecting data—you’re getting real-time, actionable insights to edge to optimize content and ensure your strategy is always one step ahead.
Ready to Improve Your Product Content Strategy?


